Essay
Below is a figure showing LTP that was induced by high frequency stimulation (indicated by the arrow) at 0 minutes (traces 1 - 3). 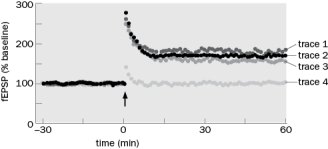 Figure Q10-11
A. What would happen to LTP if the NMDARs were blocked with APV? Which trace would be generated?
B. What would happen if an NMDAR with a higher ion channel conductance than normal was expressed in the postsynaptic cell? Which resulting trace would be generated?
Correct Answer:

Verified
The result would look like trace 4. If t...View Answer
Unlock this answer now
Get Access to more Verified Answers free of charge
Correct Answer:
Verified
View Answer
Unlock this answer now
Get Access to more Verified Answers free of charge
Q19: Which is true for spike-timing-dependent plasticity? Select
Q20: Why does the NMDAR provide a good
Q21: The Morris water maze has been used
Q22: The advantage of working with Drosophila is
Q23: Aplysia display many forms of learning including
Q25: Taking together the results in Figure Q10-37,
Q26: What is synaptic plasticity?
Q27: For the left graph, rats were given
Q28: How is LTD generated? Choose all that
Q29: The amnesic patient, H.M., lost the ability