Multiple Choice
The accompanying figure shows the decision tree of an operations manager who is considering a new production technique. ER represents his expected return (in thousand $) from the new technique. If he does not adopt the technique his expected return would be zero. The probabilities of the technique being a success or a failure are .7 and .3 respectively. Compute the expected return (in thousand $) from the adoption of the new production technique. 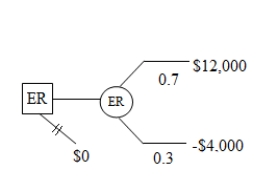
A) $8,400
B) $1,000
C) -$2,000
D) $7,200
E) $8,000
Correct Answer:

Verified
Correct Answer:
Verified
Q6: How are certainty equivalent and attitude toward
Q7: Firm X is currently selling a
Q8: If a decision is made on the
Q9: A chemical company is in the
Q10: When there is multiple possible outcomes from
Q12: A convenient way to represent decisions, chance
Q13: If a fair coin is tossed 1,000
Q14: Define probability with an example.
Q15: Which of the following is true of
Q16: An investor estimates the expected return of