Multiple Choice
The following figure shows the demand curve ES, the average cost curve AC, the marginal cost curve MC, and the marginal revenue curve MR for a firm.
Figure 8-1
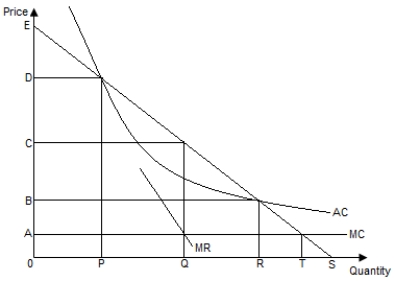
-Refer to Figure 8-1. If the firm operates as a monopoly in an unregulated market, its profit-maximizing price and output would be _____, respectively.
A) C and Q
B) A and Q
C) B and R
D) D and P
E) A and T
Correct Answer:

Verified
Correct Answer:
Verified
Q22: Based on your understanding of monopolistic competition,
Q23: Which of the following is true of
Q24: Carefully define and describe a natural monopoly.
Q25: Which of the following does not contribute
Q26: A monopoly earns positive economic profits in
Q28: A market is considered a pure monopoly
Q29: When competing firms or nations collude to
Q30: A monopolist faces the price equation: P
Q31: Which of the following is the best
Q32: Why are substantial economies of scale considered