Multiple Choice
The following figure shows the long-run average cost curve of a firm.
Figure 6-1
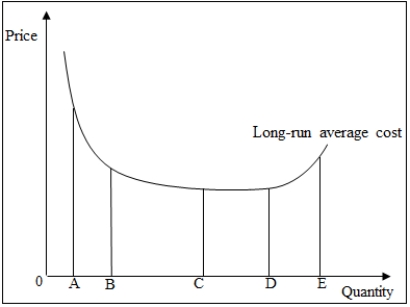
-Refer to Figure 6-1. The production function of the firm displays increasing returns to scale at all levels of output between _____.
A) A to E
B) C to D
C) D to E
D) A to C
E) B to E
Correct Answer:

Verified
Correct Answer:
Verified
Related Questions
Q26: A firm that produces and sells
Q27: If the price of a product consistently
Q28: The average variable cost of producing 1,
Q29: A firm will continue to operate in
Q30: Firm K is a leading maker of
Q32: A law firm will be paid $500
Q33: The following figure shows the long-run average
Q34: A firm that produces and sells
Q35: A firm produces 100 units of good
Q36: Amanda invests $500,000 in a new business