Multiple Choice
The following figure shows the long-run average cost curve of a firm.
Figure 6-1
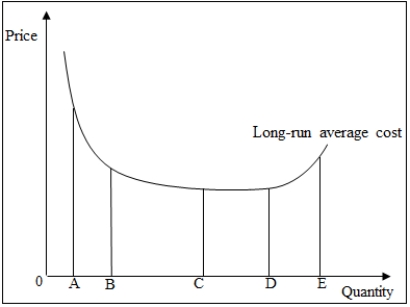
-Refer to Figure 6-1. The production function of the firm displays decreasing returns to scale at all levels of output between _____.
A) A to E
B) C to D
C) D to E
D) A to B
E) B to D
Correct Answer:

Verified
Correct Answer:
Verified
Related Questions
Q17: Explain how each of the following events
Q18: The economic profit on an investment is
Q19: If short-run average cost is increasing then:<br>A)
Q20: A firm's long-run average cost curve is
Q21: The minimum efficient scale is important in
Q23: A profit-maximizing firm should shut down in
Q24: Assume that the minimum efficient scale for
Q25: Assume that an investor invests $100,000 in
Q26: A firm that produces and sells
Q27: If the price of a product consistently