Multiple Choice
The following figure shows the long-run average cost curve of a firm.
Figure 6-1
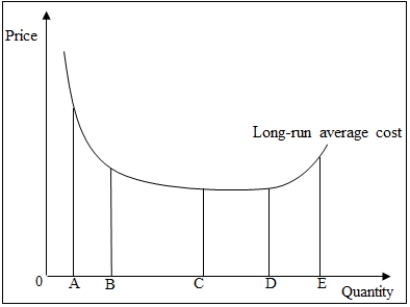
-Refer to Figure 6-1. What is the quantity that the firm will produce if it is operating at minimum efficient scale?
A) E
B) A
C) C
D) D
E) B
Correct Answer:

Verified
Correct Answer:
Verified
Related Questions
Q3: A firm produces 100 units of output
Q4: Explain the economic logic of the short-run
Q5: The production manager of a clothing manufacturer
Q6: If a firm were to stop production
Q7: When average total cost is at its
Q9: A firm's total cost function is: C
Q10: The table gives the short-run production
Q11: When the long-run average cost is at
Q12: Mexico is capable of producing 20 auto
Q13: "All fixed costs are sunk costs and