Deck 12: Analysis & Interpretation: Individual Variables Independently
Full screen (f)
Question
Question

-Refer to Exhibit 12.2. What is the average number of televisions per household?
A)2.00
B)1.85
C)1.52
D)2.25
E)2.74
Question
Question
-Refer to Exhibit 12.2. What is the sample standard deviation?
A)0.4318
B)0.3246
C)0.6571
D)1.0239
E) Can't be determined from the table.
Question
120 field mice are weighed. The average weight of a mouse is 225 grams and the sample standard deviation is 15.1 grams.
-Refer to Exhibit 12.5. The estimated value of the standard error of the mean( ) is:
) is:
A)0.6.
B)0.9.
C)1.6.
D)2.6.
E)3.0.
-Refer to Exhibit 12.5. The estimated value of the standard error of the mean(
) is:A)0.6.
B)0.9.
C)1.6.
D)2.6.
E)3.0.
Question
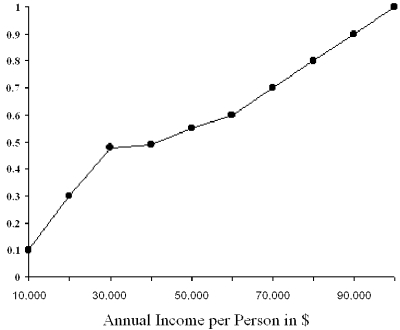
-Refer to Exhibit 12.1. The median income in the above figure is
A) $10,000.
B) $20,000.
C) $30,000.
D) $50,000.
E) $100,000.
Question
Question
Question
-Refer to Exhibit 12.2. What is the modal number of televisions owned by the households in the sample?
A) 2
B) More than 3
C) 1
D) 3
E) Can't be determined from the table.
Question
Question
Question
Use the information below to answer the questions.
A major car manufacturer was interested in whether its midsize car was selling consistently in two markets with respect to the annual income of the car purchasers. 500 new car buyers in Chicago and Miami were surveyed. In Chicago the following pattern was observed:

Among those surveyed in Miami, 20 earned under $20,000; 70 earned between $20,000 and $30,000; 265 earned between $30,000 and $40,000; 125 earned between $40,000 and $50,000; and 20 earned more than $50,000.
-Refer to Exhibit 12.3. The chi-square test was used to check whether Miami sales among income groups were consistent with Chicago's. The appropriate degrees of freedom for the chi-square test would be:
A) 4
B) 5
C) 500
D) 499
E) None of the above.
A major car manufacturer was interested in whether its midsize car was selling consistently in two markets with respect to the annual income of the car purchasers. 500 new car buyers in Chicago and Miami were surveyed. In Chicago the following pattern was observed:
Among those surveyed in Miami, 20 earned under $20,000; 70 earned between $20,000 and $30,000; 265 earned between $30,000 and $40,000; 125 earned between $40,000 and $50,000; and 20 earned more than $50,000.
-Refer to Exhibit 12.3. The chi-square test was used to check whether Miami sales among income groups were consistent with Chicago's. The appropriate degrees of freedom for the chi-square test would be:
A) 4
B) 5
C) 500
D) 499
E) None of the above.
Question
-Refer to Exhibit 12.1. $50,000 represents the ____ in the figure above.
A) median.
B) sixtieth percentile.
C) third quartile.
D) seventieth percentile.
E) None of the above.
Question
Question
Question
Question
Use the information below to answer the questions.
A major car manufacturer was interested in whether its midsize car was selling consistently in two markets with respect to the annual income of the car purchasers. 500 new car buyers in Chicago and Miami were surveyed. In Chicago the following pattern was observed:
Among those surveyed in Miami, 20 earned under $20,000; 70 earned between $20,000 and $30,000; 265 earned between $30,000 and $40,000; 125 earned between $40,000 and $50,000; and 20 earned more than $50,000.
-Refer to Exhibit 12.3. Using the data provided, the calculated value of c² =
A)0.883
B)36.30
C)11.95
D) -0.542
E) Not enough information is provided to calculate the value.
Question
Question
Question
Question
Question
Question
Question
Question
Question
Question
Question
Question
Question
Question
A researcher determines a sample of size (n) 100 is necessary to estimate a population mean with 95% confidence (z = 2). The calculation of sample size required that he estimate the population standard deviation since it was unknown, and he estimated it as 150. The 100 observations produced a sample mean 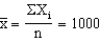 and a sample standard deviation
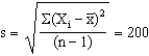
The resulting confidence interval is:
A) 970 < m < 1030.
B) 996 < m < 1004.
C) 997 < m < 1003.
D) 960 < m < 1040.
E) There are two possible confidence intervals.
and a sample standard deviation The resulting confidence interval is:
A) 970 < m < 1030.
B) 996 < m < 1004.
C) 997 < m < 1003.
D) 960 < m < 1040.
E) There are two possible confidence intervals.
Question
Question
Question
Question
Question
Question
Question
Question
Question
Question
Question
Question
Question
Question
Question
Question
Question
Question
Question
Question
Question
Question
Question
Question
Question
Question
Question
Question
Question
Question

Unlock Deck
Sign up to unlock the cards in this deck!
Unlock Deck
Unlock Deck
1/61
Play
Full screen (f)
Deck 12: Analysis & Interpretation: Individual Variables Independently
1
The chi-square test is an approximate test. The approximation is relatively good if the:
A) expected number of cases in each category is 10 or more.
B) expected number of cases in each category is 5 or more.
C) expected number of cases in each category is 3 or more.
D) actual number of cases in each category is 10 or more.
E) actual number of cases in each category is 5 or more.
A) expected number of cases in each category is 10 or more.
B) expected number of cases in each category is 5 or more.
C) expected number of cases in each category is 3 or more.
D) actual number of cases in each category is 10 or more.
E) actual number of cases in each category is 5 or more.
B
2
-Refer to Exhibit 12.2. What is the average number of televisions per household?
A)2.00
B)1.85
C)1.52
D)2.25
E)2.74
1.85
3
Which of the following would NOT be an example of a situation involving univariate analysis?
A) A publisher of a magazine is interested in determining what proportion of the magazine's readers is male.
B) A restaurant would like to know the average income of its typical diner.
C) A car dealership is particularly interested in whether or not people who own vans are more or less likely to finance auto purchases compared with people who don't own vans.
D) A service provider needs to know her customer's average level of satisfaction with the services provided.
E) All of the above are examples for which univariate analysis could be performed.
C
4
-Refer to Exhibit 12.2. What is the sample standard deviation?
A)0.4318
B)0.3246
C)0.6571
D)1.0239
E) Can't be determined from the table.
Unlock Deck
Unlock for access to all 61 flashcards in this deck.
Unlock Deck
k this deck
5
120 field mice are weighed. The average weight of a mouse is 225 grams and the sample standard deviation is 15.1 grams.
-Refer to Exhibit 12.5. The estimated value of the standard error of the mean( ) is:
A)0.6.
B)0.9.
C)1.6.
D)2.6.
E)3.0.
-Refer to Exhibit 12.5. The estimated value of the standard error of the mean(
) is:A)0.6.
B)0.9.
C)1.6.
D)2.6.
E)3.0.
Unlock Deck
Unlock for access to all 61 flashcards in this deck.
Unlock Deck
k this deck
6
-Refer to Exhibit 12.1. The median income in the above figure is
A) $10,000.
B) $20,000.
C) $30,000.
D) $50,000.
E) $100,000.
Unlock Deck
Unlock for access to all 61 flashcards in this deck.
Unlock Deck
k this deck
7
Which types of measurement are used to group respondents or objects into groups or categories and are thus referred to as categorical measures?
A) Nominal and interval
B) Ordinal and ratio
C) Ratio and interval
D) Nominal and ordinal
E) Ordinal and interval
A) Nominal and interval
B) Ordinal and ratio
C) Ratio and interval
D) Nominal and ordinal
E) Ordinal and interval
Unlock Deck
Unlock for access to all 61 flashcards in this deck.
Unlock Deck
k this deck
8
Data analysis hinges on which of the following considerations about the variable(s) to be analyzed?
A) Will the variable be analyzed in isolation or in relationship to one or more other variables?
B) What type of analysis is required by the project sponsor?
C) What level of measurement was used to measure the variable(s)?
D) Both a and C
E) All of the above are considerations about the variable(s) to be analyzed.
Unlock Deck
Unlock for access to all 61 flashcards in this deck.
Unlock Deck
k this deck
9
-Refer to Exhibit 12.2. What is the modal number of televisions owned by the households in the sample?
A) 2
B) More than 3
C) 1
D) 3
E) Can't be determined from the table.
Unlock Deck
Unlock for access to all 61 flashcards in this deck.
Unlock Deck
k this deck
10
A researcher is interested in analyzing a set of nominal data to determine if the observed pattern of frequencies corresponds to the expected pattern. The appropriate statistical technique is:
A) chi-square goodness-of-fit.
B) regression analysis.
C) z-test for comparing sample proportion against a standard.
D) z-test for comparing sample mean against a standard.
E) frequency analysis.
A) chi-square goodness-of-fit.
B) regression analysis.
C) z-test for comparing sample proportion against a standard.
D) z-test for comparing sample mean against a standard.
E) frequency analysis.
Unlock Deck
Unlock for access to all 61 flashcards in this deck.
Unlock Deck
k this deck
11
An observation that is very different in magnitude from the rest of the observations for a particular variable is a(n):
A) error.
B) blunder.
C) histogram.
D) outlier.
E) deviant.
A) error.
B) blunder.
C) histogram.
D) outlier.
E) deviant.
Unlock Deck
Unlock for access to all 61 flashcards in this deck.
Unlock Deck
k this deck
12
Use the information below to answer the questions.
A major car manufacturer was interested in whether its midsize car was selling consistently in two markets with respect to the annual income of the car purchasers. 500 new car buyers in Chicago and Miami were surveyed. In Chicago the following pattern was observed:
Among those surveyed in Miami, 20 earned under $20,000; 70 earned between $20,000 and $30,000; 265 earned between $30,000 and $40,000; 125 earned between $40,000 and $50,000; and 20 earned more than $50,000.
-Refer to Exhibit 12.3. The chi-square test was used to check whether Miami sales among income groups were consistent with Chicago's. The appropriate degrees of freedom for the chi-square test would be:
A) 4
B) 5
C) 500
D) 499
E) None of the above.
Unlock Deck
Unlock for access to all 61 flashcards in this deck.
Unlock Deck
k this deck
13
-Refer to Exhibit 12.1. $50,000 represents the ____ in the figure above.
A) median.
B) sixtieth percentile.
C) third quartile.
D) seventieth percentile.
E) None of the above.
Unlock Deck
Unlock for access to all 61 flashcards in this deck.
Unlock Deck
k this deck
14
A researcher calculates a chi-square test statistic of 8.56. At a = .05 and n = 3, the critical value of the chi-square statistic is 7.81. What is the appropriate statistical conclusion?
A) Reject the null hypothesis.
B) Can't determine; not enough information given.
C) Fail to reject the null hypothesis.
D) Reject the alternative hypothesis.
E) Conclude that the null hypothesis is true.
A) Reject the null hypothesis.
B) Can't determine; not enough information given.
C) Fail to reject the null hypothesis.
D) Reject the alternative hypothesis.
E) Conclude that the null hypothesis is true.
Unlock Deck
Unlock for access to all 61 flashcards in this deck.
Unlock Deck
k this deck
15
A researcher had calculated the sample chi-square test statistic to be equal to c² = 7.71. For an alpha level of 0.10 and 4 degrees of freedom, the critical value of the chi-square statistic is 7.78. The appropriate conclusion is that the
A) sample result is likely to be attributed to chance alone.
B) null hypothesis should not be rejected.
C) null hypothesis should be rejected.
D) Both a and b
E) alternative hypothesis is true.
A) sample result is likely to be attributed to chance alone.
B) null hypothesis should not be rejected.
C) null hypothesis should be rejected.
D) Both a and b
E) alternative hypothesis is true.
Unlock Deck
Unlock for access to all 61 flashcards in this deck.
Unlock Deck
k this deck
16
A clothing manufacturer traditionally makes sweatshirts from three different fabrics, A, B and C. Over the years the percentages sold of each fabric are 50, 35, and 15, respectively. Recently, the manufacturer began producing running suits from the same three fabrics. During the first three months of production, the company received orders for 6,500 suits made from fabric A, 3,400 from fabric B, and 2,700 from fabric C.
-Refer to Exhibit 12.4. What is the value of the test statistic useful for determining how well the pattern of sales (by fabric type) of the new running suit corresponds to the expected pattern?
A)136.21
B)584.81
C)0.973
D)422.13
E) None of the above.
-Refer to Exhibit 12.4. What is the value of the test statistic useful for determining how well the pattern of sales (by fabric type) of the new running suit corresponds to the expected pattern?
A)136.21
B)584.81
C)0.973
D)422.13
E) None of the above.
Unlock Deck
Unlock for access to all 61 flashcards in this deck.
Unlock Deck
k this deck
17
Use the information below to answer the questions.
A major car manufacturer was interested in whether its midsize car was selling consistently in two markets with respect to the annual income of the car purchasers. 500 new car buyers in Chicago and Miami were surveyed. In Chicago the following pattern was observed:
Among those surveyed in Miami, 20 earned under $20,000; 70 earned between $20,000 and $30,000; 265 earned between $30,000 and $40,000; 125 earned between $40,000 and $50,000; and 20 earned more than $50,000.
-Refer to Exhibit 12.3. Using the data provided, the calculated value of c² =
A)0.883
B)36.30
C)11.95
D) -0.542
E) Not enough information is provided to calculate the value.
Unlock Deck
Unlock for access to all 61 flashcards in this deck.
Unlock Deck
k this deck
18
An observation that is very different in magnitude from the rest of the observations for a particular variable is a(n):
A) error.
B) blunder.
C) histogram.
D) outlier.
E) deviant.
A) error.
B) blunder.
C) histogram.
D) outlier.
E) deviant.
Unlock Deck
Unlock for access to all 61 flashcards in this deck.
Unlock Deck
k this deck
19
A clothing manufacturer traditionally makes sweatshirts from three different fabrics, A, B and C. Over the years the percentages sold of each fabric are 50, 35, and 15, respectively. Recently, the manufacturer began producing running suits from the same three fabrics. During the first three months of production, the company received orders for 6,500 suits made from fabric A, 3,400 from fabric B, and 2,700 from fabric C.
-Refer to Exhibit 12.4. What would be the expected number of running suits made of fabric B sold during the first three months based on past years' sales results of sweatshirts?
A) 3,500
B) 1,190
C) 4,410
D) 4,500
E) None of the above
-Refer to Exhibit 12.4. What would be the expected number of running suits made of fabric B sold during the first three months based on past years' sales results of sweatshirts?
A) 3,500
B) 1,190
C) 4,410
D) 4,500
E) None of the above
Unlock Deck
Unlock for access to all 61 flashcards in this deck.
Unlock Deck
k this deck
20
Which statement(s) pertaining to the chi-square distribution is FALSE?
A) The chi-square distribution is completely determined by its degrees of freedom.
B) The variable of interest is broken into k mutually exclusive categories.
C) The expected number falling into a category is generated from the null hypothesis.
D) Chi-square degrees of freedom is given by k - 2.
E) The chi-square is appropriate for independent trials.
Unlock Deck
Unlock for access to all 61 flashcards in this deck.
Unlock Deck
k this deck
21
For which of the following types of measures does the mean NOT provide a meaningful value?
A) Ratio
B) Equal-interval scales
C) Interval
D) Ordinal
E) Continuous measures
A) Ratio
B) Equal-interval scales
C) Interval
D) Ordinal
E) Continuous measures
Unlock Deck
Unlock for access to all 61 flashcards in this deck.
Unlock Deck
k this deck
22
Which of the following is FALSE about the use of percentages when reporting results?
A) Unless decimals have a special purpose, they should be omitted.
B) Percentages should be rounded to whole numbers.
C) Decimals may convey greater accuracy than the figures can support.
D) It is unnecessary and redundant to include percentages along with the raw count for frequency analyses.
E) All of the above are true concerning the use of percentages when reporting results.
Unlock Deck
Unlock for access to all 61 flashcards in this deck.
Unlock Deck
k this deck
23
Which of the following statements concerning the sample standard deviation is FALSE?
A) Sample standard deviation is a measure of the variation in responses.
B) Analysts reporting descriptive statistics for continuous measures should always report standard deviations along with mean values.
C) Standard deviation is meaningful and appropriate only for interval- and nominal-level measures.
D) An analyst must be aware of the concerns of spurious precision when reporting standard deviations.
E) Outliers can have a marked effect on the calculation of a standard deviation.
Unlock Deck
Unlock for access to all 61 flashcards in this deck.
Unlock Deck
k this deck
24
Suppose that a random sample of 550 new car owners found that 38 percent of them were aware of a particular brand of tires that your company sells. If you are willing to accept less than a 5 percent chance of error that the true awareness rate of your company's brand of tire across all new car owners is less than 0.45, which statistical technique should you use from this data?
A) Test for a single proportion
B) Test of two means when samples are independent.
C) Test for a single mean.
D) Test of two means when samples are dependent.
E) ANOVA
A) Test for a single proportion
B) Test of two means when samples are independent.
C) Test for a single mean.
D) Test of two means when samples are dependent.
E) ANOVA
Unlock Deck
Unlock for access to all 61 flashcards in this deck.
Unlock Deck
k this deck
25
A research study that tests the hypothesis, "The population mean household income in the new market area is greater than $29,000," will involve a:
A) test of two means.
B) test for a single mean.
C) test for a single proportion.
D) test of two proportions.
E) test of a single variance.
A) test of two means.
B) test for a single mean.
C) test for a single proportion.
D) test of two proportions.
E) test of a single variance.
Unlock Deck
Unlock for access to all 61 flashcards in this deck.
Unlock Deck
k this deck
26
120 field mice are weighed. The average weight of a mouse is 225 grams and the sample standard deviation is 15.1 grams.
-Refer to Exhibit 12.6. What is the value of the test statistic for the hypothesis that the actual mean weight of the mouse population is greater than 235 grams?
A) -0.578
B) -2.79
C) -0.633
D) -6.33
E) -7.25
-Refer to Exhibit 12.6. What is the value of the test statistic for the hypothesis that the actual mean weight of the mouse population is greater than 235 grams?
A) -0.578
B) -2.79
C) -0.633
D) -6.33
E) -7.25
Unlock Deck
Unlock for access to all 61 flashcards in this deck.
Unlock Deck
k this deck
27
The FactFinder Research firm conducted a survey for a national food manufacturer and one of the issues addressed by the research was to determine how many pounds of fish were annually consumed per capita. In the survey they found one person who consumed only one pound of fish per year while 10 people reported 200 pounds per year. The range was:
A)200.
B) 1 to 2,000.
C)201
D)199.
E) None of the above.
A)200.
B) 1 to 2,000.
C)201
D)199.
E) None of the above.
Unlock Deck
Unlock for access to all 61 flashcards in this deck.
Unlock Deck
k this deck
28
120 field mice are weighed. The average weight of a mouse is 225 grams and the sample standard deviation is 15.1 grams.
-Refer to Exhibit 12.5. The estimated value of the test statistic is:
A)4.0
B)5.2
C)6.7
D)7.2
E)9.0
-Refer to Exhibit 12.5. The estimated value of the test statistic is:
A)4.0
B)5.2
C)6.7
D)7.2
E)9.0
Unlock Deck
Unlock for access to all 61 flashcards in this deck.
Unlock Deck
k this deck
29
Which of the following would be an appropriate interpretation of a p-value?
A) A p-value of p < 0.0001 is 'highly significant' and therefore much more valid than a p value of 0.05.
B) When a null hypothesis is rejected at some predetermined p level, sampling error is an unlikely explanation of the results, given that the null hypothesis is true.
C) When a p-value shows significance, managerial and practical significance can be assumed.
D) The probability that the research hypothesis is true is equal to 1 minus the p-value.
E) A p-value represents the probability that the results occurred because of sampling error.
Unlock Deck
Unlock for access to all 61 flashcards in this deck.
Unlock Deck
k this deck
30
To calculate sampling error for a proportion, which of the following pieces of information is NOT needed?
A) The z-score representing the desired degree of confidence.
B) The number of valid cases overall for the proportion.
C) The sample standard deviation.
D) The relevant proportion obtained from the sample.
E) All of the above are relevant and necessary pieces of information for the calculation of sampling error for a proportion.
Unlock Deck
Unlock for access to all 61 flashcards in this deck.
Unlock Deck
k this deck
31
A researcher determines a sample of size (n) 100 is necessary to estimate a population mean with 95% confidence (z = 2). The calculation of sample size required that he estimate the population standard deviation since it was unknown, and he estimated it as 150. The 100 observations produced a sample mean and a sample standard deviation
The resulting confidence interval is:
A) 970 < m < 1030.
B) 996 < m < 1004.
C) 997 < m < 1003.
D) 960 < m < 1040.
E) There are two possible confidence intervals.
and a sample standard deviation The resulting confidence interval is:
A) 970 < m < 1030.
B) 996 < m < 1004.
C) 997 < m < 1003.
D) 960 < m < 1040.
E) There are two possible confidence intervals.
Unlock Deck
Unlock for access to all 61 flashcards in this deck.
Unlock Deck
k this deck
32
Which of the following is true regarding the standard deviation?
A) It indicates the degree of variation in the values in such a way as to be translatable into a normal curve.
B) One standard deviation above and below the midpoint in a normal distribution includes approximately 68% of the area underneath the curve.
C) + or - 1.96 standard deviations above and below the midpoint in a normal distribution includes 95% of the area underneath the curve.
D) The standard deviation can be approximated by dividing the range of the data by 6.
E) All of the above are correct.
Unlock Deck
Unlock for access to all 61 flashcards in this deck.
Unlock Deck
k this deck
33
120 field mice are weighed. The average weight of a mouse is 225 grams and the sample standard deviation is 15.1 grams.
-Refer to Exhibit 12.6. The conclusion is:
A) The mean weight of a field mouse is greater than 235 grams.
B) The mean weight of a field mouse is less than 235 grams.
C) Estimate a point mean of 235 grams.
D) The mean weight of a field mouse is less than 225 grams.
E) None of the above are correct.
-Refer to Exhibit 12.6. The conclusion is:
A) The mean weight of a field mouse is greater than 235 grams.
B) The mean weight of a field mouse is less than 235 grams.
C) Estimate a point mean of 235 grams.
D) The mean weight of a field mouse is less than 225 grams.
E) None of the above are correct.
Unlock Deck
Unlock for access to all 61 flashcards in this deck.
Unlock Deck
k this deck
34
Because ____ and ____ measures are similar when it comes to analysis, many researchers refer to both types as continuous measures.
A) interval, ratio
B) nominal, interval
C) ordinal, ratio
D) nominal, ordinal
E) ratio, nominal
A) interval, ratio
B) nominal, interval
C) ordinal, ratio
D) nominal, ordinal
E) ratio, nominal
Unlock Deck
Unlock for access to all 61 flashcards in this deck.
Unlock Deck
k this deck
35
Which of the following statements if FALSE concerning the conversion of continuous measures to categorical measures?
A) When converting, there is no loss of information about a variable.
B) Because higher levels of measurement have all the properties of measures lower in the hierarchy, conversion is perfectly acceptable.
C) In many cases, conversion is advisable for aiding in interpretation of research study results.
D) Analyses should be performed using the highest level of measurement possible for a particular variable.
E) A simple solution would be to provide both types of results.
Unlock Deck
Unlock for access to all 61 flashcards in this deck.
Unlock Deck
k this deck
36
A sample mean is compared against a standard for a large sample. Now, assume the sample mean was found to equal 40. What is the appropriate confidence interval? (Note: Round to the nearest whole number.)
A) 23 < m < 57
B) Can't be determined from the information given.
C) 14 < m < 66
D) 38 < m < 42
E) 20 < m < 60
A) 23 < m < 57
B) Can't be determined from the information given.
C) 14 < m < 66
D) 38 < m < 42
E) 20 < m < 60
Unlock Deck
Unlock for access to all 61 flashcards in this deck.
Unlock Deck
k this deck
37
120 field mice are weighed. The average weight of a mouse is 225 grams and the sample standard deviation is 15.1 grams.
-Refer to Exhibit 12.6. What is the estimated standard error of the mean?
A)0.173 grams
B)1.15 grams
C)1.38 grams
D)15.8 grams
E)17.3 grams
-Refer to Exhibit 12.6. What is the estimated standard error of the mean?
A)0.173 grams
B)1.15 grams
C)1.38 grams
D)15.8 grams
E)17.3 grams
Unlock Deck
Unlock for access to all 61 flashcards in this deck.
Unlock Deck
k this deck
38
120 field mice are weighed. The average weight of a mouse is 225 grams and the sample standard deviation is 15.1 grams.
-Refer to Exhibit 12.6. What is the 95% confidence interval for the average weight of a field mouse? (z = 1.96)
A) 222 to 228 grams
B) 217 to 223 grams
C) 221 to 229 grams
D) 240 to 245 grams
E) None of the above are correct.
-Refer to Exhibit 12.6. What is the 95% confidence interval for the average weight of a field mouse? (z = 1.96)
A) 222 to 228 grams
B) 217 to 223 grams
C) 221 to 229 grams
D) 240 to 245 grams
E) None of the above are correct.
Unlock Deck
Unlock for access to all 61 flashcards in this deck.
Unlock Deck
k this deck
39
120 field mice are weighed. The average weight of a mouse is 225 grams and the sample standard deviation is 15.1 grams.
-Refer to Exhibit 12.5. The degrees of freedom would equal:
A)14.
B)24.
C)219.
D)199.
E) Cannot tell from the given information.
-Refer to Exhibit 12.5. The degrees of freedom would equal:
A)14.
B)24.
C)219.
D)199.
E) Cannot tell from the given information.
Unlock Deck
Unlock for access to all 61 flashcards in this deck.
Unlock Deck
k this deck
40
Which of the following is TRUE about hypothesis testing?
A) The typical goal is to reject the alternative hypothesis in favor of the null hypothesis.
B) A hypothesis may be rejected but can never be accepted completely.
C) Marketing research studies attempt to prove results.
D) The null hypothesis is assumed to be false for the purpose of the test.
E) All of the above are true about hypothesis testing.
Unlock Deck
Unlock for access to all 61 flashcards in this deck.
Unlock Deck
k this deck
41
The use of the t-statistic in a hypothesis test with two means requires the assumption that it involves two independent samples.
Unlock Deck
Unlock for access to all 61 flashcards in this deck.
Unlock Deck
k this deck
42
The hypothesis that a proposed result is not true for the population is called the ____________________ hypothesis.
Unlock Deck
Unlock for access to all 61 flashcards in this deck.
Unlock Deck
k this deck
43
If the standard deviation of household income for a sample of 625 households is $8,000, what is the standard error of the mean?
A) $320
B) $625
C) $8,000
D) $80
E) $25
A) $320
B) $625
C) $8,000
D) $80
E) $25
Unlock Deck
Unlock for access to all 61 flashcards in this deck.
Unlock Deck
k this deck
44
The arithmetic mean value across all responses for a variable is called the ____________________ mean.
Unlock Deck
Unlock for access to all 61 flashcards in this deck.
Unlock Deck
k this deck
45
A sampling procedure is statistically more efficient than another procedure if, for a given sample size, it results in a larger sampling error.
Unlock Deck
Unlock for access to all 61 flashcards in this deck.
Unlock Deck
k this deck
46
An outlier is an observation so different from the rest of the observations that the analyst chooses to treat it as a special case.
Unlock Deck
Unlock for access to all 61 flashcards in this deck.
Unlock Deck
k this deck
47
An observation so different in magnitude from the rest of the observations that the analyst chooses to treat it as a special case is called a(n) ____________________.
Unlock Deck
Unlock for access to all 61 flashcards in this deck.
Unlock Deck
k this deck
48
Both nominal and ordinal measures are easily used to group respondents or objects into groups or categories.
Unlock Deck
Unlock for access to all 61 flashcards in this deck.
Unlock Deck
k this deck
49
The ____________________ is a statistical test to determine whether some observed pattern of frequencies corresponds to and expected pattern.
Unlock Deck
Unlock for access to all 61 flashcards in this deck.
Unlock Deck
k this deck
50
The more confidence we want to have in the interval estimate, the larger the sample size should be.
Unlock Deck
Unlock for access to all 61 flashcards in this deck.
Unlock Deck
k this deck
51
The logic of hypothesis testing is that if we assume that the hypothesized value is the population parameter, then, at the 95% level of confidence, if we took 100 separate samples, the z-value for 95 of those samples would fall between + or - 1.96.
Unlock Deck
Unlock for access to all 61 flashcards in this deck.
Unlock Deck
k this deck
52
In using percentages for reporting results it is reasonable to report percentages to two decimal places.
Unlock Deck
Unlock for access to all 61 flashcards in this deck.
Unlock Deck
k this deck
53
A statistical test to determine whether some observed pattern of frequencies corresponds to an expected pattern is called a chi-square goodness-of-fit test.
Unlock Deck
Unlock for access to all 61 flashcards in this deck.
Unlock Deck
k this deck
54
A(n) ____________________ interval is a projection of the range within which a population parameter will lie at a given level of confidence based on a statistic obtained from an appropriately drawn sample.
Unlock Deck
Unlock for access to all 61 flashcards in this deck.
Unlock Deck
k this deck
55
In estimating the standard deviation in the population for the formula for calculating the sample size for estimating a mean, we can use some prior knowledge about the:
A) sample to estimate our standard deviation.
B) population, undertake a pilot study or estimate the range, and divide by 10.
C) population, undertake a pilot study or estimate the range, and divide by 6.
D) Either of the two; b or c would work.
E) None of the above; if you do not have the actual standard deviation, you cannot use the formula.
Unlock Deck
Unlock for access to all 61 flashcards in this deck.
Unlock Deck
k this deck
56
Which type of statistical analysis would we use to determine if female college graduates' starting salary was different from their male counterpart (assuming data is collected using the following question on the survey "What is your starting salary?"
A) Test of two means.
B) Test for a single mean.
C) Test for a single proportion.
D) Test of two proportions.
E) Test of a single variance
A) Test of two means.
B) Test for a single mean.
C) Test for a single proportion.
D) Test of two proportions.
E) Test of a single variance
Unlock Deck
Unlock for access to all 61 flashcards in this deck.
Unlock Deck
k this deck
57
In the following data set, what is the median? 12, 0, 0, 1, 1, 1, 6, 10, 11.
A)4.66
B) 1
C) 42
D) 6
E) 0
A)4.66
B) 1
C) 42
D) 6
E) 0
Unlock Deck
Unlock for access to all 61 flashcards in this deck.
Unlock Deck
k this deck
58
A histogram is a form of bar chart that is based on information from a frequency count.
Unlock Deck
Unlock for access to all 61 flashcards in this deck.
Unlock Deck
k this deck
59
You can "prove" that the alternative hypothesis is true if the null hypothesis is rejected.
Unlock Deck
Unlock for access to all 61 flashcards in this deck.
Unlock Deck
k this deck
60
Kit Kat candy bar executives make the following statement: "Our most likely estimate of Kit Kat's ad recall rate is 65%. In addition, we are 95% confident that Kit Kat's ad recall rate in the population falls between 62% and 68%." This illustrates an example of:
A) basic descriptive statistics.
B) using statistical inference to estimate a population parameter based upon sample statistics.
C) using statistical inference to estimate a statistic based upon a population parameter.
D) hypothesis testing.
E) Both a and b
A) basic descriptive statistics.
B) using statistical inference to estimate a population parameter based upon sample statistics.
C) using statistical inference to estimate a statistic based upon a population parameter.
D) hypothesis testing.
E) Both a and b
Unlock Deck
Unlock for access to all 61 flashcards in this deck.
Unlock Deck
k this deck
61
Discuss the most commonly used descriptive statistics.
Unlock Deck
Unlock for access to all 61 flashcards in this deck.
Unlock Deck
k this deck
Unlock Deck
Unlock for access to all 61 flashcards in this deck.


