Exam 12: Analysis & Interpretation: Individual Variables Independently
Exam 1: Marketing Research: From Data to Information to Action29 Questions
Exam 2: The Research Question: Formulation of the Problem25 Questions
Exam 3: Exploratory, Descriptive, and Causal Research Designs84 Questions
Exam 4: Collecting Secondary Data from Inside and Outside the Organization43 Questions
Exam 5: Collecting Primary Data by Observation62 Questions
Exam 6: Collecting Primary Data by Communication40 Questions
Exam 7: Asking Good Questions75 Questions
Exam 8: Designing the Questionnaire79 Questions
Exam 9: Developing the Sampling Plan85 Questions
Exam 10: Data Collection: Enhancing Response Rates while Limiting Errors76 Questions
Exam 11: Data Preparation for Analysis35 Questions
Exam 12: Analysis & Interpretation: Individual Variables Independently61 Questions
Exam 13: Analysis & Interpretation: Multiple Variables Simultaneously64 Questions
Exam 14: The Research Report52 Questions
Select questions type
A sample mean is compared against a standard for a large sample. Now, assume the sample mean was found to equal 40. What is the appropriate confidence interval? (Note: Round to the nearest whole number.)
Free
(Multiple Choice)
4.8/5  (30)
(30)
Correct Answer: Verified
A
120 field mice are weighed. The average weight of a mouse is 225 grams and the sample standard deviation is 15.1 grams.
-Refer to Exhibit 12.5. The estimated value of the standard error of the mean(  ) is:
) is:
Free
(Multiple Choice)
4.8/5 (39)
Correct Answer:Verified
E
A clothing manufacturer traditionally makes sweatshirts from three different fabrics, A, B and C. Over the years the percentages sold of each fabric are 50, 35, and 15, respectively. Recently, the manufacturer began producing running suits from the same three fabrics. During the first three months of production, the company received orders for 6,500 suits made from fabric A, 3,400 from fabric B, and 2,700 from fabric C.
-Refer to Exhibit 12.4. What would be the expected number of running suits made of fabric B sold during the first three months based on past years' sales results of sweatshirts?
Free
(Multiple Choice)
4.8/5 (34)
Correct Answer:Verified
C
Kit Kat candy bar executives make the following statement: "Our most likely estimate of Kit Kat's ad recall rate is 65%. In addition, we are 95% confident that Kit Kat's ad recall rate in the population falls between 62% and 68%." This illustrates an example of:
(Multiple Choice)
4.9/5 (44)
The arithmetic mean value across all responses for a variable is called the ____________________ mean.
(Short Answer)
4.9/5 (37)
An outlier is an observation so different from the rest of the observations that the analyst chooses to treat it as a special case.
(True/False)
4.9/5 (35)
 -Refer to Exhibit 12.2. What is the modal number of televisions owned by the households in the sample?
(Multiple Choice)
4.7/5 (33)
A(n) ____________________ interval is a projection of the range within which a population parameter will lie at a given level of confidence based on a statistic obtained from an appropriately drawn sample.
(Short Answer)
4.9/5 (25)
Which of the following is true regarding the standard deviation?
(Multiple Choice)
4.9/5 (39)
Which of the following statements if FALSE concerning the conversion of continuous measures to categorical measures?
(Multiple Choice)
4.9/5 (36)
Use the information below to answer the questions.
A major car manufacturer was interested in whether its midsize car was selling consistently in two markets with respect to the annual income of the car purchasers. 500 new car buyers in Chicago and Miami were surveyed. In Chicago the following pattern was observed:
 Among those surveyed in Miami, 20 earned under $20,000; 70 earned between $20,000 and $30,000; 265 earned between $30,000 and $40,000; 125 earned between $40,000 and $50,000; and 20 earned more than $50,000.
-Refer to Exhibit 12.3. Using the data provided, the calculated value of c² =
Among those surveyed in Miami, 20 earned under $20,000; 70 earned between $20,000 and $30,000; 265 earned between $30,000 and $40,000; 125 earned between $40,000 and $50,000; and 20 earned more than $50,000.
-Refer to Exhibit 12.3. Using the data provided, the calculated value of c² =
(Multiple Choice)
4.9/5 (44)
Data analysis hinges on which of the following considerations about the variable(s) to be analyzed?
(Multiple Choice)
4.8/5 (31)
A researcher determines a sample of size (n) 100 is necessary to estimate a population mean with 95% confidence (z = 2). The calculation of sample size required that he estimate the population standard deviation since it was unknown, and he estimated it as 150. The 100 observations produced a sample mean 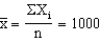 and a sample standard deviation
 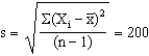 The resulting confidence interval is:
(Multiple Choice)
4.8/5 (33)
The chi-square test is an approximate test. The approximation is relatively good if the:
(Multiple Choice)
4.9/5 (31)
An observation that is very different in magnitude from the rest of the observations for a particular variable is a(n):
(Multiple Choice)
4.8/5 (27)
In the following data set, what is the median? 12, 0, 0, 1, 1, 1, 6, 10, 11.
(Multiple Choice)
5.0/5 (34)
Because ____ and ____ measures are similar when it comes to analysis, many researchers refer to both types as continuous measures.
(Multiple Choice)
4.9/5 (37)
120 field mice are weighed. The average weight of a mouse is 225 grams and the sample standard deviation is 15.1 grams.
-Refer to Exhibit 12.5. The estimated value of the test statistic is:
(Multiple Choice)
4.8/5 (37)
120 field mice are weighed. The average weight of a mouse is 225 grams and the sample standard deviation is 15.1 grams.
-Refer to Exhibit 12.6. What is the 95% confidence interval for the average weight of a field mouse? (z = 1.96)
(Multiple Choice)
4.7/5 (31)
Filters
- Essay(0)
- Multiple Choice(0)
- Short Answer(0)
- True False(0)
- Matching(0)