Deck 7: Forecasting
Full screen (f)
Question
Question
Question
Use the data given below to answer the following question(s).
The sales details for 6 weeks of a particular type of switches,called the "Twitch," are shown in the table below.The value of k is set at 2.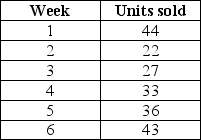
For the given data,the value of the root mean square error is ________.
A)9.25
B)7.36
C)54.13
D)21.10
The sales details for 6 weeks of a particular type of switches,called the "Twitch," are shown in the table below.The value of k is set at 2.
For the given data,the value of the root mean square error is ________.
A)9.25
B)7.36
C)54.13
D)21.10
Question
Use the data given below to answer the following question(s).
The sales details for 6 weeks of a particular type of switches,called the "Twitch," are shown in the table below.The value of k is set at 2.
Using the given data,calculate the value of the mean absolute deviation.
A)7.25
B)54.13
C)9.36
D)21.10
The sales details for 6 weeks of a particular type of switches,called the "Twitch," are shown in the table below.The value of k is set at 2.
Using the given data,calculate the value of the mean absolute deviation.
A)7.25
B)54.13
C)9.36
D)21.10
Question
Use the data given below to answer the following question(s).
The sales details for 6 weeks of a particular type of switches,called the "Twitch," are shown in the table below.The value of k is set at 2.
For the given data,identify the value of the mean absolute percentage error.
A)9.25
B)7.36
C)54.13
D)21.10
The sales details for 6 weeks of a particular type of switches,called the "Twitch," are shown in the table below.The value of k is set at 2.
For the given data,identify the value of the mean absolute percentage error.
A)9.25
B)7.36
C)54.13
D)21.10
Question
Question
Question
Given: At = the actual value of the time series at time t,Ft = the forecast value for time t,and n = the number of forecast values.Identify the formula used to calculate the mean absolute percentage error.
A)MAPE = × 100
× 100
B)MAPE = × × 100
× 100
C)MAPE = × 100
× 100
D)MAPE = × 100
× 100
A)MAPE =
× 100B)MAPE = ×
× 100C)MAPE =
× 100D)MAPE =
× 100 Question
Question
If At is the actual value of the time series at time t,Ft is the forecast value for time t,and n is the number of forecast values,the formula used to calculate the root mean square of errors is ________.
A)RMSE =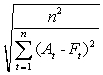
B)RMSE =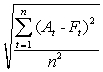
C)RMSE =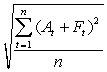
D)RMSE =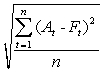
A)RMSE =
B)RMSE =
C)RMSE =
D)RMSE =
Question
Use the data given below to answer the following question(s).
The sales details for 6 weeks of a particular type of switches,called the "Twitch," are shown in the table below.The value of k is set at 2.
Using the given data,determine the value of the mean square error.
A)7.25
B)9.36
C)54.13
D)21.10
The sales details for 6 weeks of a particular type of switches,called the "Twitch," are shown in the table below.The value of k is set at 2.
Using the given data,determine the value of the mean square error.
A)7.25
B)9.36
C)54.13
D)21.10
Question
Use the data given below to answer the following question(s).
The sales details for 6 weeks of a particular type of switches,called the "Twitch," are shown in the table below.The value of k is set at 2.
For the given data,identify the number of forecast values.
A)2
B)3
C)4
D)5
The sales details for 6 weeks of a particular type of switches,called the "Twitch," are shown in the table below.The value of k is set at 2.
For the given data,identify the number of forecast values.
A)2
B)3
C)4
D)5
Question
Question
Given: At = the actual value of the time series at time t,Ft = the forecast value for time t,and n = the number of forecast values.Identify the formula used to calculate the mean absolute deviation.
A)MAD =
B)MAD =
C)MAD =
D)MAD =
A)MAD =
B)MAD =
C)MAD =
D)MAD =
Question
Question
Question
Use the data given below to answer the following question(s).
The sales details for 6 weeks of a particular type of switches,called the "Twitch," are shown in the table below.The value of k is set at 2.
For the data given above,the forecast for week 5 is ________.
A)33 units
B)25 units
C)30 units
D)35 units
The sales details for 6 weeks of a particular type of switches,called the "Twitch," are shown in the table below.The value of k is set at 2.
For the data given above,the forecast for week 5 is ________.
A)33 units
B)25 units
C)30 units
D)35 units
Question
Question
If At is the actual value of the time series at time t,Ft is the forecast value for time t,and n is the number of forecast values,the formula used to calculate the mean square of errors is ________.
A)MSE =
B)MSE =
C)MSE =
D)MSE =
A)MSE =
B)MSE =
C)MSE =
D)MSE =
Question
Question
Use the data given below to answer the following question(s).
The table below shows the car sales from the year 2002-2007.The forecaster assumes a smoothing constant of 0.8 and uses the exponential smoothing model to determine the forecast for the future.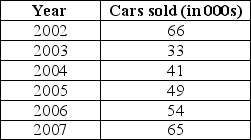
From the data given above,the sales forecast for the year 2008 (in 000s)is ________.
A)40.72 units
B)47.34 units
C)52.67 units
D)62.53 units
Question
Use the data given below to answer the following question(s).
The sales details of a particular game are shown below.The value of k is set at 3.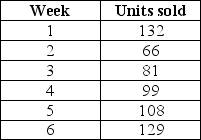
For the given data,what is the value of the root mean square error?
A)600.33
B)24.50
C)21.67
D)18.57
The sales details of a particular game are shown below.The value of k is set at 3.
For the given data,what is the value of the root mean square error?
A)600.33
B)24.50
C)21.67
D)18.57
Question
Use the data given below to answer the following question(s).
The table below shows the sales of a gaming console for the first 6 months of the year 2011.
The forecaster uses the weighted average model to determine the forecasts.He assumes a 40% weight for the most recent reading,30% weight for the second most recent reading,20% for the third most recent reading,and 10% for the fourth most recent reading.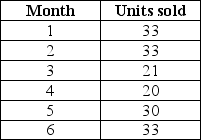
Using the given data,determine the value of the root mean square error.
A)9.15
B)26.95
C)0.87
D)6.70
Question
Use the data given below to answer the following question(s).
The table below shows the sales of a gaming console for the first 6 months of the year 2011.
The forecaster uses the weighted average model to determine the forecasts.He assumes a 40% weight for the most recent reading,30% weight for the second most recent reading,20% for the third most recent reading,and 10% for the fourth most recent reading.
Using the given data,calculate the value of the mean absolute deviation.
A)26.95
B)9.19
C)6.65
D)0.87
Question
Use the data given below to answer the following question(s).
The table below shows the car sales from the year 2002-2007.The forecaster assumes a smoothing constant of 0.8 and uses the exponential smoothing model to determine the forecast for the future.
From the data given above,what is the forecast-in 000s-for the year 2003?
A)41 units
B)33 units
C)66 units
D)49 units
Question
Use the data given below to answer the following question(s).
The table below shows the car sales from the year 2002-2007.The forecaster assumes a smoothing constant of 0.8 and uses the exponential smoothing model to determine the forecast for the future.
From the data given above,the forecast for the year 2005 (in 000s)is ________.
A)39.60 units
B)40.72 units
C)47.34 units
D)52.67 units
Question
Use the data given below to answer the following question(s).
The table below shows the car sales from the year 2002-2007.The forecaster assumes a smoothing constant of 0.8 and uses the exponential smoothing model to determine the forecast for the future.
From the data given above,determine the number of forecast values.
A)3
B)4
C)5
D)6
The table below shows the car sales from the year 2002-2007.The forecaster assumes a smoothing constant of 0.8 and uses the exponential smoothing model to determine the forecast for the future.
From the data given above,determine the number of forecast values.
A)3
B)4
C)5
D)6
Question
Use the data given below to answer the following question(s).
The sales details of a particular game are shown below.The value of k is set at 3.
For the data given above,the forecast for week 7 is ________.
A)112 units
B)211 units
C)121 units
D)82 units
The sales details of a particular game are shown below.The value of k is set at 3.
For the data given above,the forecast for week 7 is ________.
A)112 units
B)211 units
C)121 units
D)82 units
Question
Use the data given below to answer the following question(s).
The table below shows the sales of a gaming console for the first 6 months of the year 2011.
The forecaster uses the weighted average model to determine the forecasts.He assumes a 40% weight for the most recent reading,30% weight for the second most recent reading,20% for the third most recent reading,and 10% for the fourth most recent reading.
Using the given data,calculate the value of the mean square error.
A)5.15
B)44.95
C)9.19
D)0.87
Question
Use the data given below to answer the following question(s).
The table below shows the car sales from the year 2002-2007.The forecaster assumes a smoothing constant of 0.8 and uses the exponential smoothing model to determine the forecast for the future.
From the data given above,what is the forecast-in 000s-for the year 2004?
A)39.60 units
B)40.72 units
C)47.34 units
D)52.67 units
Question
Use the data given below to answer the following question(s).
The sales details of a particular game are shown below.The value of k is set at 3.
For the given data,identify the number of forecast values.
A)2
B)3
C)4
D)5
The sales details of a particular game are shown below.The value of k is set at 3.
For the given data,identify the number of forecast values.
A)2
B)3
C)4
D)5
Question
Use the data given below to answer the following question(s).
The table below shows the sales of a gaming console for the first 6 months of the year 2011.
The forecaster uses the weighted average model to determine the forecasts.He assumes a 40% weight for the most recent reading,30% weight for the second most recent reading,20% for the third most recent reading,and 10% for the fourth most recent reading.
The value of α in the simple exponential smoothing model Ft + 1 = (1 - α)Ft + αAt lies between ________.
A)1 and 2
B)-1 and 0
C)0 and 1
D)-1 and 1
Question
Use the data given below to answer the following question(s).
The sales details of a particular game are shown below.The value of k is set at 3.
Using the given data,calculate the value of the mean absolute deviation.
A)600.33
B)24.50
C)21.67
D)18.57
The sales details of a particular game are shown below.The value of k is set at 3.
Using the given data,calculate the value of the mean absolute deviation.
A)600.33
B)24.50
C)21.67
D)18.57
Question
Use the data given below to answer the following question(s).
The table below shows the sales of a gaming console for the first 6 months of the year 2011.
The forecaster uses the weighted average model to determine the forecasts.He assumes a 40% weight for the most recent reading,30% weight for the second most recent reading,20% for the third most recent reading,and 10% for the fourth most recent reading.
In the simple exponential smoothing model Ft + 1 = (1 - α)Ft + αAt,the exponential smoothing constant is ________.
A)Ft+1
B)α
C)At
D)Ft
Question
Use the data given below to answer the following question(s).
The sales details of a particular game are shown below.The value of k is set at 3.
For the given data,the value of the mean absolute percentage error is ________.
A)600.33
B)24.50
C)18.57
D)21.67
The sales details of a particular game are shown below.The value of k is set at 3.
For the given data,the value of the mean absolute percentage error is ________.
A)600.33
B)24.50
C)18.57
D)21.67
Question
Use the data given below to answer the following question(s).
The table below shows the sales of a gaming console for the first 6 months of the year 2011.
The forecaster uses the weighted average model to determine the forecasts.He assumes a 40% weight for the most recent reading,30% weight for the second most recent reading,20% for the third most recent reading,and 10% for the fourth most recent reading.
From the given data,determine the forecast for the 5th month.
A)35.80 units
B)58.80 units
C)42.20 units
D)24.20 units
Question
Use the data given below to answer the following question(s).
The sales details of a particular game are shown below.The value of k is set at 3.
For the given data,what is the value of the mean square error?
A)600.33
B)24.50
C)21.67
D)18.57
The sales details of a particular game are shown below.The value of k is set at 3.
For the given data,what is the value of the mean square error?
A)600.33
B)24.50
C)21.67
D)18.57
Question
Use the data given below to answer the following question(s).
The table below shows the car sales from the year 2002-2007.The forecaster assumes a smoothing constant of 0.8 and uses the exponential smoothing model to determine the forecast for the future.
From the data given above,what is the forecast-in 000s-for the year 2006?
A)39.60 units
B)40.72 units
C)47.34 units
D)52.67 units
Question
Use the data given below to answer the following question(s).
The table below shows the sales of a gaming console for the first 6 months of the year 2011.
The forecaster uses the weighted average model to determine the forecasts.He assumes a 40% weight for the most recent reading,30% weight for the second most recent reading,20% for the third most recent reading,and 10% for the fourth most recent reading.
For the data given above,the number of forecast values is ________.
A)2
B)3
C)4
D)5
Question
Use the data given below to answer the following question(s).
The table below shows the sales of a gaming console for the first 6 months of the year 2011.
The forecaster uses the weighted average model to determine the forecasts.He assumes a 40% weight for the most recent reading,30% weight for the second most recent reading,20% for the third most recent reading,and 10% for the fourth most recent reading.
For the given data,the value of the mean absolute percentage error is ________.
A)51.5
B)26.95
C)5.19
D)21.03
Question
Use the data given below to answer the following question(s).
The table below shows the car sales from the year 2002-2007.The forecaster assumes a smoothing constant of 0.8 and uses the exponential smoothing model to determine the forecast for the future.
From the data given above,what is the forecast-in 000s-for the year 2007?
A)39.60 units
B)40.72 units
C)47.34 units
D)52.67 units
Question
Use the data given below to answer the following question(s).
The table below shows the industrial lathe sales from the years 2000-2005.The forecaster uses the regression method to determine the forecast for the future.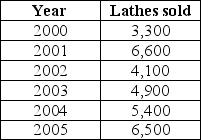
For the data given above,determine the regression equation.
A)y = 377.14x + 3,813.33
B)y = 3,813.33x + 377.14
C)y = 3,813.33x - 377.14
D)y = 377.14x - 3,813.33
Question
Use the data given below to answer the following question(s).
The table below shows the industrial lathe sales from the years 2000-2005.The forecaster uses the regression method to determine the forecast for the future.
For the data given above,calculate the forecast value for the year 2006.
A)approximately 5,699 units
B)approximately 5,322 units
C)approximately 4,945 units
D)approximately 6,453 units
Question
Use the data given below to answer the following question(s).
The table below shows the car sales from the year 2002-2007.The forecaster assumes a smoothing constant of 0.8 and uses the exponential smoothing model to determine the forecast for the future.
Using the given data,determine the value of the root mean square error.
A)225.98
B)10.28
C)15.03
D)25.27
The table below shows the car sales from the year 2002-2007.The forecaster assumes a smoothing constant of 0.8 and uses the exponential smoothing model to determine the forecast for the future.
Using the given data,determine the value of the root mean square error.
A)225.98
B)10.28
C)15.03
D)25.27
Question
Use the data given below to answer the following question(s).
The table below shows the industrial lathe sales from the years 2000-2005.The forecaster uses the regression method to determine the forecast for the future.
For the data given above,determine the sales forecast for the year 2011.
A)approximately 8,339 units
B)approximately 9,338 units
C)approximately 3,398 units
D)approximately 6,453 units
Question
Question
Use the data given below to answer the following question(s).
The table below shows the car sales from the year 2002-2007.The forecaster assumes a smoothing constant of 0.8 and uses the exponential smoothing model to determine the forecast for the future.
For the given data,the value of the mean square error is ________.
A)225.98
B)10.28
C)15.03
D)25.27
The table below shows the car sales from the year 2002-2007.The forecaster assumes a smoothing constant of 0.8 and uses the exponential smoothing model to determine the forecast for the future.
For the given data,the value of the mean square error is ________.
A)225.98
B)10.28
C)15.03
D)25.27
Question
Use the data given below to answer the following question(s).
The table below shows the industrial lathe sales from the years 2000-2005.The forecaster uses the regression method to determine the forecast for the future.
Using the given data,determine the value of MAPE.[Hint: Round the forecast values to 3 decimal places.]
A)10.14
B)81.87
C)1.00
D)16.51
The table below shows the industrial lathe sales from the years 2000-2005.The forecaster uses the regression method to determine the forecast for the future.
Using the given data,determine the value of MAPE.[Hint: Round the forecast values to 3 decimal places.]
A)10.14
B)81.87
C)1.00
D)16.51
Question
Use the data given below to answer the following question(s).
The table below shows the car sales from the year 2002-2007.The forecaster assumes a smoothing constant of 0.8 and uses the exponential smoothing model to determine the forecast for the future.
In the double exponential smoothing model Ft+k = at + btk,identify the value that signifies the level.
A)at
B)Ft+k
C)bt
D)k
Question
Use the data given below to answer the following question(s).
The table below shows the industrial lathe sales from the years 2000-2005.The forecaster uses the regression method to determine the forecast for the future.
For the data given above,what is the value of RMSE? [Hint: Round the forecast values to 3 decimal places.]
A)1,014,031.75
B)818.73
C)1,006.99
D)16.51
Question
Use the data given below to answer the following question(s).
The table below shows the industrial lathe sales from the years 2000-2005.The forecaster uses the regression method to determine the forecast for the future.
For the data given above,identify the value of MAD.[Hint: Round the forecast values to 3 decimal places.]
A)1,014,031.75
B)818.73
C)1,006.99
D)16.51
Question
Use the data given below to answer the following question(s).
The table below shows the car sales from the year 2002-2007.The forecaster assumes a smoothing constant of 0.8 and uses the exponential smoothing model to determine the forecast for the future.
In the double exponential smoothing model Ft+k = at + btk,identify the value that signifies the trend.
A)at
B)Ft+k
C)k
D)bt
Question
Use the data given below to answer the following question(s).
The table below shows the car sales from the year 2002-2007.The forecaster assumes a smoothing constant of 0.8 and uses the exponential smoothing model to determine the forecast for the future.
In the double exponential smoothing model Ft+k = at + btk,identify the value that signifies the slope.
A)at
B)Ft+k
C)bt
D)k
Question
Use the data given below to answer the following question(s).
The table below shows the industrial lathe sales from the years 2000-2005.The forecaster uses the regression method to determine the forecast for the future.
For the data given above,the forecast for the year 2003 is approximately close to ________.
A)5,699 units
B)5,322 units
C)4,945 units
D)6,076 units
Question
Question
Use the data given below to answer the following question(s).
The table below shows the car sales from the year 2002-2007.The forecaster assumes a smoothing constant of 0.8 and uses the exponential smoothing model to determine the forecast for the future.
Using the given data,determine the value of the mean absolute deviation.
A)225.98
B)10.28
C)15.03
D)25.27
The table below shows the car sales from the year 2002-2007.The forecaster assumes a smoothing constant of 0.8 and uses the exponential smoothing model to determine the forecast for the future.
Using the given data,determine the value of the mean absolute deviation.
A)225.98
B)10.28
C)15.03
D)25.27
Question
Use the data given below to answer the following question(s).
The table below shows the industrial lathe sales from the years 2000-2005.The forecaster uses the regression method to determine the forecast for the future.
For the given data,the value of MSE is ________.[Hint: Round the forecast values to 3 decimal places.]
A)1,014,031.75
B)818.73
C)1,006.99
D)16.51
Question
Question
Question
Use the data given below to answer the following question(s).
The table below shows the car sales from the year 2002-2007.The forecaster assumes a smoothing constant of 0.8 and uses the exponential smoothing model to determine the forecast for the future.
Using the given data,calculate the value of mean absolute percentage error.
A)12.56
B)10.28
C)15.03
D)25.27
Question
Question
Use the data shown below to answer the following question(s).
The table below shows the sales details of a kind of vegetable sold at a department store for each week.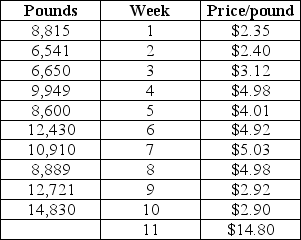
For the given data,determine the multiple regression equation.
A)Forecast = 6,879.27 + 724.10Week - 220.24Price/pound
B)Forecast = 724.10 + 6,879.27Week - 220.24Price/pound
C)Forecast = 724.10 + 220.24Week - 6,879.27Price/pound
D)Forecast = 6,879.27 + 220.24Week - 724.10Price/pound
Question
Question
Use the data shown below to answer the following question(s).
The table below shows the sales details of a kind of vegetable sold at a department store for each week.
For the given data,the value of the mean square error is ________.
A)2,444,136.45
B)1,563.37
C)1,341.46
D)14.78
The table below shows the sales details of a kind of vegetable sold at a department store for each week.
For the given data,the value of the mean square error is ________.
A)2,444,136.45
B)1,563.37
C)1,341.46
D)14.78
Question
Use the data shown below to answer the following question(s).
The table below shows the sales details of a kind of vegetable sold at a department store for each week.
For the given data,what is the value of mean absolute percentage error?
A)24.45
B)37.63
C)14.78
D)64.31
The table below shows the sales details of a kind of vegetable sold at a department store for each week.
For the given data,what is the value of mean absolute percentage error?
A)24.45
B)37.63
C)14.78
D)64.31
Question
Question
Question
Question
Use the data shown below to answer the following question(s).
The table below shows the sales details of a kind of vegetable sold at a department store for each week.
If the price/pound of the vegetable sold on week 15 is $5,determine the forecast for week 15.
A)approximately 20,840 pounds
B)approximately 18,410 pounds
C)approximately 16,640 pounds
D)approximately 11,584 pounds
Question
Question
Question
Question
Question
Question
Use the data shown below to answer the following question(s).
The table below shows the sales details of a kind of vegetable sold at a department store for each week.
Using the given data,determine the forecast for week 11.
A)approximately 10,840 pounds
B)approximately 8,410 pounds
C)approximately 12,753 pounds
D)approximately 11,585 pounds
The table below shows the sales details of a kind of vegetable sold at a department store for each week.
Using the given data,determine the forecast for week 11.
A)approximately 10,840 pounds
B)approximately 8,410 pounds
C)approximately 12,753 pounds
D)approximately 11,585 pounds
Question
Question
Use the data shown below to answer the following question(s).
The table below shows the sales details of a kind of vegetable sold at a department store for each week.
Using the given data,calculate the value of mean absolute deviation.
A)2,444,136.45
B)1,563.37
C)1,341.46
D)14.78
The table below shows the sales details of a kind of vegetable sold at a department store for each week.
Using the given data,calculate the value of mean absolute deviation.
A)2,444,136.45
B)1,563.37
C)1,341.46
D)14.78
Question
Use the data shown below to answer the following question(s).
The table below shows the sales details of a kind of vegetable sold at a department store for each week.
For the given data,the value of the root mean square error is ________.
A)2,444,136.45
B)1,563.37
C)1,341.46
D)14.78
The table below shows the sales details of a kind of vegetable sold at a department store for each week.
For the given data,the value of the root mean square error is ________.
A)2,444,136.45
B)1,563.37
C)1,341.46
D)14.78
Question
Question

Unlock Deck
Sign up to unlock the cards in this deck!
Unlock Deck
Unlock Deck
1/100
Play
Full screen (f)
Deck 7: Forecasting
1
If the sales forecaster at Dino Croc Inc.-before launching a new game-decides to use the method of historical analogy to obtain a forecast,he/she should ________.
A)note the behavior of the company's current customers while they purchase a gaming accessory
B)note the response of similar previous games to marketing campaigns and use the responses as a basis to predict how the new marketing campaign might fare
C)request a panel of gamers-whose identities should be kept confidential from one another-to respond to a sequence of questionnaires
D)use a brainstorming session among a group of gamers to draw new ideas
note the response of similar previous games to marketing campaigns and use the responses as a basis to predict how the new marketing campaign might fare
2
What is the gradual shift in the value of the time series known as?
A)a trend
B)a coordinate
C)a weight
D)a smoothing constant
A)a trend
B)a coordinate
C)a weight
D)a smoothing constant
a trend
3
Use the data given below to answer the following question(s).
The sales details for 6 weeks of a particular type of switches,called the "Twitch," are shown in the table below.The value of k is set at 2.
For the given data,the value of the root mean square error is ________.
A)9.25
B)7.36
C)54.13
D)21.10
The sales details for 6 weeks of a particular type of switches,called the "Twitch," are shown in the table below.The value of k is set at 2.
For the given data,the value of the root mean square error is ________.
A)9.25
B)7.36
C)54.13
D)21.10
7.36
4
Use the data given below to answer the following question(s).
The sales details for 6 weeks of a particular type of switches,called the "Twitch," are shown in the table below.The value of k is set at 2.
Using the given data,calculate the value of the mean absolute deviation.
A)7.25
B)54.13
C)9.36
D)21.10
The sales details for 6 weeks of a particular type of switches,called the "Twitch," are shown in the table below.The value of k is set at 2.
Using the given data,calculate the value of the mean absolute deviation.
A)7.25
B)54.13
C)9.36
D)21.10
Unlock Deck
Unlock for access to all 100 flashcards in this deck.
Unlock Deck
k this deck
5
Use the data given below to answer the following question(s).
The sales details for 6 weeks of a particular type of switches,called the "Twitch," are shown in the table below.The value of k is set at 2.
For the given data,identify the value of the mean absolute percentage error.
A)9.25
B)7.36
C)54.13
D)21.10
The sales details for 6 weeks of a particular type of switches,called the "Twitch," are shown in the table below.The value of k is set at 2.
For the given data,identify the value of the mean absolute percentage error.
A)9.25
B)7.36
C)54.13
D)21.10
Unlock Deck
Unlock for access to all 100 flashcards in this deck.
Unlock Deck
k this deck
6
In the context of time series,a cyclical effect differs from a seasonal effect in that the cyclical effect ________.
A)shows a gradual shift in the time series
B)does not show a gradual shift in the time series
C)relates to much longer-term behavior
D)relates to much shorter-term behavior
A)shows a gradual shift in the time series
B)does not show a gradual shift in the time series
C)relates to much longer-term behavior
D)relates to much shorter-term behavior
Unlock Deck
Unlock for access to all 100 flashcards in this deck.
Unlock Deck
k this deck
7
The data for the number of guitars sold for the past 6 weeks are 25 units,20 units,25 units,25 units,20 units,and 18 units respectively.The time series appears to be relatively stable,without trend,seasonal,or cyclical effects; thus,a moving average model would be appropriate.Setting k = 3 the three-period moving average forecast for week 7 is ________.
A)18 units
B)21 units
C)25 units
D)19 units
A)18 units
B)21 units
C)25 units
D)19 units
Unlock Deck
Unlock for access to all 100 flashcards in this deck.
Unlock Deck
k this deck
8
Given: At = the actual value of the time series at time t,Ft = the forecast value for time t,and n = the number of forecast values.Identify the formula used to calculate the mean absolute percentage error.
A)MAPE = × 100
B)MAPE = × × 100
C)MAPE = × 100
D)MAPE = × 100
A)MAPE =
× 100B)MAPE = ×
× 100C)MAPE =
× 100D)MAPE =
× 100 Unlock Deck
Unlock for access to all 100 flashcards in this deck.
Unlock Deck
k this deck
9
The data for the number of action figures sold for the past 6 weeks are 25 units,20 units,25 units,25 units,20 units,and 18 units respectively.If 50% weightage is given to week 6,30% weightage to week 5,and 20% weightage to week 4,what is the three-period weighted moving average forecast for week 7?
A)20 units
B)18 units
C)25 units
D)21 units
A)20 units
B)18 units
C)25 units
D)21 units
Unlock Deck
Unlock for access to all 100 flashcards in this deck.
Unlock Deck
k this deck
10
If At is the actual value of the time series at time t,Ft is the forecast value for time t,and n is the number of forecast values,the formula used to calculate the root mean square of errors is ________.
A)RMSE =
B)RMSE =
C)RMSE =
D)RMSE =
A)RMSE =
B)RMSE =
C)RMSE =
D)RMSE =
Unlock Deck
Unlock for access to all 100 flashcards in this deck.
Unlock Deck
k this deck
11
Use the data given below to answer the following question(s).
The sales details for 6 weeks of a particular type of switches,called the "Twitch," are shown in the table below.The value of k is set at 2.
Using the given data,determine the value of the mean square error.
A)7.25
B)9.36
C)54.13
D)21.10
The sales details for 6 weeks of a particular type of switches,called the "Twitch," are shown in the table below.The value of k is set at 2.
Using the given data,determine the value of the mean square error.
A)7.25
B)9.36
C)54.13
D)21.10
Unlock Deck
Unlock for access to all 100 flashcards in this deck.
Unlock Deck
k this deck
12
Use the data given below to answer the following question(s).
The sales details for 6 weeks of a particular type of switches,called the "Twitch," are shown in the table below.The value of k is set at 2.
For the given data,identify the number of forecast values.
A)2
B)3
C)4
D)5
The sales details for 6 weeks of a particular type of switches,called the "Twitch," are shown in the table below.The value of k is set at 2.
For the given data,identify the number of forecast values.
A)2
B)3
C)4
D)5
Unlock Deck
Unlock for access to all 100 flashcards in this deck.
Unlock Deck
k this deck
13
A(n)________ is a stream of historical data.
A)index
B)time series
C)irrational number
D)orthopole
A)index
B)time series
C)irrational number
D)orthopole
Unlock Deck
Unlock for access to all 100 flashcards in this deck.
Unlock Deck
k this deck
14
Given: At = the actual value of the time series at time t,Ft = the forecast value for time t,and n = the number of forecast values.Identify the formula used to calculate the mean absolute deviation.
A)MAD =
B)MAD =
C)MAD =
D)MAD =
A)MAD =
B)MAD =
C)MAD =
D)MAD =
Unlock Deck
Unlock for access to all 100 flashcards in this deck.
Unlock Deck
k this deck
15
If the sales forecaster at Dex-Starr Inc.-before launching a new 12-string guitar-decides to use the Delphi method to obtain a forecast,he/she should ________.
A)note the behavior of the company's current customers while they purchase guitars from the current product line
B)note the response of similar 12-string guitars to marketing campaigns and use the responses as a basis to predict how the new marketing campaign might fare
C)mail out questionnaires to a panel of expert guitarists whose identities are known only to the forecaster
D)use a brainstorming session among a group of metal guitarists to draw new ideas
Unlock Deck
Unlock for access to all 100 flashcards in this deck.
Unlock Deck
k this deck
16
Which of the following uses a panel of experts,whose identities are typically kept confidential from one another,to respond to a sequence of questionnaires?
A)the Simple Moving average method
B)the method of Historical Analogy
C)the Delphi method of forecasting
D)the Simple Exponential Smoothing method
A)the Simple Moving average method
B)the method of Historical Analogy
C)the Delphi method of forecasting
D)the Simple Exponential Smoothing method
Unlock Deck
Unlock for access to all 100 flashcards in this deck.
Unlock Deck
k this deck
17
Use the data given below to answer the following question(s).
The sales details for 6 weeks of a particular type of switches,called the "Twitch," are shown in the table below.The value of k is set at 2.
For the data given above,the forecast for week 5 is ________.
A)33 units
B)25 units
C)30 units
D)35 units
The sales details for 6 weeks of a particular type of switches,called the "Twitch," are shown in the table below.The value of k is set at 2.
For the data given above,the forecast for week 5 is ________.
A)33 units
B)25 units
C)30 units
D)35 units
Unlock Deck
Unlock for access to all 100 flashcards in this deck.
Unlock Deck
k this deck
18
Time-series models ________.
A)assume that whatever forces have influenced sales in the recent past will continue into the near future
B)assume that forecasts are seldom developed by extrapolating historical data into the future
C)include independent variables like,demand conditions and the current economy state that help in forecasting
D)are also known as judgmental forecasting models
Unlock Deck
Unlock for access to all 100 flashcards in this deck.
Unlock Deck
k this deck
19
If At is the actual value of the time series at time t,Ft is the forecast value for time t,and n is the number of forecast values,the formula used to calculate the mean square of errors is ________.
A)MSE =
B)MSE =
C)MSE =
D)MSE =
A)MSE =
B)MSE =
C)MSE =
D)MSE =
Unlock Deck
Unlock for access to all 100 flashcards in this deck.
Unlock Deck
k this deck
20
The Delphi method of forecasting ________.
A)obtains forecasts through a comparative analysis with a previous situation
B)uses measures that are believed to influence the behavior of a variable that the researcher wishes to forecast
C)uses a single measure that weights multiple indicators and provides a measure of overall expectation
D)promotes unbiased exchanges of ideas and discussion and usually results in some convergence of opinion
Unlock Deck
Unlock for access to all 100 flashcards in this deck.
Unlock Deck
k this deck
21
Use the data given below to answer the following question(s).
The table below shows the car sales from the year 2002-2007.The forecaster assumes a smoothing constant of 0.8 and uses the exponential smoothing model to determine the forecast for the future.
From the data given above,the sales forecast for the year 2008 (in 000s)is ________.
A)40.72 units
B)47.34 units
C)52.67 units
D)62.53 units
Unlock Deck
Unlock for access to all 100 flashcards in this deck.
Unlock Deck
k this deck
22
Use the data given below to answer the following question(s).
The sales details of a particular game are shown below.The value of k is set at 3.
For the given data,what is the value of the root mean square error?
A)600.33
B)24.50
C)21.67
D)18.57
The sales details of a particular game are shown below.The value of k is set at 3.
For the given data,what is the value of the root mean square error?
A)600.33
B)24.50
C)21.67
D)18.57
Unlock Deck
Unlock for access to all 100 flashcards in this deck.
Unlock Deck
k this deck
23
Use the data given below to answer the following question(s).
The table below shows the sales of a gaming console for the first 6 months of the year 2011.
The forecaster uses the weighted average model to determine the forecasts.He assumes a 40% weight for the most recent reading,30% weight for the second most recent reading,20% for the third most recent reading,and 10% for the fourth most recent reading.
Using the given data,determine the value of the root mean square error.
A)9.15
B)26.95
C)0.87
D)6.70
Unlock Deck
Unlock for access to all 100 flashcards in this deck.
Unlock Deck
k this deck
24
Use the data given below to answer the following question(s).
The table below shows the sales of a gaming console for the first 6 months of the year 2011.
The forecaster uses the weighted average model to determine the forecasts.He assumes a 40% weight for the most recent reading,30% weight for the second most recent reading,20% for the third most recent reading,and 10% for the fourth most recent reading.
Using the given data,calculate the value of the mean absolute deviation.
A)26.95
B)9.19
C)6.65
D)0.87
Unlock Deck
Unlock for access to all 100 flashcards in this deck.
Unlock Deck
k this deck
25
Use the data given below to answer the following question(s).
The table below shows the car sales from the year 2002-2007.The forecaster assumes a smoothing constant of 0.8 and uses the exponential smoothing model to determine the forecast for the future.
From the data given above,what is the forecast-in 000s-for the year 2003?
A)41 units
B)33 units
C)66 units
D)49 units
Unlock Deck
Unlock for access to all 100 flashcards in this deck.
Unlock Deck
k this deck
26
Use the data given below to answer the following question(s).
The table below shows the car sales from the year 2002-2007.The forecaster assumes a smoothing constant of 0.8 and uses the exponential smoothing model to determine the forecast for the future.
From the data given above,the forecast for the year 2005 (in 000s)is ________.
A)39.60 units
B)40.72 units
C)47.34 units
D)52.67 units
Unlock Deck
Unlock for access to all 100 flashcards in this deck.
Unlock Deck
k this deck
27
Use the data given below to answer the following question(s).
The table below shows the car sales from the year 2002-2007.The forecaster assumes a smoothing constant of 0.8 and uses the exponential smoothing model to determine the forecast for the future.
From the data given above,determine the number of forecast values.
A)3
B)4
C)5
D)6
The table below shows the car sales from the year 2002-2007.The forecaster assumes a smoothing constant of 0.8 and uses the exponential smoothing model to determine the forecast for the future.
From the data given above,determine the number of forecast values.
A)3
B)4
C)5
D)6
Unlock Deck
Unlock for access to all 100 flashcards in this deck.
Unlock Deck
k this deck
28
Use the data given below to answer the following question(s).
The sales details of a particular game are shown below.The value of k is set at 3.
For the data given above,the forecast for week 7 is ________.
A)112 units
B)211 units
C)121 units
D)82 units
The sales details of a particular game are shown below.The value of k is set at 3.
For the data given above,the forecast for week 7 is ________.
A)112 units
B)211 units
C)121 units
D)82 units
Unlock Deck
Unlock for access to all 100 flashcards in this deck.
Unlock Deck
k this deck
29
Use the data given below to answer the following question(s).
The table below shows the sales of a gaming console for the first 6 months of the year 2011.
The forecaster uses the weighted average model to determine the forecasts.He assumes a 40% weight for the most recent reading,30% weight for the second most recent reading,20% for the third most recent reading,and 10% for the fourth most recent reading.
Using the given data,calculate the value of the mean square error.
A)5.15
B)44.95
C)9.19
D)0.87
Unlock Deck
Unlock for access to all 100 flashcards in this deck.
Unlock Deck
k this deck
30
Use the data given below to answer the following question(s).
The table below shows the car sales from the year 2002-2007.The forecaster assumes a smoothing constant of 0.8 and uses the exponential smoothing model to determine the forecast for the future.
From the data given above,what is the forecast-in 000s-for the year 2004?
A)39.60 units
B)40.72 units
C)47.34 units
D)52.67 units
Unlock Deck
Unlock for access to all 100 flashcards in this deck.
Unlock Deck
k this deck
31
Use the data given below to answer the following question(s).
The sales details of a particular game are shown below.The value of k is set at 3.
For the given data,identify the number of forecast values.
A)2
B)3
C)4
D)5
The sales details of a particular game are shown below.The value of k is set at 3.
For the given data,identify the number of forecast values.
A)2
B)3
C)4
D)5
Unlock Deck
Unlock for access to all 100 flashcards in this deck.
Unlock Deck
k this deck
32
Use the data given below to answer the following question(s).
The table below shows the sales of a gaming console for the first 6 months of the year 2011.
The forecaster uses the weighted average model to determine the forecasts.He assumes a 40% weight for the most recent reading,30% weight for the second most recent reading,20% for the third most recent reading,and 10% for the fourth most recent reading.
The value of α in the simple exponential smoothing model Ft + 1 = (1 - α)Ft + αAt lies between ________.
A)1 and 2
B)-1 and 0
C)0 and 1
D)-1 and 1
Unlock Deck
Unlock for access to all 100 flashcards in this deck.
Unlock Deck
k this deck
33
Use the data given below to answer the following question(s).
The sales details of a particular game are shown below.The value of k is set at 3.
Using the given data,calculate the value of the mean absolute deviation.
A)600.33
B)24.50
C)21.67
D)18.57
The sales details of a particular game are shown below.The value of k is set at 3.
Using the given data,calculate the value of the mean absolute deviation.
A)600.33
B)24.50
C)21.67
D)18.57
Unlock Deck
Unlock for access to all 100 flashcards in this deck.
Unlock Deck
k this deck
34
Use the data given below to answer the following question(s).
The table below shows the sales of a gaming console for the first 6 months of the year 2011.
The forecaster uses the weighted average model to determine the forecasts.He assumes a 40% weight for the most recent reading,30% weight for the second most recent reading,20% for the third most recent reading,and 10% for the fourth most recent reading.
In the simple exponential smoothing model Ft + 1 = (1 - α)Ft + αAt,the exponential smoothing constant is ________.
A)Ft+1
B)α
C)At
D)Ft
Unlock Deck
Unlock for access to all 100 flashcards in this deck.
Unlock Deck
k this deck
35
Use the data given below to answer the following question(s).
The sales details of a particular game are shown below.The value of k is set at 3.
For the given data,the value of the mean absolute percentage error is ________.
A)600.33
B)24.50
C)18.57
D)21.67
The sales details of a particular game are shown below.The value of k is set at 3.
For the given data,the value of the mean absolute percentage error is ________.
A)600.33
B)24.50
C)18.57
D)21.67
Unlock Deck
Unlock for access to all 100 flashcards in this deck.
Unlock Deck
k this deck
36
Use the data given below to answer the following question(s).
The table below shows the sales of a gaming console for the first 6 months of the year 2011.
The forecaster uses the weighted average model to determine the forecasts.He assumes a 40% weight for the most recent reading,30% weight for the second most recent reading,20% for the third most recent reading,and 10% for the fourth most recent reading.
From the given data,determine the forecast for the 5th month.
A)35.80 units
B)58.80 units
C)42.20 units
D)24.20 units
Unlock Deck
Unlock for access to all 100 flashcards in this deck.
Unlock Deck
k this deck
37
Use the data given below to answer the following question(s).
The sales details of a particular game are shown below.The value of k is set at 3.
For the given data,what is the value of the mean square error?
A)600.33
B)24.50
C)21.67
D)18.57
The sales details of a particular game are shown below.The value of k is set at 3.
For the given data,what is the value of the mean square error?
A)600.33
B)24.50
C)21.67
D)18.57
Unlock Deck
Unlock for access to all 100 flashcards in this deck.
Unlock Deck
k this deck
38
Use the data given below to answer the following question(s).
The table below shows the car sales from the year 2002-2007.The forecaster assumes a smoothing constant of 0.8 and uses the exponential smoothing model to determine the forecast for the future.
From the data given above,what is the forecast-in 000s-for the year 2006?
A)39.60 units
B)40.72 units
C)47.34 units
D)52.67 units
Unlock Deck
Unlock for access to all 100 flashcards in this deck.
Unlock Deck
k this deck
39
Use the data given below to answer the following question(s).
The table below shows the sales of a gaming console for the first 6 months of the year 2011.
The forecaster uses the weighted average model to determine the forecasts.He assumes a 40% weight for the most recent reading,30% weight for the second most recent reading,20% for the third most recent reading,and 10% for the fourth most recent reading.
For the data given above,the number of forecast values is ________.
A)2
B)3
C)4
D)5
Unlock Deck
Unlock for access to all 100 flashcards in this deck.
Unlock Deck
k this deck
40
Use the data given below to answer the following question(s).
The table below shows the sales of a gaming console for the first 6 months of the year 2011.
The forecaster uses the weighted average model to determine the forecasts.He assumes a 40% weight for the most recent reading,30% weight for the second most recent reading,20% for the third most recent reading,and 10% for the fourth most recent reading.
For the given data,the value of the mean absolute percentage error is ________.
A)51.5
B)26.95
C)5.19
D)21.03
Unlock Deck
Unlock for access to all 100 flashcards in this deck.
Unlock Deck
k this deck
41
Use the data given below to answer the following question(s).
The table below shows the car sales from the year 2002-2007.The forecaster assumes a smoothing constant of 0.8 and uses the exponential smoothing model to determine the forecast for the future.
From the data given above,what is the forecast-in 000s-for the year 2007?
A)39.60 units
B)40.72 units
C)47.34 units
D)52.67 units
Unlock Deck
Unlock for access to all 100 flashcards in this deck.
Unlock Deck
k this deck
42
Use the data given below to answer the following question(s).
The table below shows the industrial lathe sales from the years 2000-2005.The forecaster uses the regression method to determine the forecast for the future.
For the data given above,determine the regression equation.
A)y = 377.14x + 3,813.33
B)y = 3,813.33x + 377.14
C)y = 3,813.33x - 377.14
D)y = 377.14x - 3,813.33
Unlock Deck
Unlock for access to all 100 flashcards in this deck.
Unlock Deck
k this deck
43
Use the data given below to answer the following question(s).
The table below shows the industrial lathe sales from the years 2000-2005.The forecaster uses the regression method to determine the forecast for the future.
For the data given above,calculate the forecast value for the year 2006.
A)approximately 5,699 units
B)approximately 5,322 units
C)approximately 4,945 units
D)approximately 6,453 units
Unlock Deck
Unlock for access to all 100 flashcards in this deck.
Unlock Deck
k this deck
44
Use the data given below to answer the following question(s).
The table below shows the car sales from the year 2002-2007.The forecaster assumes a smoothing constant of 0.8 and uses the exponential smoothing model to determine the forecast for the future.
Using the given data,determine the value of the root mean square error.
A)225.98
B)10.28
C)15.03
D)25.27
The table below shows the car sales from the year 2002-2007.The forecaster assumes a smoothing constant of 0.8 and uses the exponential smoothing model to determine the forecast for the future.
Using the given data,determine the value of the root mean square error.
A)225.98
B)10.28
C)15.03
D)25.27
Unlock Deck
Unlock for access to all 100 flashcards in this deck.
Unlock Deck
k this deck
45
Use the data given below to answer the following question(s).
The table below shows the industrial lathe sales from the years 2000-2005.The forecaster uses the regression method to determine the forecast for the future.
For the data given above,determine the sales forecast for the year 2011.
A)approximately 8,339 units
B)approximately 9,338 units
C)approximately 3,398 units
D)approximately 6,453 units
Unlock Deck
Unlock for access to all 100 flashcards in this deck.
Unlock Deck
k this deck
46
The Holt-Winters additive model is based on the equation ________.
A)Ft + 1 = at + bt + St - s - 2
B)Ft + 1 = at + bt + St - s + 1
C)Ft + 1 = at - 2 + bt + St - s - 2
D)Ft + 1 = at + bt -1 + St - 2
A)Ft + 1 = at + bt + St - s - 2
B)Ft + 1 = at + bt + St - s + 1
C)Ft + 1 = at - 2 + bt + St - s - 2
D)Ft + 1 = at + bt -1 + St - 2
Unlock Deck
Unlock for access to all 100 flashcards in this deck.
Unlock Deck
k this deck
47
Use the data given below to answer the following question(s).
The table below shows the car sales from the year 2002-2007.The forecaster assumes a smoothing constant of 0.8 and uses the exponential smoothing model to determine the forecast for the future.
For the given data,the value of the mean square error is ________.
A)225.98
B)10.28
C)15.03
D)25.27
The table below shows the car sales from the year 2002-2007.The forecaster assumes a smoothing constant of 0.8 and uses the exponential smoothing model to determine the forecast for the future.
For the given data,the value of the mean square error is ________.
A)225.98
B)10.28
C)15.03
D)25.27
Unlock Deck
Unlock for access to all 100 flashcards in this deck.
Unlock Deck
k this deck
48
Use the data given below to answer the following question(s).
The table below shows the industrial lathe sales from the years 2000-2005.The forecaster uses the regression method to determine the forecast for the future.
Using the given data,determine the value of MAPE.[Hint: Round the forecast values to 3 decimal places.]
A)10.14
B)81.87
C)1.00
D)16.51
The table below shows the industrial lathe sales from the years 2000-2005.The forecaster uses the regression method to determine the forecast for the future.
Using the given data,determine the value of MAPE.[Hint: Round the forecast values to 3 decimal places.]
A)10.14
B)81.87
C)1.00
D)16.51
Unlock Deck
Unlock for access to all 100 flashcards in this deck.
Unlock Deck
k this deck
49
Use the data given below to answer the following question(s).
The table below shows the car sales from the year 2002-2007.The forecaster assumes a smoothing constant of 0.8 and uses the exponential smoothing model to determine the forecast for the future.
In the double exponential smoothing model Ft+k = at + btk,identify the value that signifies the level.
A)at
B)Ft+k
C)bt
D)k
Unlock Deck
Unlock for access to all 100 flashcards in this deck.
Unlock Deck
k this deck
50
Use the data given below to answer the following question(s).
The table below shows the industrial lathe sales from the years 2000-2005.The forecaster uses the regression method to determine the forecast for the future.
For the data given above,what is the value of RMSE? [Hint: Round the forecast values to 3 decimal places.]
A)1,014,031.75
B)818.73
C)1,006.99
D)16.51
Unlock Deck
Unlock for access to all 100 flashcards in this deck.
Unlock Deck
k this deck
51
Use the data given below to answer the following question(s).
The table below shows the industrial lathe sales from the years 2000-2005.The forecaster uses the regression method to determine the forecast for the future.
For the data given above,identify the value of MAD.[Hint: Round the forecast values to 3 decimal places.]
A)1,014,031.75
B)818.73
C)1,006.99
D)16.51
Unlock Deck
Unlock for access to all 100 flashcards in this deck.
Unlock Deck
k this deck
52
Use the data given below to answer the following question(s).
The table below shows the car sales from the year 2002-2007.The forecaster assumes a smoothing constant of 0.8 and uses the exponential smoothing model to determine the forecast for the future.
In the double exponential smoothing model Ft+k = at + btk,identify the value that signifies the trend.
A)at
B)Ft+k
C)k
D)bt
Unlock Deck
Unlock for access to all 100 flashcards in this deck.
Unlock Deck
k this deck
53
Use the data given below to answer the following question(s).
The table below shows the car sales from the year 2002-2007.The forecaster assumes a smoothing constant of 0.8 and uses the exponential smoothing model to determine the forecast for the future.
In the double exponential smoothing model Ft+k = at + btk,identify the value that signifies the slope.
A)at
B)Ft+k
C)bt
D)k
Unlock Deck
Unlock for access to all 100 flashcards in this deck.
Unlock Deck
k this deck
54
Use the data given below to answer the following question(s).
The table below shows the industrial lathe sales from the years 2000-2005.The forecaster uses the regression method to determine the forecast for the future.
For the data given above,the forecast for the year 2003 is approximately close to ________.
A)5,699 units
B)5,322 units
C)4,945 units
D)6,076 units
Unlock Deck
Unlock for access to all 100 flashcards in this deck.
Unlock Deck
k this deck
55
In the first-order autoregressive model Yi = a0 + a1Yi-1+ i,identify the nonautocorrelated random error term.
A)a0
B)i
C)a1
D)Yi-1
A)a0
B)i
C)a1
D)Yi-1
Unlock Deck
Unlock for access to all 100 flashcards in this deck.
Unlock Deck
k this deck
56
Use the data given below to answer the following question(s).
The table below shows the car sales from the year 2002-2007.The forecaster assumes a smoothing constant of 0.8 and uses the exponential smoothing model to determine the forecast for the future.
Using the given data,determine the value of the mean absolute deviation.
A)225.98
B)10.28
C)15.03
D)25.27
The table below shows the car sales from the year 2002-2007.The forecaster assumes a smoothing constant of 0.8 and uses the exponential smoothing model to determine the forecast for the future.
Using the given data,determine the value of the mean absolute deviation.
A)225.98
B)10.28
C)15.03
D)25.27
Unlock Deck
Unlock for access to all 100 flashcards in this deck.
Unlock Deck
k this deck
57
Use the data given below to answer the following question(s).
The table below shows the industrial lathe sales from the years 2000-2005.The forecaster uses the regression method to determine the forecast for the future.
For the given data,the value of MSE is ________.[Hint: Round the forecast values to 3 decimal places.]
A)1,014,031.75
B)818.73
C)1,006.99
D)16.51
Unlock Deck
Unlock for access to all 100 flashcards in this deck.
Unlock Deck
k this deck
58
If St - s + k is the seasonal factor for period t - s + k and s is the number of periods in a season,the seasonal multiplicative model can be written as ________.
A)Ft + k = (at + k)St - s + k
B)Ft = at St - s + k
C)Ft = at +k St - s + k
D)Ft + k = at St - s + k
A)Ft + k = (at + k)St - s + k
B)Ft = at St - s + k
C)Ft = at +k St - s + k
D)Ft + k = at St - s + k
Unlock Deck
Unlock for access to all 100 flashcards in this deck.
Unlock Deck
k this deck
59
If St - s + k is the seasonal factor for period t - s + k and s is the number of periods in a season,the seasonal additive model can be written as ________.
A)Ft + k = at + St - s + k
B)Ft = at + St - s + k
C)Ft = at + k + St - s + k
D)Ft + k = (at + k)+ St - s + k
A)Ft + k = at + St - s + k
B)Ft = at + St - s + k
C)Ft = at + k + St - s + k
D)Ft + k = (at + k)+ St - s + k
Unlock Deck
Unlock for access to all 100 flashcards in this deck.
Unlock Deck
k this deck
60
Use the data given below to answer the following question(s).
The table below shows the car sales from the year 2002-2007.The forecaster assumes a smoothing constant of 0.8 and uses the exponential smoothing model to determine the forecast for the future.
Using the given data,calculate the value of mean absolute percentage error.
A)12.56
B)10.28
C)15.03
D)25.27
Unlock Deck
Unlock for access to all 100 flashcards in this deck.
Unlock Deck
k this deck
61
The Holt-Winters additive model differs from the Holt-Winters multiplicative model in that the Holt-Winters additive model ________.
A)is synonymous to the double exponential smoothing forecast model
B)is synonymous to the single exponential smoothing forecast model
C)applies to time series with relatively stable seasonality
D)applies to time series whose amplitude increases or decreases over time
A)is synonymous to the double exponential smoothing forecast model
B)is synonymous to the single exponential smoothing forecast model
C)applies to time series with relatively stable seasonality
D)applies to time series whose amplitude increases or decreases over time
Unlock Deck
Unlock for access to all 100 flashcards in this deck.
Unlock Deck
k this deck
62
Use the data shown below to answer the following question(s).
The table below shows the sales details of a kind of vegetable sold at a department store for each week.
For the given data,determine the multiple regression equation.
A)Forecast = 6,879.27 + 724.10Week - 220.24Price/pound
B)Forecast = 724.10 + 6,879.27Week - 220.24Price/pound
C)Forecast = 724.10 + 220.24Week - 6,879.27Price/pound
D)Forecast = 6,879.27 + 220.24Week - 724.10Price/pound
Unlock Deck
Unlock for access to all 100 flashcards in this deck.
Unlock Deck
k this deck
63
Jenny downloaded the company's umbrella sales for the past fiscal year to forecast the sales for the next fiscal year.Looking at the downloaded data set,she decided to use the Holt-Winters multiplicative model because the data set showed ________.
A)no trend and no seasonality
B)trend and seasonality
C)a trend and no seasonality
D)seasonality and no trend
A)no trend and no seasonality
B)trend and seasonality
C)a trend and no seasonality
D)seasonality and no trend
Unlock Deck
Unlock for access to all 100 flashcards in this deck.
Unlock Deck
k this deck
64
Use the data shown below to answer the following question(s).
The table below shows the sales details of a kind of vegetable sold at a department store for each week.
For the given data,the value of the mean square error is ________.
A)2,444,136.45
B)1,563.37
C)1,341.46
D)14.78
The table below shows the sales details of a kind of vegetable sold at a department store for each week.
For the given data,the value of the mean square error is ________.
A)2,444,136.45
B)1,563.37
C)1,341.46
D)14.78
Unlock Deck
Unlock for access to all 100 flashcards in this deck.
Unlock Deck
k this deck
65
Use the data shown below to answer the following question(s).
The table below shows the sales details of a kind of vegetable sold at a department store for each week.
For the given data,what is the value of mean absolute percentage error?
A)24.45
B)37.63
C)14.78
D)64.31
The table below shows the sales details of a kind of vegetable sold at a department store for each week.
For the given data,what is the value of mean absolute percentage error?
A)24.45
B)37.63
C)14.78
D)64.31
Unlock Deck
Unlock for access to all 100 flashcards in this deck.
Unlock Deck
k this deck
66
The Holt-Winters multiplicative model is based on the equation ________.
A)Ft + 1 = at (bt + St - s - 2)
B)Ft + 1 = at (bt + St - s + 1)
C)Ft + 1 = (at + bt)St - s + 1
D)Ft + 1 = (at + bt -1)St - 2
A)Ft + 1 = at (bt + St - s - 2)
B)Ft + 1 = at (bt + St - s + 1)
C)Ft + 1 = (at + bt)St - s + 1
D)Ft + 1 = (at + bt -1)St - 2
Unlock Deck
Unlock for access to all 100 flashcards in this deck.
Unlock Deck
k this deck
67
Sue decided to use the double moving average model to forecast the game sales for the next week,after looking at the tabulated sales for the past twelve weeks.What exactly did she observe?
A)a time series with no trend and no seasonality
B)a time series with trend and seasonality
C)a time series with trend and no seasonality
D)a time series with seasonality and no trend
A)a time series with no trend and no seasonality
B)a time series with trend and seasonality
C)a time series with trend and no seasonality
D)a time series with seasonality and no trend
Unlock Deck
Unlock for access to all 100 flashcards in this deck.
Unlock Deck
k this deck
68
Moving average and exponential smoothing models work best for stationary time series.
Unlock Deck
Unlock for access to all 100 flashcards in this deck.
Unlock Deck
k this deck
69
Use the data shown below to answer the following question(s).
The table below shows the sales details of a kind of vegetable sold at a department store for each week.
If the price/pound of the vegetable sold on week 15 is $5,determine the forecast for week 15.
A)approximately 20,840 pounds
B)approximately 18,410 pounds
C)approximately 16,640 pounds
D)approximately 11,584 pounds
Unlock Deck
Unlock for access to all 100 flashcards in this deck.
Unlock Deck
k this deck
70
If the given time series has a trend and no seasonality,the ________ is the most appropriate forecasting model to determine the forecast of the time series.
A)single exponential smoothing model
B)seasonal additive model
C)double moving average model
D)Holt-Winters multiplicative model
A)single exponential smoothing model
B)seasonal additive model
C)double moving average model
D)Holt-Winters multiplicative model
Unlock Deck
Unlock for access to all 100 flashcards in this deck.
Unlock Deck
k this deck
71
A seasonal effect in a time series is relatively long-term effect compared to a cyclical effect.
Unlock Deck
Unlock for access to all 100 flashcards in this deck.
Unlock Deck
k this deck
72
If the given time series has no trend and no seasonality,which of the following is the most appropriate forecasting model to determine the forecast of the time series?
A)the single moving average model
B)the seasonal additive model
C)the double exponential smoothing model
D)the Holt-Winters additive model
A)the single moving average model
B)the seasonal additive model
C)the double exponential smoothing model
D)the Holt-Winters additive model
Unlock Deck
Unlock for access to all 100 flashcards in this deck.
Unlock Deck
k this deck
73
In historical analogy,the forecast is obtained by using a panel of experts,whose identities are typically kept confidential from one another,to respond to a sequence of questionnaires.
Unlock Deck
Unlock for access to all 100 flashcards in this deck.
Unlock Deck
k this deck
74
The Holt-Winters multiplicative model differs from the Holt-Winters additive model in that the Holt-Winters multiplicative model ________.
A)is synonymous to the double exponential smoothing forecast model
B)is synonymous to the single exponential smoothing forecast model
C)applies to time series with relatively stable seasonality
D)applies to time series whose amplitude increases or decreases over time
A)is synonymous to the double exponential smoothing forecast model
B)is synonymous to the single exponential smoothing forecast model
C)applies to time series with relatively stable seasonality
D)applies to time series whose amplitude increases or decreases over time
Unlock Deck
Unlock for access to all 100 flashcards in this deck.
Unlock Deck
k this deck
75
Use the data shown below to answer the following question(s).
The table below shows the sales details of a kind of vegetable sold at a department store for each week.
Using the given data,determine the forecast for week 11.
A)approximately 10,840 pounds
B)approximately 8,410 pounds
C)approximately 12,753 pounds
D)approximately 11,585 pounds
The table below shows the sales details of a kind of vegetable sold at a department store for each week.
Using the given data,determine the forecast for week 11.
A)approximately 10,840 pounds
B)approximately 8,410 pounds
C)approximately 12,753 pounds
D)approximately 11,585 pounds
Unlock Deck
Unlock for access to all 100 flashcards in this deck.
Unlock Deck
k this deck
76
If the given time series exhibits seasonality but no trend,the ________ is the most appropriate forecasting model to determine the forecast of the time series.
A)single moving average model
B)seasonal multiplicative model
C)double exponential smoothing model
D)Holt-Winters additive model
A)single moving average model
B)seasonal multiplicative model
C)double exponential smoothing model
D)Holt-Winters additive model
Unlock Deck
Unlock for access to all 100 flashcards in this deck.
Unlock Deck
k this deck
77
Use the data shown below to answer the following question(s).
The table below shows the sales details of a kind of vegetable sold at a department store for each week.
Using the given data,calculate the value of mean absolute deviation.
A)2,444,136.45
B)1,563.37
C)1,341.46
D)14.78
The table below shows the sales details of a kind of vegetable sold at a department store for each week.
Using the given data,calculate the value of mean absolute deviation.
A)2,444,136.45
B)1,563.37
C)1,341.46
D)14.78
Unlock Deck
Unlock for access to all 100 flashcards in this deck.
Unlock Deck
k this deck
78
Use the data shown below to answer the following question(s).
The table below shows the sales details of a kind of vegetable sold at a department store for each week.
For the given data,the value of the root mean square error is ________.
A)2,444,136.45
B)1,563.37
C)1,341.46
D)14.78
The table below shows the sales details of a kind of vegetable sold at a department store for each week.
For the given data,the value of the root mean square error is ________.
A)2,444,136.45
B)1,563.37
C)1,341.46
D)14.78
Unlock Deck
Unlock for access to all 100 flashcards in this deck.
Unlock Deck
k this deck
79
A seasonal effect is one that repeats at fixed intervals of time,typically a year,month,week,or day.
Unlock Deck
Unlock for access to all 100 flashcards in this deck.
Unlock Deck
k this deck
80
In the Delphi method,the forecast is obtained through a comparative analysis with a previous situation.
Unlock Deck
Unlock for access to all 100 flashcards in this deck.
Unlock Deck
k this deck
Unlock Deck
Unlock for access to all 100 flashcards in this deck.


