Deck 6: Graphs
Full screen (f)
Question
The life expectancy E, in solar lifetimes, of certain stars depends on their mass M, in solar masses.The relationship is  . As mass increases, life expectancy decreases.What can you say about the rate of decrease? A graph of E versus M can help you answer this question.
A) Life expectancy decreases at a decreasing rate.
B) Life expectancy decreases at an increasing rate.
C) Life expectancy reaches a point of inflection.
D) None of the above.
. As mass increases, life expectancy decreases.What can you say about the rate of decrease? A graph of E versus M can help you answer this question.
A) Life expectancy decreases at a decreasing rate.
B) Life expectancy decreases at an increasing rate.
C) Life expectancy reaches a point of inflection.
D) None of the above.
Question
Question
For a satellite orbiting Earth, the time required to complete a single orbit is known as the period.The period P, in hours, is related to the distance D, in miles, from the center of Earth by the formula  . What happens to the distance as the period increases? A graph of D versus P can help you answer this question.
A) Distance increases as period increases.
B) Distance decreases as period increases.
C) Distance is at a maximum.
D) Concavity changes as the period increases.
. What happens to the distance as the period increases? A graph of D versus P can help you answer this question.
A) Distance increases as period increases.
B) Distance decreases as period increases.
C) Distance is at a maximum.
D) Concavity changes as the period increases.
Question
The height h, in centimeters, of a sunflower d days after the seed emerges is given by  . Use a graph to estimate the tallest the sunflower will ever be.
A) About 220.00 centimeters tall
B) About 11 centimeters tall
C) About 231.00 centimeters tall
D) About 221.40 centimeters tall
. Use a graph to estimate the tallest the sunflower will ever be.
A) About 220.00 centimeters tall
B) About 11 centimeters tall
C) About 231.00 centimeters tall
D) About 221.40 centimeters tall
Question
Which of the following is the graph of  on a horizontal span of 0 to 4.5?
A)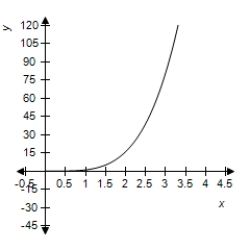
B)
C) 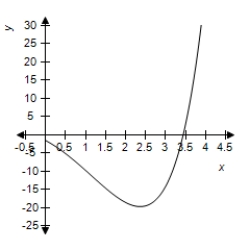
D)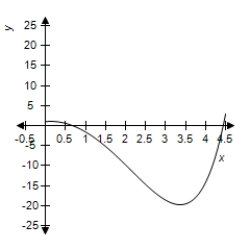
on a horizontal span of 0 to 4.5? A)
B)
C)
D)
Question
Question
The life expectancy E, in solar lifetimes, of certain stars depends on their mass M, in solar masses.The relationship is  . How does the life expectancy of larger stars compare with that of smaller stars? A graph of E versus M can help you answer this question.
A) Larger stars live 2.5 times as long as smaller stars.
B) Larger stars have longer life expectancy.
C) Larger stars have shorter life expectancy.
D) All of the above.
. How does the life expectancy of larger stars compare with that of smaller stars? A graph of E versus M can help you answer this question.
A) Larger stars live 2.5 times as long as smaller stars.
B) Larger stars have longer life expectancy.
C) Larger stars have shorter life expectancy.
D) All of the above.
Question
Question
The amount A, in grams, of a radioactive substance remaining after t years is given by  . What is the limiting value for the amount of the radioactive substance?
A) About 0.58 grams
B) About 12.00 grams
C) About 12.58 grams
D) 0 grams
. What is the limiting value for the amount of the radioactive substance?A) About 0.58 grams
B) About 12.00 grams
C) About 12.58 grams
D) 0 grams
Question
Which of the following is the graph of  on a horizontal span of 0 to 4.5?
A)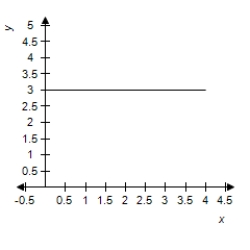
B)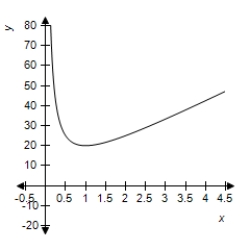
C)
D)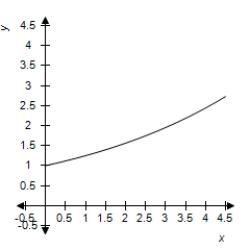
on a horizontal span of 0 to 4.5?A)
B)
C)
D)
Question
Question
The amount M of mercury, in milligrams per deciliter, in the blood of a man eating contaminated food is given by 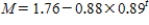 , where t is the time in months since observation began.What is the limiting value of mercury in the bloodstream?
A) About 0.88 milligrams per deciliter
B) About 1.76 milligrams per deciliter
C) About 0.89 milligrams per deciliter
D) About 2.08 milligrams per deciliter
, where t is the time in months since observation began.What is the limiting value of mercury in the bloodstream?A) About 0.88 milligrams per deciliter
B) About 1.76 milligrams per deciliter
C) About 0.89 milligrams per deciliter
D) About 2.08 milligrams per deciliter
Question
Question
Dye is being added to a liquid mixture.The amount A, in grams, of dye in the mixture after t minutes is given by 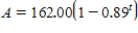 . What is the total amount of dye that is added to the solution?
A) About 152.49 grams
B) About 162.00 grams
C) About 0.89 grams
D) 156.11 grams
. What is the total amount of dye that is added to the solution?A) About 152.49 grams
B) About 162.00 grams
C) About 0.89 grams
D) 156.11 grams
Question
The concentration D of a drug, in milligrams per deciliter, in the blood t hours after an injection is given by 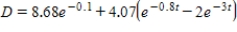 .What is the eventual concentration of the drug in the blood?
A) About 4.07 milligrams per deciliter
B) About 8.68 milligrams per deciliter
C) About 4.61 milligrams per deciliter
D) 0 milligrams per deciliter
.What is the eventual concentration of the drug in the blood?A) About 4.07 milligrams per deciliter
B) About 8.68 milligrams per deciliter
C) About 4.61 milligrams per deciliter
D) 0 milligrams per deciliter
Question
Question
When a car skids to a stop, the length L, in feet, of the skid marks is related to the speed S, in miles per hour, of the car by the equation  . As speed increases, so does the length of the skid marks.What can you say about the rate of increase? A graph of L versus S can help you answer this question.
A) Skid mark length increases more rapidly as speed increases.
B) Skid mark length increases rapidly at first but slows as speed increases.
C) Skid mark length increases at a decreasing rate.
D) None of the above.
. As speed increases, so does the length of the skid marks.What can you say about the rate of increase? A graph of L versus S can help you answer this question.
A) Skid mark length increases more rapidly as speed increases.
B) Skid mark length increases rapidly at first but slows as speed increases.
C) Skid mark length increases at a decreasing rate.
D) None of the above.
Question
The amount A of adrenaline, in nanograms per liter, in a man's bloodstream t minutes after he has been frightened is given by 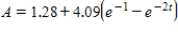 . What is the eventual amount of adrenaline in the bloodstream?
A) About 4.09 nanograms per liter
B) About 1.28 nanograms per liter
C) About 5.37 nanograms per liter
D) 0 nanograms per liter
. What is the eventual amount of adrenaline in the bloodstream?A) About 4.09 nanograms per liter
B) About 1.28 nanograms per liter
C) About 5.37 nanograms per liter
D) 0 nanograms per liter
Question
For a satellite orbiting Earth, the time required to complete a single orbit is known as the period.The period P, in hours, is related to the distance D, in miles, from the center of Earth by the formula  . As the period increases, so does the distance.What can you say about the rate of increase in distance as period increases? A graph of D versus P can help you answer this question.
A) Distance increases at an increasing rate as period increases.
B) Distance increases at a decreasing rate as period increases.
C) A point of inflection is reached.
D) None of the above.
. As the period increases, so does the distance.What can you say about the rate of increase in distance as period increases? A graph of D versus P can help you answer this question.
A) Distance increases at an increasing rate as period increases.
B) Distance increases at a decreasing rate as period increases.
C) A point of inflection is reached.
D) None of the above.
Question
Question
Make the graph of 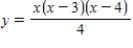 .Use a horizontal span of 0 to 5.
.Use a horizontal span of 0 to 5. Question
Make the graph of  .Use a horizontal span of 0 to 100.
.Use a horizontal span of 0 to 100. Question
Question
For a satellite orbiting Earth, the time required to complete a single orbit is known as the period.The period P, in hours, is related to the distance D, in miles, from the center of Earth by the formula  .
.
Does an increase in period have a greater effect on distance for a satellite with a longer period or for a satellite with a shorter period? A graph of D versus P can help you answer this question.
.Does an increase in period have a greater effect on distance for a satellite with a longer period or for a satellite with a shorter period? A graph of D versus P can help you answer this question.
Question
Make the graph of  .Use a horizontal span of 0 to 5.
.Use a horizontal span of 0 to 5. Question
Sales S, in thousands of dollars, t months after the beginning of the year are given by  .
.
The formula is valid over a 12-month period.Over what period were sales increasing? A graph of S versus t can help you answer this question.
A) From month 3 to the end of the year
B) From month 6 to the end of the year
C) Over the first 3 months
D) Over the first 6 months
. The formula is valid over a 12-month period.Over what period were sales increasing? A graph of S versus t can help you answer this question.
A) From month 3 to the end of the year
B) From month 6 to the end of the year
C) Over the first 3 months
D) Over the first 6 months
Question
Make the graph of  .Use a horizontal span of -5 to 5.
.Use a horizontal span of -5 to 5. Question
When a car skids to a stop, the length L, in feet, of the skid marks is related to the speed S, in miles per hour, of the car by the equation
 .
.
Does an increase in speed have a greater effect on the length of the skid marks for a car going slow or for a car going fast? A graph of L versus S can help you answer this question.
.Does an increase in speed have a greater effect on the length of the skid marks for a car going slow or for a car going fast? A graph of L versus S can help you answer this question.
Question
Question
Make the graph of 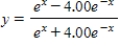 .Use a horizontal span of 0 to 5.
.Use a horizontal span of 0 to 5. Question
Make the graph of  .Use a horizontal span of 0 to 0.9.
.Use a horizontal span of 0 to 0.9. Question
Make the graph of  .Use a horizontal span of 0 to 10.
.Use a horizontal span of 0 to 10. Question
The population N, in thousands, of a certain city t years after 2000 is given by 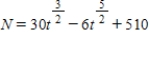 . The formula is valid over a 10-year period.Over what period was the population decreasing? A graph of N versus t can help you answer this question.
A) From 2003 to 2010
B) From 2004 to 2010
C) From 2000 to 2003
D) From 2000 to 2004
. The formula is valid over a 10-year period.Over what period was the population decreasing? A graph of N versus t can help you answer this question.A) From 2003 to 2010
B) From 2004 to 2010
C) From 2000 to 2003
D) From 2000 to 2004
Question
Make the graph of  .Use a horizontal span of 0 to 3.
.Use a horizontal span of 0 to 3. Question
The life expectancy E, in solar lifetimes, of certain stars depends on their mass M, in solar masses.The relationship is  .
.
Does an increase in mass have a greater effect on life expectancy for a larger star or a smaller star? A graph of E versus M can help you answer this question.
.Does an increase in mass have a greater effect on life expectancy for a larger star or a smaller star? A graph of E versus M can help you answer this question.
Question
Make the graph of  .Use a horizontal span of 0 to 5.
.Use a horizontal span of 0 to 5. Question
Make the graph of  .Use a horizontal span of 0 to 5.
.Use a horizontal span of 0 to 5.
Unlock Deck
Sign up to unlock the cards in this deck!
Unlock Deck
Unlock Deck
1/37
Play
Full screen (f)
Deck 6: Graphs
1
The life expectancy E, in solar lifetimes, of certain stars depends on their mass M, in solar masses.The relationship is . As mass increases, life expectancy decreases.What can you say about the rate of decrease? A graph of E versus M can help you answer this question.
A) Life expectancy decreases at a decreasing rate.
B) Life expectancy decreases at an increasing rate.
C) Life expectancy reaches a point of inflection.
D) None of the above.
. As mass increases, life expectancy decreases.What can you say about the rate of decrease? A graph of E versus M can help you answer this question.
A) Life expectancy decreases at a decreasing rate.
B) Life expectancy decreases at an increasing rate.
C) Life expectancy reaches a point of inflection.
D) None of the above.
Life expectancy decreases at a decreasing rate.
2
The graph of a function that is increasing at a decreasing rate is concave down.
True
3
For a satellite orbiting Earth, the time required to complete a single orbit is known as the period.The period P, in hours, is related to the distance D, in miles, from the center of Earth by the formula . What happens to the distance as the period increases? A graph of D versus P can help you answer this question.
A) Distance increases as period increases.
B) Distance decreases as period increases.
C) Distance is at a maximum.
D) Concavity changes as the period increases.
. What happens to the distance as the period increases? A graph of D versus P can help you answer this question.
A) Distance increases as period increases.
B) Distance decreases as period increases.
C) Distance is at a maximum.
D) Concavity changes as the period increases.
Distance increases as period increases.
4
The height h, in centimeters, of a sunflower d days after the seed emerges is given by . Use a graph to estimate the tallest the sunflower will ever be.
A) About 220.00 centimeters tall
B) About 11 centimeters tall
C) About 231.00 centimeters tall
D) About 221.40 centimeters tall
. Use a graph to estimate the tallest the sunflower will ever be.
A) About 220.00 centimeters tall
B) About 11 centimeters tall
C) About 231.00 centimeters tall
D) About 221.40 centimeters tall
Unlock Deck
Unlock for access to all 37 flashcards in this deck.
Unlock Deck
k this deck
5
Which of the following is the graph of on a horizontal span of 0 to 4.5?
A)
B)
C)
D)
on a horizontal span of 0 to 4.5? A)
B)
C)
D)
Unlock Deck
Unlock for access to all 37 flashcards in this deck.
Unlock Deck
k this deck
6
If we are given a horizontal span for the graph of a function, a table of values can help us choose a suitable vertical span for the graph.
Unlock Deck
Unlock for access to all 37 flashcards in this deck.
Unlock Deck
k this deck
7
The life expectancy E, in solar lifetimes, of certain stars depends on their mass M, in solar masses.The relationship is . How does the life expectancy of larger stars compare with that of smaller stars? A graph of E versus M can help you answer this question.
A) Larger stars live 2.5 times as long as smaller stars.
B) Larger stars have longer life expectancy.
C) Larger stars have shorter life expectancy.
D) All of the above.
. How does the life expectancy of larger stars compare with that of smaller stars? A graph of E versus M can help you answer this question.
A) Larger stars live 2.5 times as long as smaller stars.
B) Larger stars have longer life expectancy.
C) Larger stars have shorter life expectancy.
D) All of the above.
Unlock Deck
Unlock for access to all 37 flashcards in this deck.
Unlock Deck
k this deck
8
Concavity can be discerned from a table of values but not from a graph.
Unlock Deck
Unlock for access to all 37 flashcards in this deck.
Unlock Deck
k this deck
9
The amount A, in grams, of a radioactive substance remaining after t years is given by . What is the limiting value for the amount of the radioactive substance?
A) About 0.58 grams
B) About 12.00 grams
C) About 12.58 grams
D) 0 grams
. What is the limiting value for the amount of the radioactive substance?A) About 0.58 grams
B) About 12.00 grams
C) About 12.58 grams
D) 0 grams
Unlock Deck
Unlock for access to all 37 flashcards in this deck.
Unlock Deck
k this deck
10
Which of the following is the graph of on a horizontal span of 0 to 4.5?
A)
B)
C)
D)
on a horizontal span of 0 to 4.5?A)
B)
C)
D)
Unlock Deck
Unlock for access to all 37 flashcards in this deck.
Unlock Deck
k this deck
11
Inflection points often occur where the graph of a function is increasing most rapidly.
Unlock Deck
Unlock for access to all 37 flashcards in this deck.
Unlock Deck
k this deck
12
The amount M of mercury, in milligrams per deciliter, in the blood of a man eating contaminated food is given by , where t is the time in months since observation began.What is the limiting value of mercury in the bloodstream?
A) About 0.88 milligrams per deciliter
B) About 1.76 milligrams per deciliter
C) About 0.89 milligrams per deciliter
D) About 2.08 milligrams per deciliter
, where t is the time in months since observation began.What is the limiting value of mercury in the bloodstream?A) About 0.88 milligrams per deciliter
B) About 1.76 milligrams per deciliter
C) About 0.89 milligrams per deciliter
D) About 2.08 milligrams per deciliter
Unlock Deck
Unlock for access to all 37 flashcards in this deck.
Unlock Deck
k this deck
13
A graph can show where a function is increasing.
Unlock Deck
Unlock for access to all 37 flashcards in this deck.
Unlock Deck
k this deck
14
Dye is being added to a liquid mixture.The amount A, in grams, of dye in the mixture after t minutes is given by . What is the total amount of dye that is added to the solution?
A) About 152.49 grams
B) About 162.00 grams
C) About 0.89 grams
D) 156.11 grams
. What is the total amount of dye that is added to the solution?A) About 152.49 grams
B) About 162.00 grams
C) About 0.89 grams
D) 156.11 grams
Unlock Deck
Unlock for access to all 37 flashcards in this deck.
Unlock Deck
k this deck
15
The concentration D of a drug, in milligrams per deciliter, in the blood t hours after an injection is given by .What is the eventual concentration of the drug in the blood?
A) About 4.07 milligrams per deciliter
B) About 8.68 milligrams per deciliter
C) About 4.61 milligrams per deciliter
D) 0 milligrams per deciliter
.What is the eventual concentration of the drug in the blood?A) About 4.07 milligrams per deciliter
B) About 8.68 milligrams per deciliter
C) About 4.61 milligrams per deciliter
D) 0 milligrams per deciliter
Unlock Deck
Unlock for access to all 37 flashcards in this deck.
Unlock Deck
k this deck
16
A graph of a function that is decreasing at a decreasing rate is concave down.
Unlock Deck
Unlock for access to all 37 flashcards in this deck.
Unlock Deck
k this deck
17
When a car skids to a stop, the length L, in feet, of the skid marks is related to the speed S, in miles per hour, of the car by the equation . As speed increases, so does the length of the skid marks.What can you say about the rate of increase? A graph of L versus S can help you answer this question.
A) Skid mark length increases more rapidly as speed increases.
B) Skid mark length increases rapidly at first but slows as speed increases.
C) Skid mark length increases at a decreasing rate.
D) None of the above.
. As speed increases, so does the length of the skid marks.What can you say about the rate of increase? A graph of L versus S can help you answer this question.
A) Skid mark length increases more rapidly as speed increases.
B) Skid mark length increases rapidly at first but slows as speed increases.
C) Skid mark length increases at a decreasing rate.
D) None of the above.
Unlock Deck
Unlock for access to all 37 flashcards in this deck.
Unlock Deck
k this deck
18
The amount A of adrenaline, in nanograms per liter, in a man's bloodstream t minutes after he has been frightened is given by . What is the eventual amount of adrenaline in the bloodstream?
A) About 4.09 nanograms per liter
B) About 1.28 nanograms per liter
C) About 5.37 nanograms per liter
D) 0 nanograms per liter
. What is the eventual amount of adrenaline in the bloodstream?A) About 4.09 nanograms per liter
B) About 1.28 nanograms per liter
C) About 5.37 nanograms per liter
D) 0 nanograms per liter
Unlock Deck
Unlock for access to all 37 flashcards in this deck.
Unlock Deck
k this deck
19
For a satellite orbiting Earth, the time required to complete a single orbit is known as the period.The period P, in hours, is related to the distance D, in miles, from the center of Earth by the formula . As the period increases, so does the distance.What can you say about the rate of increase in distance as period increases? A graph of D versus P can help you answer this question.
A) Distance increases at an increasing rate as period increases.
B) Distance increases at a decreasing rate as period increases.
C) A point of inflection is reached.
D) None of the above.
. As the period increases, so does the distance.What can you say about the rate of increase in distance as period increases? A graph of D versus P can help you answer this question.
A) Distance increases at an increasing rate as period increases.
B) Distance increases at a decreasing rate as period increases.
C) A point of inflection is reached.
D) None of the above.
Unlock Deck
Unlock for access to all 37 flashcards in this deck.
Unlock Deck
k this deck
20
A graph of a function can show limiting values if they exist.
Unlock Deck
Unlock for access to all 37 flashcards in this deck.
Unlock Deck
k this deck
21
Make the graph of .Use a horizontal span of 0 to 5.
.Use a horizontal span of 0 to 5. Unlock Deck
Unlock for access to all 37 flashcards in this deck.
Unlock Deck
k this deck
22
Make the graph of .Use a horizontal span of 0 to 100.
.Use a horizontal span of 0 to 100. Unlock Deck
Unlock for access to all 37 flashcards in this deck.
Unlock Deck
k this deck
23
Sketch a graph that is decreasing and concave down.
Unlock Deck
Unlock for access to all 37 flashcards in this deck.
Unlock Deck
k this deck
24
For a satellite orbiting Earth, the time required to complete a single orbit is known as the period.The period P, in hours, is related to the distance D, in miles, from the center of Earth by the formula .
Does an increase in period have a greater effect on distance for a satellite with a longer period or for a satellite with a shorter period? A graph of D versus P can help you answer this question.
.Does an increase in period have a greater effect on distance for a satellite with a longer period or for a satellite with a shorter period? A graph of D versus P can help you answer this question.
Unlock Deck
Unlock for access to all 37 flashcards in this deck.
Unlock Deck
k this deck
25
Make the graph of .Use a horizontal span of 0 to 5.
.Use a horizontal span of 0 to 5. Unlock Deck
Unlock for access to all 37 flashcards in this deck.
Unlock Deck
k this deck
26
Sales S, in thousands of dollars, t months after the beginning of the year are given by .
The formula is valid over a 12-month period.Over what period were sales increasing? A graph of S versus t can help you answer this question.
A) From month 3 to the end of the year
B) From month 6 to the end of the year
C) Over the first 3 months
D) Over the first 6 months
. The formula is valid over a 12-month period.Over what period were sales increasing? A graph of S versus t can help you answer this question.
A) From month 3 to the end of the year
B) From month 6 to the end of the year
C) Over the first 3 months
D) Over the first 6 months
Unlock Deck
Unlock for access to all 37 flashcards in this deck.
Unlock Deck
k this deck
27
Make the graph of .Use a horizontal span of -5 to 5.
.Use a horizontal span of -5 to 5. Unlock Deck
Unlock for access to all 37 flashcards in this deck.
Unlock Deck
k this deck
28
When a car skids to a stop, the length L, in feet, of the skid marks is related to the speed S, in miles per hour, of the car by the equation
.
Does an increase in speed have a greater effect on the length of the skid marks for a car going slow or for a car going fast? A graph of L versus S can help you answer this question.
.Does an increase in speed have a greater effect on the length of the skid marks for a car going slow or for a car going fast? A graph of L versus S can help you answer this question.
Unlock Deck
Unlock for access to all 37 flashcards in this deck.
Unlock Deck
k this deck
29
Sketch a graph that is increasing and concave down.
Unlock Deck
Unlock for access to all 37 flashcards in this deck.
Unlock Deck
k this deck
30
Make the graph of .Use a horizontal span of 0 to 5.
.Use a horizontal span of 0 to 5. Unlock Deck
Unlock for access to all 37 flashcards in this deck.
Unlock Deck
k this deck
31
Make the graph of .Use a horizontal span of 0 to 0.9.
.Use a horizontal span of 0 to 0.9. Unlock Deck
Unlock for access to all 37 flashcards in this deck.
Unlock Deck
k this deck
32
Make the graph of .Use a horizontal span of 0 to 10.
.Use a horizontal span of 0 to 10. Unlock Deck
Unlock for access to all 37 flashcards in this deck.
Unlock Deck
k this deck
33
The population N, in thousands, of a certain city t years after 2000 is given by . The formula is valid over a 10-year period.Over what period was the population decreasing? A graph of N versus t can help you answer this question.
A) From 2003 to 2010
B) From 2004 to 2010
C) From 2000 to 2003
D) From 2000 to 2004
. The formula is valid over a 10-year period.Over what period was the population decreasing? A graph of N versus t can help you answer this question.A) From 2003 to 2010
B) From 2004 to 2010
C) From 2000 to 2003
D) From 2000 to 2004
Unlock Deck
Unlock for access to all 37 flashcards in this deck.
Unlock Deck
k this deck
34
Make the graph of .Use a horizontal span of 0 to 3.
.Use a horizontal span of 0 to 3. Unlock Deck
Unlock for access to all 37 flashcards in this deck.
Unlock Deck
k this deck
35
The life expectancy E, in solar lifetimes, of certain stars depends on their mass M, in solar masses.The relationship is .
Does an increase in mass have a greater effect on life expectancy for a larger star or a smaller star? A graph of E versus M can help you answer this question.
.Does an increase in mass have a greater effect on life expectancy for a larger star or a smaller star? A graph of E versus M can help you answer this question.
Unlock Deck
Unlock for access to all 37 flashcards in this deck.
Unlock Deck
k this deck
36
Make the graph of .Use a horizontal span of 0 to 5.
.Use a horizontal span of 0 to 5. Unlock Deck
Unlock for access to all 37 flashcards in this deck.
Unlock Deck
k this deck
37
Make the graph of .Use a horizontal span of 0 to 5.
.Use a horizontal span of 0 to 5. Unlock Deck
Unlock for access to all 37 flashcards in this deck.
Unlock Deck
k this deck
Unlock Deck
Unlock for access to all 37 flashcards in this deck.


