Exam 6: Graphs
Exam 1: Functions Given by Formulas38 Questions
Exam 2: Functions Given by TableChas13 Questions
Exam 3: Functions Given by Graphs38 Questions
Exam 4: Functions Given by Words26 Questions
Exam 5: Table and Trends34 Questions
Exam 6: Graphs37 Questions
Exam 7: Solving Linear Equations35 Questions
Exam 8: Solving Nonlinear Equations38 Questions
Exam 9: Inequalities39 Questions
Exam 10: Optimization36 Questions
Exam 11: The Geometry of Lines46 Questions
Exam 12: Linear Functions39 Questions
Exam 13: Modeling Data with Linear Functions8 Questions
Exam 14: Linear Regression5 Questions
Exam 15: Systems of Equations40 Questions
Exam 16: Exponential Growth and Decay41 Questions
Exam 17: Constant Percentage Change31 Questions
Exam 18: Modeling Exponential Data7 Questions
Exam 19: Modeling Nearly Exponential Data5 Questions
Exam 20: Logarithmic Functions41 Questions
Exam 21: Logistic Functions35 Questions
Exam 22: Power Functions41 Questions
Exam 23: Modeling Data with Power Functions4 Questions
Exam 24: Combining and Decomposing Functions36 Questions
Exam 25: Quadratic Functions24 Questions
Exam 26: Higher Degree Polynomials and Rational Functions27 Questions
Exam 27: Velocity49 Questions
Exam 28: Rates of Change for Other Functions40 Questions
Exam 29 Estimating Rates of Change27 Questions
Exam 30: Equations of Change Linear and Exponential Functions30 Questions
Exam 31: Equations of Change Graphical Solutions39 Questions
Select questions type
The life expectancy E, in solar lifetimes, of certain stars depends on their mass M, in solar masses.The relationship is  . How does the life expectancy of larger stars compare with that of smaller stars? A graph of E versus M can help you answer this question.
Free
(Multiple Choice)
4.9/5  (36)
(36)
Correct Answer: Verified
C
Make the graph of 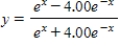 .Use a horizontal span of 0 to 5.
Free
(Essay)
4.8/5 (39)
Correct Answer:Verified
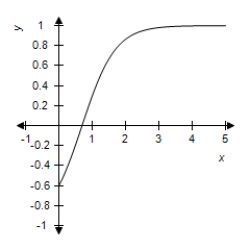
Make the graph of  .Use a horizontal span of 0 to 10.
Free
(Essay)
4.8/5 (31)
Correct Answer:Verified
For a satellite orbiting Earth, the time required to complete a single orbit is known as the period.The period P, in hours, is related to the distance D, in miles, from the center of Earth by the formula  . What happens to the distance as the period increases? A graph of D versus P can help you answer this question.
(Multiple Choice)
4.9/5 (23)
The amount A, in grams, of a radioactive substance remaining after t years is given by  . What is the limiting value for the amount of the radioactive substance?
(Multiple Choice)
4.9/5 (32)
The amount M of mercury, in milligrams per deciliter, in the blood of a man eating contaminated food is given by  , where t is the time in months since observation began.What is the limiting value of mercury in the bloodstream?
(Multiple Choice)
4.8/5 (39)
When a car skids to a stop, the length L, in feet, of the skid marks is related to the speed S, in miles per hour, of the car by the equation  . As speed increases, so does the length of the skid marks.What can you say about the rate of increase? A graph of L versus S can help you answer this question.
(Multiple Choice)
4.8/5 (33)
Concavity can be discerned from a table of values but not from a graph.
(True/False)
4.8/5 (35)
If we are given a horizontal span for the graph of a function, a table of values can help us choose a suitable vertical span for the graph.
(True/False)
4.9/5 (42)
Which of the following is the graph of  on a horizontal span of 0 to 4.5?
(Multiple Choice)
4.8/5 (34)
For a satellite orbiting Earth, the time required to complete a single orbit is known as the period.The period P, in hours, is related to the distance D, in miles, from the center of Earth by the formula  .
Does an increase in period have a greater effect on distance for a satellite with a longer period or for a satellite with a shorter period? A graph of D versus P can help you answer this question.
.
Does an increase in period have a greater effect on distance for a satellite with a longer period or for a satellite with a shorter period? A graph of D versus P can help you answer this question.
(Essay)
4.8/5 (38)
A graph of a function that is decreasing at a decreasing rate is concave down.
(True/False)
4.9/5 (36)
The concentration D of a drug, in milligrams per deciliter, in the blood t hours after an injection is given by  .What is the eventual concentration of the drug in the blood?
(Multiple Choice)
4.8/5 (28)
Filters
- Essay(0)
- Multiple Choice(0)
- Short Answer(0)
- True False(0)
- Matching(0)