Deck 2: Descriptive Statistics: Tabular and Graphical Displays
Full screen (f)
Question
Question
Question
Question
Question
Question
Question
Question
Question
Question
Question
Question
Question
Question
Question
Question
Question
Question
Question
Question
Question
Question
Question
Question
Question
Question
Question
Question
Exhibit 2-4
Michael's Compute-All, a national computer retailer, has kept a record of the number of laptop computers they have sold for a period of 80 days. Their sales records are shown below: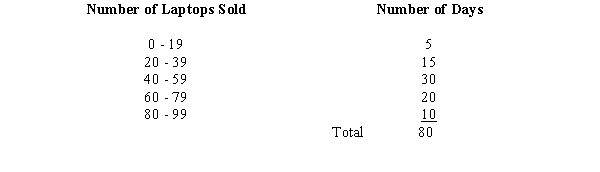
Refer to Exhibit 2-4. The class width of the above distribution is
A)0 to 100
B)20
C)80
D)5
Michael's Compute-All, a national computer retailer, has kept a record of the number of laptop computers they have sold for a period of 80 days. Their sales records are shown below:
Refer to Exhibit 2-4. The class width of the above distribution is
A)0 to 100
B)20
C)80
D)5
Question
Question
Exhibit 2-3
A survey of 800 college seniors resulted in the following crosstabulation regarding their undergraduate major and whether or not they plan to go to graduate school.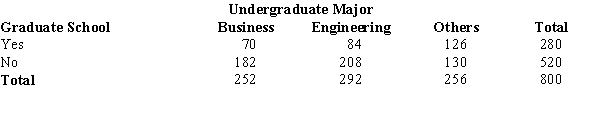
Refer to Exhibit 2-3. Of those students who are majoring in business, what percentage plans to go to graduate school?
A)27.78
B)8.75
C)70
D)72.22
Question
Question
Question
Exhibit 2-3
A survey of 800 college seniors resulted in the following crosstabulation regarding their undergraduate major and whether or not they plan to go to graduate school.
Refer to Exhibit 2-3. Among the students who plan to go to graduate school, what percentage indicated "Other" majors?
A)15.75
B)45
C)54
D)35
Question
Question
Exhibit 2-3
A survey of 800 college seniors resulted in the following crosstabulation regarding their undergraduate major and whether or not they plan to go to graduate school.
Refer to Exhibit 2-3. What percentage of the students does not plan to go to graduate school?
A)280
B)520
C)65
D)32
A survey of 800 college seniors resulted in the following crosstabulation regarding their undergraduate major and whether or not they plan to go to graduate school.
Refer to Exhibit 2-3. What percentage of the students does not plan to go to graduate school?
A)280
B)520
C)65
D)32
Question
Question
Question
Question
Question
Exhibit 2-3
A survey of 800 college seniors resulted in the following crosstabulation regarding their undergraduate major and whether or not they plan to go to graduate school.
Refer to Exhibit 2-3. What percentage of the students' undergraduate major is engineering?
A)292
B)520
C)65
D)36.5
A survey of 800 college seniors resulted in the following crosstabulation regarding their undergraduate major and whether or not they plan to go to graduate school.
Refer to Exhibit 2-3. What percentage of the students' undergraduate major is engineering?
A)292
B)520
C)65
D)36.5
Question
The frequency distribution below was constructed from data collected from a group of 25 students. 
a.Construct a relative frequency distribution.
b.Construct a cumulative frequency distribution.
c.Construct a cumulative relative frequency distribution.
a.Construct a relative frequency distribution.
b.Construct a cumulative frequency distribution.
c.Construct a cumulative relative frequency distribution.
Question
Exhibit 2-4
Michael's Compute-All, a national computer retailer, has kept a record of the number of laptop computers they have sold for a period of 80 days. Their sales records are shown below:
Refer to Exhibit 2-4. The number of days in which the company sold less than 60 laptops is
A)20
B)30
C)50
D)60
Michael's Compute-All, a national computer retailer, has kept a record of the number of laptop computers they have sold for a period of 80 days. Their sales records are shown below:
Refer to Exhibit 2-4. The number of days in which the company sold less than 60 laptops is
A)20
B)30
C)50
D)60
Question
Thirty students in the School of Business were asked what their majors were. The following represents their responses (M = Management; A = Accounting; E = Economics; O = Others). 
a.Construct a frequency distribution and a bar chart.
b.Construct a relative frequency distribution and a pie chart.
a.Construct a frequency distribution and a bar chart.
b.Construct a relative frequency distribution and a pie chart.
Question
Below you are given the examination scores of 20 students. 
a.Construct a frequency distribution for this data. Let the first class be 50 - 59.
b.Construct a cumulative frequency distribution.
c.Construct a relative frequency distribution.
d.Construct a cumulative relative frequency distribution.
a.Construct a frequency distribution for this data. Let the first class be 50 - 59.
b.Construct a cumulative frequency distribution.
c.Construct a relative frequency distribution.
d.Construct a cumulative relative frequency distribution.
Question
The following data shows the price of PAO, Inc. stock over the last 8 months. 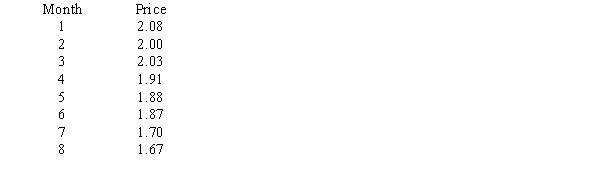
a.Develop a scatter diagram and draw a trend line through the points.
b.What kind of relationship exists between stock price and time (negative, positive, or no relation)?
a.Develop a scatter diagram and draw a trend line through the points.
b.What kind of relationship exists between stock price and time (negative, positive, or no relation)?
Question
Five hundred recent graduates indicated their majors as follows. 
a.Construct a relative frequency distribution.
b.Construct a percent frequency distribution.
a.Construct a relative frequency distribution.
b.Construct a percent frequency distribution.
Question
For the following observations, plot a scatter diagram and indicate what kind of relationship (if any) exist between x and y. 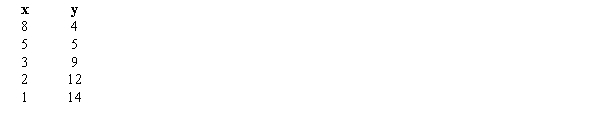
Question
Exhibit 2-4
Michael's Compute-All, a national computer retailer, has kept a record of the number of laptop computers they have sold for a period of 80 days. Their sales records are shown below:
Refer to Exhibit 2-4. If one develops a cumulative frequency distribution for the above data, the last class will have a frequency of
A)10
B)100
C)0 to 100
D)80
Question
The frequency distribution below was constructed from data collected on the quarts of soft drinks consumed per week by 20 students. 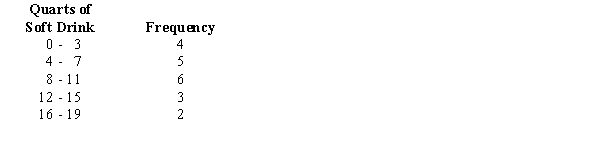
a.Construct a relative frequency distribution.
b.Construct a cumulative frequency distribution.
c.Construct a cumulative relative frequency distribution.
a.Construct a relative frequency distribution.
b.Construct a cumulative frequency distribution.
c.Construct a cumulative relative frequency distribution.
Question
Exhibit 2-4
Michael's Compute-All, a national computer retailer, has kept a record of the number of laptop computers they have sold for a period of 80 days. Their sales records are shown below:
Refer to Exhibit 2-4. The percentage of days in which the company sold at least 40 laptops is
A)37.5%
B)62.5%
C)90.0%
D)75.0%
Question
There are 800 students in the School of Business Administration. There are four majors in the School: Accounting, Finance, Management, and Marketing. The following shows the number of students in each major.  Develop a percent frequency distribution and construct a bar chart and a pie chart.
Develop a percent frequency distribution and construct a bar chart and a pie chart. Question
The ACT scores of a sample of business school students and their genders are shown below. 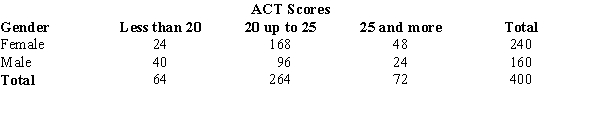
a.How many students scored less than 20?
b.How many students were female?
c.Of the male students, how many scored 25 or more?
d.Compute row percentages and comment on any relationship that may exist between ACT scores and gender of the individuals.
e.Compute column percentages.
a.How many students scored less than 20?
b.How many students were female?
c.Of the male students, how many scored 25 or more?
d.Compute row percentages and comment on any relationship that may exist between ACT scores and gender of the individuals.
e.Compute column percentages.
Question
Exhibit 2-4
Michael's Compute-All, a national computer retailer, has kept a record of the number of laptop computers they have sold for a period of 80 days. Their sales records are shown below:
Refer to Exhibit 2-4. The lower limit of the first class is
A)5
B)80
C)0
D)20
Michael's Compute-All, a national computer retailer, has kept a record of the number of laptop computers they have sold for a period of 80 days. Their sales records are shown below:
Refer to Exhibit 2-4. The lower limit of the first class is
A)5
B)80
C)0
D)20
Question
A sample of the ages of 10 employees of a company is shown below.  Construct a dot plot for the above data.
Construct a dot plot for the above data. Question
Forty shoppers were asked if they preferred the weight of a can of soup to be 6 ounces, 8 ounces, or 10 ounces. Below you are given their responses. 
a.Construct a frequency distribution and graphically represent the frequency distribution.
b.Construct a relative frequency distribution and graphically represent the relative frequency distribution.
a.Construct a frequency distribution and graphically represent the frequency distribution.
b.Construct a relative frequency distribution and graphically represent the relative frequency distribution.
Question
A student has completed 20 courses in the School of Arts and Sciences. Her grades in the 20 courses are shown below. 
a.Develop a frequency distribution and a bar chart for her grades.
b.Develop a relative frequency distribution for her grades and construct a pie chart.
a.Develop a frequency distribution and a bar chart for her grades.
b.Develop a relative frequency distribution for her grades and construct a pie chart.
Question
You are given the following data on the ages of employees at a company. Construct a stem-and-leaf display. 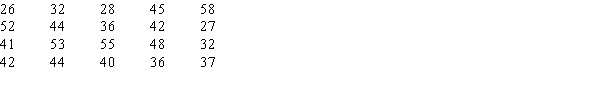
Question
For the following observations, plot a scatter diagram and indicate what kind of relationship (if any) exist between x and y. 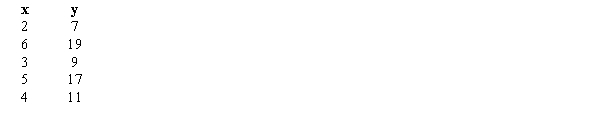
Question
A sample of 50 TV viewers were asked, "Should TV sponsors pull their sponsorship from programs that draw numerous viewer complaints?" Below are the results of the survey. (Y = Yes; N = No; W = Without Opinion) 
a.Construct a frequency distribution and a bar chart.
b.Construct a relative frequency distribution and a pie chart.
a.Construct a frequency distribution and a bar chart.
b.Construct a relative frequency distribution and a pie chart.
Question
Construct a stem-and-leaf display for the following data. 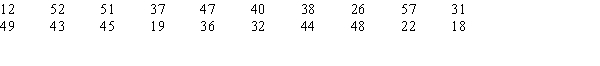
Question
A survey of 400 college seniors resulted in the following crosstabulation regarding their undergraduate major and whether or not they plan to go to graduate school. 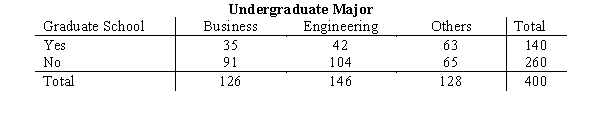
a.Are a majority of the seniors in the survey planning to attend graduate school?
b.Which discipline constitutes the majority of the individuals in the survey?
c.Compute row percentages and comment on the relationship between the students' undergraduate major and their intention of attending graduate school.
d.Compute the column percentages and comment on the relationship between the students' intention of going to graduate school and their undergraduate major.
Question
The following data set shows the number of hours of sick leave that some of the employees of Bastien's, Inc. have taken during the first quarter of the year (rounded to the nearest hour). 
a.Develop a frequency distribution for the above data. (Let the width of your classes be 10 units and start your first class as 10 - 19.)
b.Develop a relative frequency distribution and a percent frequency distribution for the data.
c.Develop a cumulative frequency distribution.
d.How many employees have taken less than 40 hours of sick leave?

Unlock Deck
Sign up to unlock the cards in this deck!
Unlock Deck
Unlock Deck
1/62
Play
Full screen (f)
Deck 2: Descriptive Statistics: Tabular and Graphical Displays
1
In constructing a frequency distribution, the approximate class width is computed as
A)(largest data value - smallest data value)/number of classes
B)(largest data value - smallest data value)/sample size
C)(smallest data value - largest data value)/sample size
D)largest data value/number of classes
A)(largest data value - smallest data value)/number of classes
B)(largest data value - smallest data value)/sample size
C)(smallest data value - largest data value)/sample size
D)largest data value/number of classes
(largest data value - smallest data value)/number of classes
2
The sum of the relative frequencies for all classes will always equal
A)the sample size
B)the number of classes
C)one
D)any value larger than one
A)the sample size
B)the number of classes
C)one
D)any value larger than one
one
3
A cumulative relative frequency distribution shows
A)the proportion of data items with values less than or equal to the upper limit of each class
B)the proportion of data items with values less than or equal to the lower limit of each class
C)the percentage of data items with values less than or equal to the upper limit of each class
D)the percentage of data items with values less than or equal to the lower limit of each class
the proportion of data items with values less than or equal to the upper limit of each class
4
The relative frequency of a class is computed by
A)dividing the cumulative frequency of the class by n
B)dividing n by cumulative frequency of the class
C)dividing the frequency of the class by n
D)dividing the frequency of the class by the number of classes
A)dividing the cumulative frequency of the class by n
B)dividing n by cumulative frequency of the class
C)dividing the frequency of the class by n
D)dividing the frequency of the class by the number of classes
Unlock Deck
Unlock for access to all 62 flashcards in this deck.
Unlock Deck
k this deck
5
A researcher is gathering data from four geographical areas designated: South = 1; North = 2; East = 3; West = 4. The designated geographical regions represent
A)categorical data
B)quantitative data
C)label data
D)either quantitative or categorical data
A)categorical data
B)quantitative data
C)label data
D)either quantitative or categorical data
Unlock Deck
Unlock for access to all 62 flashcards in this deck.
Unlock Deck
k this deck
6
Fifteen percent of the students in a school of Business Administration are majoring in Economics, 20% in Finance, 35% in Management, and 30% in Accounting. The graphical device(s) which can be used to present these data is (are)
A)a line chart
B)only a bar chart
C)only a pie chart
D)both a bar chart and a pie chart
A)a line chart
B)only a bar chart
C)only a pie chart
D)both a bar chart and a pie chart
Unlock Deck
Unlock for access to all 62 flashcards in this deck.
Unlock Deck
k this deck
7
The percent frequency of a class is computed by
A)multiplying the relative frequency by 10
B)dividing the relative frequency by 100
C)multiplying the relative frequency by 100
D)adding 100 to the relative frequency
A)multiplying the relative frequency by 10
B)dividing the relative frequency by 100
C)multiplying the relative frequency by 100
D)adding 100 to the relative frequency
Unlock Deck
Unlock for access to all 62 flashcards in this deck.
Unlock Deck
k this deck
8
The difference between the lower class limits of adjacent classes provides the
A)number of classes
B)class limits
C)class midpoint
D)class width
A)number of classes
B)class limits
C)class midpoint
D)class width
Unlock Deck
Unlock for access to all 62 flashcards in this deck.
Unlock Deck
k this deck
9
In a cumulative frequency distribution, the last class will always have a cumulative frequency equal to
A)one
B)100%
C)the total number of elements in the data set
D)None of these alternatives is correct.
A)one
B)100%
C)the total number of elements in the data set
D)None of these alternatives is correct.
Unlock Deck
Unlock for access to all 62 flashcards in this deck.
Unlock Deck
k this deck
10
The relative frequency of a class is computed by
A)dividing the midpoint of the class by the sample size
B)dividing the frequency of the class by the midpoint
C)dividing the sample size by the frequency of the class
D)dividing the frequency of the class by the sample size
A)dividing the midpoint of the class by the sample size
B)dividing the frequency of the class by the midpoint
C)dividing the sample size by the frequency of the class
D)dividing the frequency of the class by the sample size
Unlock Deck
Unlock for access to all 62 flashcards in this deck.
Unlock Deck
k this deck
11
The total number of data items with a value less than the upper limit for the class is given by the
A)frequency distribution
B)relative frequency distribution
C)cumulative frequency distribution
D)cumulative relative frequency distribution
A)frequency distribution
B)relative frequency distribution
C)cumulative frequency distribution
D)cumulative relative frequency distribution
Unlock Deck
Unlock for access to all 62 flashcards in this deck.
Unlock Deck
k this deck
12
A frequency distribution is
A)a tabular summary of a set of data showing the relative frequency
B)a graphical form of representing data
C)a tabular summary of a set of data showing the frequency of items in each of several nonoverlapping classes
D)a graphical device for presenting categorical data
A)a tabular summary of a set of data showing the relative frequency
B)a graphical form of representing data
C)a tabular summary of a set of data showing the frequency of items in each of several nonoverlapping classes
D)a graphical device for presenting categorical data
Unlock Deck
Unlock for access to all 62 flashcards in this deck.
Unlock Deck
k this deck
13
The sum of the percent frequencies for all classes will always equal
A)one
B)the number of classes
C)the number of items in the study
D)100
A)one
B)the number of classes
C)the number of items in the study
D)100
Unlock Deck
Unlock for access to all 62 flashcards in this deck.
Unlock Deck
k this deck
14
If several frequency distributions are constructed from the same data set, the distribution with the widest class width will have the
A)fewest classes
B)most classes
C)same number of classes as the other distributions since all are constructed from the same data
A)fewest classes
B)most classes
C)same number of classes as the other distributions since all are constructed from the same data
Unlock Deck
Unlock for access to all 62 flashcards in this deck.
Unlock Deck
k this deck
15
A tabular summary of a set of data showing the fraction of the total number of items in several classes is a
A)frequency distribution
B)relative frequency distribution
C)frequency
D)cumulative frequency distribution
A)frequency distribution
B)relative frequency distribution
C)frequency
D)cumulative frequency distribution
Unlock Deck
Unlock for access to all 62 flashcards in this deck.
Unlock Deck
k this deck
16
The most common graphical presentation of quantitative data is a
A)histogram
B)bar chart
C)relative frequency
D)pie chart
A)histogram
B)bar chart
C)relative frequency
D)pie chart
Unlock Deck
Unlock for access to all 62 flashcards in this deck.
Unlock Deck
k this deck
17
A frequency distribution is a tabular summary of data showing the
A)fraction of items in several classes
B)percentage of items in several classes
C)relative percentage of items in several classes
D)number of items in several classes
A)fraction of items in several classes
B)percentage of items in several classes
C)relative percentage of items in several classes
D)number of items in several classes
Unlock Deck
Unlock for access to all 62 flashcards in this deck.
Unlock Deck
k this deck
18
Categorical data can be graphically represented by using a(n)
A)histogram
B)frequency polygon
C)ogive
D)bar chart
A)histogram
B)frequency polygon
C)ogive
D)bar chart
Unlock Deck
Unlock for access to all 62 flashcards in this deck.
Unlock Deck
k this deck
19
The sum of frequencies for all classes will always equal
A)1
B)the number of elements in a data set
C)the number of classes
D)a value between 0 and 1
A)1
B)the number of elements in a data set
C)the number of classes
D)a value between 0 and 1
Unlock Deck
Unlock for access to all 62 flashcards in this deck.
Unlock Deck
k this deck
20
In constructing a frequency distribution, as the number of classes are decreased, the class width
A)decreases
B)remains unchanged
C)increases
D)can increase or decrease depending on the data values
A)decreases
B)remains unchanged
C)increases
D)can increase or decrease depending on the data values
Unlock Deck
Unlock for access to all 62 flashcards in this deck.
Unlock Deck
k this deck
21
When a histogram has a longer tail to the right, it is said to be
A)symmetrical
B)skewed to the left
C)skewed to the right
D)none of these alternatives is correct
A)symmetrical
B)skewed to the left
C)skewed to the right
D)none of these alternatives is correct
Unlock Deck
Unlock for access to all 62 flashcards in this deck.
Unlock Deck
k this deck
22
The ___ can be used to show the rank order and shape of a data set simultaneously.
A)ogive
B)pie chart
C)stem-and-leaf display
D)bar chart
A)ogive
B)pie chart
C)stem-and-leaf display
D)bar chart
Unlock Deck
Unlock for access to all 62 flashcards in this deck.
Unlock Deck
k this deck
23
Which of the following is a graphical summary of a set of data in which each data value is represented by a dot above the axis?
A)histogram
B)box plot
C)dot plot
D)crosstabulation
A)histogram
B)box plot
C)dot plot
D)crosstabulation
Unlock Deck
Unlock for access to all 62 flashcards in this deck.
Unlock Deck
k this deck
24
The reversal of conclusions based on aggregate and unaggregated data is called:
A)Simpson's paradox
B)Trim's paradox
C)Poisson dilemma
D)Simon's paradox
A)Simpson's paradox
B)Trim's paradox
C)Poisson dilemma
D)Simon's paradox
Unlock Deck
Unlock for access to all 62 flashcards in this deck.
Unlock Deck
k this deck
25
A histogram is
A)a graphical presentation of a frequency or relative frequency distribution
B)a graphical method of presenting a cumulative frequency or a cumulative relative frequency distribution
C)the history of data elements
D)the same as a pie chart
A)a graphical presentation of a frequency or relative frequency distribution
B)a graphical method of presenting a cumulative frequency or a cumulative relative frequency distribution
C)the history of data elements
D)the same as a pie chart
Unlock Deck
Unlock for access to all 62 flashcards in this deck.
Unlock Deck
k this deck
26
A situation in which conclusions based upon aggregated crosstabulation are different from unaggregated crosstabulation is known as
A)wrong crosstabulation
B)Simpson's rule
C)Simpson's paradox
D)aggregated crosstabulation
A)wrong crosstabulation
B)Simpson's rule
C)Simpson's paradox
D)aggregated crosstabulation
Unlock Deck
Unlock for access to all 62 flashcards in this deck.
Unlock Deck
k this deck
27
Which of the following graphical methods shows the relationship between two variables?
A)pie chart
B)ogive
C)crosstabulation
D)dot plot
A)pie chart
B)ogive
C)crosstabulation
D)dot plot
Unlock Deck
Unlock for access to all 62 flashcards in this deck.
Unlock Deck
k this deck
28
Exhibit 2-4
Michael's Compute-All, a national computer retailer, has kept a record of the number of laptop computers they have sold for a period of 80 days. Their sales records are shown below:
Refer to Exhibit 2-4. The class width of the above distribution is
A)0 to 100
B)20
C)80
D)5
Michael's Compute-All, a national computer retailer, has kept a record of the number of laptop computers they have sold for a period of 80 days. Their sales records are shown below:
Refer to Exhibit 2-4. The class width of the above distribution is
A)0 to 100
B)20
C)80
D)5
Unlock Deck
Unlock for access to all 62 flashcards in this deck.
Unlock Deck
k this deck
29
A graphical presentation of the relationship between two variables is
A)an ogive
B)a histogram
C)either an ogive or a histogram, depending on the type of data
D)a scatter diagram
A)an ogive
B)a histogram
C)either an ogive or a histogram, depending on the type of data
D)a scatter diagram
Unlock Deck
Unlock for access to all 62 flashcards in this deck.
Unlock Deck
k this deck
30
Exhibit 2-3
A survey of 800 college seniors resulted in the following crosstabulation regarding their undergraduate major and whether or not they plan to go to graduate school.
Refer to Exhibit 2-3. Of those students who are majoring in business, what percentage plans to go to graduate school?
A)27.78
B)8.75
C)70
D)72.22
Unlock Deck
Unlock for access to all 62 flashcards in this deck.
Unlock Deck
k this deck
31
In a cumulative percent frequency distribution, the last class will have a cumulative percent frequency equal to
A)one
B)100
C)the total number of elements in the data set
D)None of these alternatives is correct.
A)one
B)100
C)the total number of elements in the data set
D)None of these alternatives is correct.
Unlock Deck
Unlock for access to all 62 flashcards in this deck.
Unlock Deck
k this deck
32
A histogram is said to be skewed to the left if it has a
A)longer tail to the right
B)shorter tail to the right
C)shorter tail to the left
D)longer tail to the left
A)longer tail to the right
B)shorter tail to the right
C)shorter tail to the left
D)longer tail to the left
Unlock Deck
Unlock for access to all 62 flashcards in this deck.
Unlock Deck
k this deck
33
Exhibit 2-3
A survey of 800 college seniors resulted in the following crosstabulation regarding their undergraduate major and whether or not they plan to go to graduate school.
Refer to Exhibit 2-3. Among the students who plan to go to graduate school, what percentage indicated "Other" majors?
A)15.75
B)45
C)54
D)35
Unlock Deck
Unlock for access to all 62 flashcards in this deck.
Unlock Deck
k this deck
34
An Ogive is constructed by plotting a point corresponding to the ___ frequency of each class.
A)relative
B)cumulative
C)percent
D)octave
A)relative
B)cumulative
C)percent
D)octave
Unlock Deck
Unlock for access to all 62 flashcards in this deck.
Unlock Deck
k this deck
35
Exhibit 2-3
A survey of 800 college seniors resulted in the following crosstabulation regarding their undergraduate major and whether or not they plan to go to graduate school.
Refer to Exhibit 2-3. What percentage of the students does not plan to go to graduate school?
A)280
B)520
C)65
D)32
A survey of 800 college seniors resulted in the following crosstabulation regarding their undergraduate major and whether or not they plan to go to graduate school.
Refer to Exhibit 2-3. What percentage of the students does not plan to go to graduate school?
A)280
B)520
C)65
D)32
Unlock Deck
Unlock for access to all 62 flashcards in this deck.
Unlock Deck
k this deck
36
Data that provide labels or names for categories of like items are known as
A)categorical data
B)quantitative data
C)label data
D)category data
A)categorical data
B)quantitative data
C)label data
D)category data
Unlock Deck
Unlock for access to all 62 flashcards in this deck.
Unlock Deck
k this deck
37
In a cumulative relative frequency distribution, the last class will have a cumulative relative frequency equal to
A)one
B)zero
C)the total number of elements in the data set
D)None of these alternatives is correct.
A)one
B)zero
C)the total number of elements in the data set
D)None of these alternatives is correct.
Unlock Deck
Unlock for access to all 62 flashcards in this deck.
Unlock Deck
k this deck
38
In a scatter diagram, a line that provides an approximation of the relationship between the variables is known as
A)approximation line
B)trend line
C)line of zero intercept
D)line of zero slope
A)approximation line
B)trend line
C)line of zero intercept
D)line of zero slope
Unlock Deck
Unlock for access to all 62 flashcards in this deck.
Unlock Deck
k this deck
39
A tabular method that can be used to summarize the data on two variables simultaneously is called
A)simultaneous equations
B)crosstabulation
C)a histogram
D)an ogive
A)simultaneous equations
B)crosstabulation
C)a histogram
D)an ogive
Unlock Deck
Unlock for access to all 62 flashcards in this deck.
Unlock Deck
k this deck
40
Exhibit 2-3
A survey of 800 college seniors resulted in the following crosstabulation regarding their undergraduate major and whether or not they plan to go to graduate school.
Refer to Exhibit 2-3. What percentage of the students' undergraduate major is engineering?
A)292
B)520
C)65
D)36.5
A survey of 800 college seniors resulted in the following crosstabulation regarding their undergraduate major and whether or not they plan to go to graduate school.
Refer to Exhibit 2-3. What percentage of the students' undergraduate major is engineering?
A)292
B)520
C)65
D)36.5
Unlock Deck
Unlock for access to all 62 flashcards in this deck.
Unlock Deck
k this deck
41
The frequency distribution below was constructed from data collected from a group of 25 students.
a.Construct a relative frequency distribution.
b.Construct a cumulative frequency distribution.
c.Construct a cumulative relative frequency distribution.
a.Construct a relative frequency distribution.
b.Construct a cumulative frequency distribution.
c.Construct a cumulative relative frequency distribution.
Unlock Deck
Unlock for access to all 62 flashcards in this deck.
Unlock Deck
k this deck
42
Exhibit 2-4
Michael's Compute-All, a national computer retailer, has kept a record of the number of laptop computers they have sold for a period of 80 days. Their sales records are shown below:
Refer to Exhibit 2-4. The number of days in which the company sold less than 60 laptops is
A)20
B)30
C)50
D)60
Michael's Compute-All, a national computer retailer, has kept a record of the number of laptop computers they have sold for a period of 80 days. Their sales records are shown below:
Refer to Exhibit 2-4. The number of days in which the company sold less than 60 laptops is
A)20
B)30
C)50
D)60
Unlock Deck
Unlock for access to all 62 flashcards in this deck.
Unlock Deck
k this deck
43
Thirty students in the School of Business were asked what their majors were. The following represents their responses (M = Management; A = Accounting; E = Economics; O = Others).
a.Construct a frequency distribution and a bar chart.
b.Construct a relative frequency distribution and a pie chart.
a.Construct a frequency distribution and a bar chart.
b.Construct a relative frequency distribution and a pie chart.
Unlock Deck
Unlock for access to all 62 flashcards in this deck.
Unlock Deck
k this deck
44
Below you are given the examination scores of 20 students.
a.Construct a frequency distribution for this data. Let the first class be 50 - 59.
b.Construct a cumulative frequency distribution.
c.Construct a relative frequency distribution.
d.Construct a cumulative relative frequency distribution.
a.Construct a frequency distribution for this data. Let the first class be 50 - 59.
b.Construct a cumulative frequency distribution.
c.Construct a relative frequency distribution.
d.Construct a cumulative relative frequency distribution.
Unlock Deck
Unlock for access to all 62 flashcards in this deck.
Unlock Deck
k this deck
45
The following data shows the price of PAO, Inc. stock over the last 8 months.
a.Develop a scatter diagram and draw a trend line through the points.
b.What kind of relationship exists between stock price and time (negative, positive, or no relation)?
a.Develop a scatter diagram and draw a trend line through the points.
b.What kind of relationship exists between stock price and time (negative, positive, or no relation)?
Unlock Deck
Unlock for access to all 62 flashcards in this deck.
Unlock Deck
k this deck
46
Five hundred recent graduates indicated their majors as follows.
a.Construct a relative frequency distribution.
b.Construct a percent frequency distribution.
a.Construct a relative frequency distribution.
b.Construct a percent frequency distribution.
Unlock Deck
Unlock for access to all 62 flashcards in this deck.
Unlock Deck
k this deck
47
For the following observations, plot a scatter diagram and indicate what kind of relationship (if any) exist between x and y.
Unlock Deck
Unlock for access to all 62 flashcards in this deck.
Unlock Deck
k this deck
48
Exhibit 2-4
Michael's Compute-All, a national computer retailer, has kept a record of the number of laptop computers they have sold for a period of 80 days. Their sales records are shown below:
Refer to Exhibit 2-4. If one develops a cumulative frequency distribution for the above data, the last class will have a frequency of
A)10
B)100
C)0 to 100
D)80
Unlock Deck
Unlock for access to all 62 flashcards in this deck.
Unlock Deck
k this deck
49
The frequency distribution below was constructed from data collected on the quarts of soft drinks consumed per week by 20 students.
a.Construct a relative frequency distribution.
b.Construct a cumulative frequency distribution.
c.Construct a cumulative relative frequency distribution.
a.Construct a relative frequency distribution.
b.Construct a cumulative frequency distribution.
c.Construct a cumulative relative frequency distribution.
Unlock Deck
Unlock for access to all 62 flashcards in this deck.
Unlock Deck
k this deck
50
Exhibit 2-4
Michael's Compute-All, a national computer retailer, has kept a record of the number of laptop computers they have sold for a period of 80 days. Their sales records are shown below:
Refer to Exhibit 2-4. The percentage of days in which the company sold at least 40 laptops is
A)37.5%
B)62.5%
C)90.0%
D)75.0%
Unlock Deck
Unlock for access to all 62 flashcards in this deck.
Unlock Deck
k this deck
51
There are 800 students in the School of Business Administration. There are four majors in the School: Accounting, Finance, Management, and Marketing. The following shows the number of students in each major. Develop a percent frequency distribution and construct a bar chart and a pie chart.
Develop a percent frequency distribution and construct a bar chart and a pie chart. Unlock Deck
Unlock for access to all 62 flashcards in this deck.
Unlock Deck
k this deck
52
The ACT scores of a sample of business school students and their genders are shown below.
a.How many students scored less than 20?
b.How many students were female?
c.Of the male students, how many scored 25 or more?
d.Compute row percentages and comment on any relationship that may exist between ACT scores and gender of the individuals.
e.Compute column percentages.
a.How many students scored less than 20?
b.How many students were female?
c.Of the male students, how many scored 25 or more?
d.Compute row percentages and comment on any relationship that may exist between ACT scores and gender of the individuals.
e.Compute column percentages.
Unlock Deck
Unlock for access to all 62 flashcards in this deck.
Unlock Deck
k this deck
53
Exhibit 2-4
Michael's Compute-All, a national computer retailer, has kept a record of the number of laptop computers they have sold for a period of 80 days. Their sales records are shown below:
Refer to Exhibit 2-4. The lower limit of the first class is
A)5
B)80
C)0
D)20
Michael's Compute-All, a national computer retailer, has kept a record of the number of laptop computers they have sold for a period of 80 days. Their sales records are shown below:
Refer to Exhibit 2-4. The lower limit of the first class is
A)5
B)80
C)0
D)20
Unlock Deck
Unlock for access to all 62 flashcards in this deck.
Unlock Deck
k this deck
54
A sample of the ages of 10 employees of a company is shown below. Construct a dot plot for the above data.
Construct a dot plot for the above data. Unlock Deck
Unlock for access to all 62 flashcards in this deck.
Unlock Deck
k this deck
55
Forty shoppers were asked if they preferred the weight of a can of soup to be 6 ounces, 8 ounces, or 10 ounces. Below you are given their responses.
a.Construct a frequency distribution and graphically represent the frequency distribution.
b.Construct a relative frequency distribution and graphically represent the relative frequency distribution.
a.Construct a frequency distribution and graphically represent the frequency distribution.
b.Construct a relative frequency distribution and graphically represent the relative frequency distribution.
Unlock Deck
Unlock for access to all 62 flashcards in this deck.
Unlock Deck
k this deck
56
A student has completed 20 courses in the School of Arts and Sciences. Her grades in the 20 courses are shown below.
a.Develop a frequency distribution and a bar chart for her grades.
b.Develop a relative frequency distribution for her grades and construct a pie chart.
a.Develop a frequency distribution and a bar chart for her grades.
b.Develop a relative frequency distribution for her grades and construct a pie chart.
Unlock Deck
Unlock for access to all 62 flashcards in this deck.
Unlock Deck
k this deck
57
You are given the following data on the ages of employees at a company. Construct a stem-and-leaf display.
Unlock Deck
Unlock for access to all 62 flashcards in this deck.
Unlock Deck
k this deck
58
For the following observations, plot a scatter diagram and indicate what kind of relationship (if any) exist between x and y.
Unlock Deck
Unlock for access to all 62 flashcards in this deck.
Unlock Deck
k this deck
59
A sample of 50 TV viewers were asked, "Should TV sponsors pull their sponsorship from programs that draw numerous viewer complaints?" Below are the results of the survey. (Y = Yes; N = No; W = Without Opinion)
a.Construct a frequency distribution and a bar chart.
b.Construct a relative frequency distribution and a pie chart.
a.Construct a frequency distribution and a bar chart.
b.Construct a relative frequency distribution and a pie chart.
Unlock Deck
Unlock for access to all 62 flashcards in this deck.
Unlock Deck
k this deck
60
Construct a stem-and-leaf display for the following data.
Unlock Deck
Unlock for access to all 62 flashcards in this deck.
Unlock Deck
k this deck
61
A survey of 400 college seniors resulted in the following crosstabulation regarding their undergraduate major and whether or not they plan to go to graduate school.
a.Are a majority of the seniors in the survey planning to attend graduate school?
b.Which discipline constitutes the majority of the individuals in the survey?
c.Compute row percentages and comment on the relationship between the students' undergraduate major and their intention of attending graduate school.
d.Compute the column percentages and comment on the relationship between the students' intention of going to graduate school and their undergraduate major.
Unlock Deck
Unlock for access to all 62 flashcards in this deck.
Unlock Deck
k this deck
62
The following data set shows the number of hours of sick leave that some of the employees of Bastien's, Inc. have taken during the first quarter of the year (rounded to the nearest hour).
a.Develop a frequency distribution for the above data. (Let the width of your classes be 10 units and start your first class as 10 - 19.)
b.Develop a relative frequency distribution and a percent frequency distribution for the data.
c.Develop a cumulative frequency distribution.
d.How many employees have taken less than 40 hours of sick leave?
Unlock Deck
Unlock for access to all 62 flashcards in this deck.
Unlock Deck
k this deck
Unlock Deck
Unlock for access to all 62 flashcards in this deck.


