Exam 2: Descriptive Statistics: Tabular and Graphical Displays
Exam 1: Data and Statistics98 Questions
Exam 2: Descriptive Statistics: Tabular and Graphical Displays62 Questions
Exam 3: Descriptive Statistics: Numerical Measures173 Questions
Exam 4: Introduction to Probability138 Questions
Exam 5: Discrete Probability Distributions123 Questions
Exam 6: Continuous Probability Distributions174 Questions
Exam 7: Sampling and Sampling Distributions133 Questions
Exam 8: Interval Estimation137 Questions
Exam 9: Hypothesis Tests148 Questions
Exam 10: Inference About Means and Proportions With Two Populations121 Questions
Exam 11: Inferences About Population Variances90 Questions
Exam 12: Comparing Multiple Proportions, Test of Independence and Goodness of Fit90 Questions
Exam 13: Experimental Design and Analysis of Variance115 Questions
Exam 14: Simple Linear Regression146 Questions
Exam 15: Multiple Regression115 Questions
Exam 16: Regression Analysis: Model Building76 Questions
Exam 17: Time Series Analysis and Forecasting68 Questions
Exam 18: Nonparametric Methods81 Questions
Exam 19: Statistical Methods for Quality Control29 Questions
Exam 20: Index Numbers52 Questions
Exam 21: Decision Analysis on Website65 Questions
Exam 22: Sample Survey on Website63 Questions
Select questions type
A cumulative relative frequency distribution shows
Free
(Multiple Choice)
4.8/5  (34)
(34)
Correct Answer: Verified
A
The total number of data items with a value less than the upper limit for the class is given by the
Free
(Multiple Choice)
4.7/5 (37)
Correct Answer:Verified
C
The relative frequency of a class is computed by
Free
(Multiple Choice)
4.9/5 (23)
Correct Answer:Verified
C
A frequency distribution is a tabular summary of data showing the
(Multiple Choice)
4.7/5 (31)
A tabular summary of a set of data showing the fraction of the total number of items in several classes is a
(Multiple Choice)
4.8/5 (37)
An Ogive is constructed by plotting a point corresponding to the ___ frequency of each class.
(Multiple Choice)
4.8/5 (40)
In constructing a frequency distribution, as the number of classes are decreased, the class width
(Multiple Choice)
4.8/5 (41)
Five hundred recent graduates indicated their majors as follows.  a.Construct a relative frequency distribution.
b.Construct a percent frequency distribution.
a.Construct a relative frequency distribution.
b.Construct a percent frequency distribution.
(Essay)
4.7/5 (34)
In a scatter diagram, a line that provides an approximation of the relationship between the variables is known as
(Multiple Choice)
4.8/5 (36)
You are given the following data on the ages of employees at a company. Construct a stem-and-leaf display. 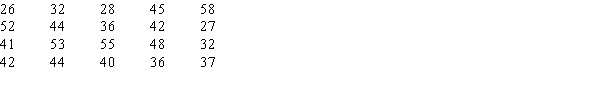
(Essay)
4.9/5 (36)
A sample of 50 TV viewers were asked, "Should TV sponsors pull their sponsorship from programs that draw numerous viewer complaints?" Below are the results of the survey. (Y = Yes; N = No; W = Without Opinion) 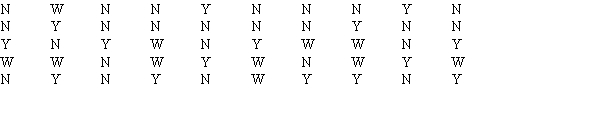 a.Construct a frequency distribution and a bar chart.
b.Construct a relative frequency distribution and a pie chart.
a.Construct a frequency distribution and a bar chart.
b.Construct a relative frequency distribution and a pie chart.
(Essay)
4.8/5 (33)
The sum of the percent frequencies for all classes will always equal
(Multiple Choice)
4.8/5 (38)
In a cumulative relative frequency distribution, the last class will have a cumulative relative frequency equal to
(Multiple Choice)
4.8/5 (41)
Exhibit 2-4
Michael's Compute-All, a national computer retailer, has kept a record of the number of laptop computers they have sold for a period of 80 days. Their sales records are shown below: 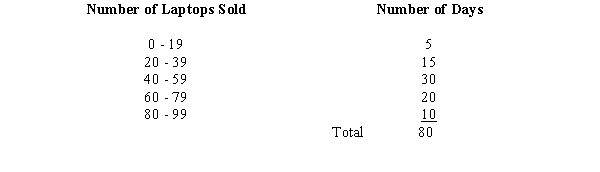 -Refer to Exhibit 2-4. The class width of the above distribution is
(Multiple Choice)
4.8/5 (40)
A tabular method that can be used to summarize the data on two variables simultaneously is called
(Multiple Choice)
4.9/5 (33)
Fifteen percent of the students in a school of Business Administration are majoring in Economics, 20% in Finance, 35% in Management, and 30% in Accounting. The graphical device(s) which can be used to present these data is (are)
(Multiple Choice)
4.8/5 (32)
The difference between the lower class limits of adjacent classes provides the
(Multiple Choice)
4.8/5 (31)
In a cumulative frequency distribution, the last class will always have a cumulative frequency equal to
(Multiple Choice)
4.7/5 (31)
The ___ can be used to show the rank order and shape of a data set simultaneously.
(Multiple Choice)
4.7/5 (35)
Categorical data can be graphically represented by using a(n)
(Multiple Choice)
4.9/5 (36)
Filters
- Essay(0)
- Multiple Choice(0)
- Short Answer(0)
- True False(0)
- Matching(0)