Deck 12: Comparing Multiple Proportions, Tests of Independence and Goodness of Fit
Full screen (f)
Question
Question
When individuals in a sample of 150 were asked whether or not they supported capital punishment, the following information was obtained.  We are interested in determining whether or not the opinions of the individuals (as to Yes, No, and No Opinion) are uniformly distributed.The calculated value for the test statistic equals
A) 2.
B) -2.
C) 1.
D) 4.
We are interested in determining whether or not the opinions of the individuals (as to Yes, No, and No Opinion) are uniformly distributed.The calculated value for the test statistic equalsA) 2.
B) -2.
C) 1.
D) 4.
Question
Question
Question
Question
Question
Last school year, the student body of a local university consisted of 30% freshmen, 24% sophomores, 26% juniors, and 20% seniors.A sample of 400 students taken from this year's student body showed the following number of students in each classification.  We are interested in determining whether or not there has been a significant change in the classifications between the last school year and this school year.The p-value is
A) less than .005.
B) between .025 and .05.
C) between .05 and .1.
D) greater than .1.
We are interested in determining whether or not there has been a significant change in the classifications between the last school year and this school year.The p-value isA) less than .005.
B) between .025 and .05.
C) between .05 and .1.
D) greater than .1.
Question
Question
Question
Question
Last school year, the student body of a local university consisted of 30% freshmen, 24% sophomores, 26% juniors, and 20% seniors.A sample of 400 students taken from this year's student body showed the following number of students in each classification.  We are interested in determining whether or not there has been a significant change in the classifications between the last school year and this school year.The expected number of freshmen is
A) 120.
B) 96.
C) 113.
D) 10.
We are interested in determining whether or not there has been a significant change in the classifications between the last school year and this school year.The expected number of freshmen isA) 120.
B) 96.
C) 113.
D) 10.
Question
Last school year, the student body of a local university consisted of 30% freshmen, 24% sophomores, 26% juniors, and 20% seniors.A sample of 400 students taken from this year's student body showed the following number of students in each classification.  We are interested in determining whether or not there has been a significant change in the classifications between the last school year and this school year.The calculated value for the test statistic equals
A) .54.
B) .65.
C) 2.063.
D) 2.664.
We are interested in determining whether or not there has been a significant change in the classifications between the last school year and this school year.The calculated value for the test statistic equalsA) .54.
B) .65.
C) 2.063.
D) 2.664.
Question
Question
When individuals in a sample of 150 were asked whether or not they supported capital punishment, the following information was obtained.  We are interested in determining whether or not the opinions of the individuals (as to Yes, No, and No Opinion) are uniformly distributed.The number of degrees of freedom associated with this problem is
A) 150.
B) 149.
C) 2.
D) 3.
We are interested in determining whether or not the opinions of the individuals (as to Yes, No, and No Opinion) are uniformly distributed.The number of degrees of freedom associated with this problem isA) 150.
B) 149.
C) 2.
D) 3.
Question
When individuals in a sample of 150 were asked whether or not they supported capital punishment, the following information was obtained.  We are interested in determining whether or not the opinions of the individuals (as to Yes, No, and No Opinion) are uniformly distributed.The p-value is
A) less than .01.
B) larger than .1.
C) between .01 and .05.
D) between .05 and .1.
We are interested in determining whether or not the opinions of the individuals (as to Yes, No, and No Opinion) are uniformly distributed.The p-value isA) less than .01.
B) larger than .1.
C) between .01 and .05.
D) between .05 and .1.
Question
Last school year, the student body of a local university consisted of 30% freshmen, 24% sophomores, 26% juniors, and 20% seniors.A sample of 400 students taken from this year's student body showed the following number of students in each classification.  We are interested in determining whether or not there has been a significant change in the classifications between the last school year and this school year.At a .01 level of significance, the null hypothesis
A) should not be rejected.
B) should be rejected.
C) was designed wrong.
D) cannot be tested.
We are interested in determining whether or not there has been a significant change in the classifications between the last school year and this school year.At a .01 level of significance, the null hypothesisA) should not be rejected.
B) should be rejected.
C) was designed wrong.
D) cannot be tested.
Question
Question
Last school year, the student body of a local university consisted of 30% freshmen, 24% sophomores, 26% juniors, and 20% seniors.A sample of 400 students taken from this year's student body showed the following number of students in each classification.  We are interested in determining whether or not there has been a significant change in the classifications between the last school year and this school year.The expected frequency of seniors is
A) 120.
B) 96.
C) 80.
D) 74.
We are interested in determining whether or not there has been a significant change in the classifications between the last school year and this school year.The expected frequency of seniors isA) 120.
B) 96.
C) 80.
D) 74.
Question
When individuals in a sample of 150 were asked whether or not they supported capital punishment, the following information was obtained.  We are interested in determining whether or not the opinions of the individuals (as to Yes, No, and No Opinion) are uniformly distributed.The conclusion of the test at the 5% level of significance is that the
A) distribution is uniform.
B) null hypothesis cannot be rejected.
C) distribution might have been normal.
D) Marascuilo procedure is more applicable.
We are interested in determining whether or not the opinions of the individuals (as to Yes, No, and No Opinion) are uniformly distributed.The conclusion of the test at the 5% level of significance is that theA) distribution is uniform.
B) null hypothesis cannot be rejected.
C) distribution might have been normal.
D) Marascuilo procedure is more applicable.
Question
When individuals in a sample of 150 were asked whether or not they supported capital punishment, the following information was obtained.  We are interested in determining whether or not the opinions of the individuals (as to Yes, No, and No Opinion) are uniformly distributed.The expected frequency for each group is
A) .333.
B) .50.
C) 1/3.
D) 50.
We are interested in determining whether or not the opinions of the individuals (as to Yes, No, and No Opinion) are uniformly distributed.The expected frequency for each group isA) .333.
B) .50.
C) 1/3.
D) 50.
Question
The owner of a car wash wants to see if the arrival rate of cars follows a Poisson distribution.In order to test the assumption of a Poisson distribution, a random sample of 150 ten-minute intervals was taken.You are given the following observed frequencies: 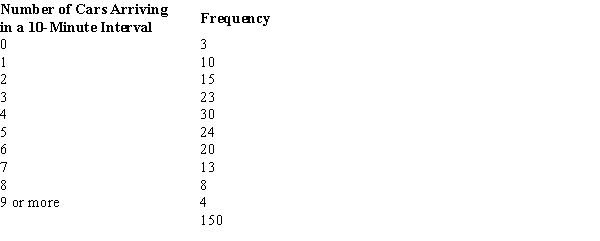 At the .05 level of significance, the conclusion of the test is that the
A) null hypothesis cannot be rejected.
B) arrival of cars does not follow a Poisson distribution.
C) 10-minute intervals follow a Poisson distribution.
D) arrival of cars has no distribution.
At the .05 level of significance, the conclusion of the test is that theA) null hypothesis cannot be rejected.
B) arrival of cars does not follow a Poisson distribution.
C) 10-minute intervals follow a Poisson distribution.
D) arrival of cars has no distribution.
Question
The following table shows the number of individuals in a sample of 300 who indicated they support the new tax proposal.  We are interested in determining whether or not the opinions of the individuals of the three groups are uniformly distributed.The number of degrees of freedom associated with this problem is
A) 2.
B) 3.
C) 300.
D) 299.
We are interested in determining whether or not the opinions of the individuals of the three groups are uniformly distributed.The number of degrees of freedom associated with this problem isA) 2.
B) 3.
C) 300.
D) 299.
Question
The following table shows the number of individuals in a sample of 300 who indicated they support the new tax proposal.  We are interested in determining whether or not the opinions of the individuals of the three groups are uniformly distributed.The calculated value for the test statistic equals
A) 3.
B) 2.
C) 5.3.
D) 0.
We are interested in determining whether or not the opinions of the individuals of the three groups are uniformly distributed.The calculated value for the test statistic equalsA) 3.
B) 2.
C) 5.3.
D) 0.
Question
The table below gives beverage preferences for random samples of teens and adults. 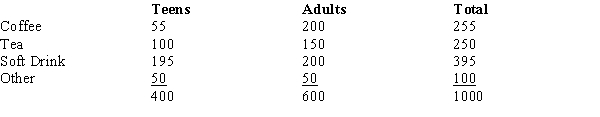 We are asked to test for independence between age (i.e., adult and teen) and drink preferences.The expected number of adults who prefer coffee is
A) 153.
B) 255.
C) 150.
D) 200.
We are asked to test for independence between age (i.e., adult and teen) and drink preferences.The expected number of adults who prefer coffee isA) 153.
B) 255.
C) 150.
D) 200.
Question
The table below gives beverage preferences for random samples of teens and adults.  We are asked to test for independence between age (i.e., adult and teen) and drink preferences.The test statistic for this test of independence is
A) 0.
B) 8.4.
C) 62.5.
D) 54.7.
We are asked to test for independence between age (i.e., adult and teen) and drink preferences.The test statistic for this test of independence isA) 0.
B) 8.4.
C) 62.5.
D) 54.7.
Question
Question
The owner of a car wash wants to see if the arrival rate of cars follows a Poisson distribution.In order to test the assumption of a Poisson distribution, a random sample of 150 ten-minute intervals was taken.You are given the following observed frequencies:  The calculated value for the test statistic equals
A) 3.11.
B) .18.
C) 1.72.
D) 2.89.
The calculated value for the test statistic equalsA) 3.11.
B) .18.
C) 1.72.
D) 2.89.
Question
Question
The table below gives beverage preferences for random samples of teens and adults.  We are asked to test for independence between age (i.e., adult and teen) and drink preferences.With a .05 level of significance, the critical value for the test is
A) 5.991.
B) 7.815.
C) 14.067.
D) 15.507.
We are asked to test for independence between age (i.e., adult and teen) and drink preferences.With a .05 level of significance, the critical value for the test isA) 5.991.
B) 7.815.
C) 14.067.
D) 15.507.
Question
The owner of a car wash wants to see if the arrival rate of cars follows a Poisson distribution.In order to test the assumption of a Poisson distribution, a random sample of 150 ten-minute intervals was taken.You are given the following observed frequencies:  The p-value is
A) greater than .1.
B) between .05 and .1.
C) between .025 and .05.
D) less than .01.
The p-value isA) greater than .1.
B) between .05 and .1.
C) between .025 and .05.
D) less than .01.
Question
You want to test whether or not the following sample of 30 observations follows a normal distribution.The mean of the sample equals 11.83 and the standard deviation equals 4.53.  The number of intervals or categories used to test the hypothesis for this problem is
A) 4.
B) 5.
C) 6.
D) 10.
The number of intervals or categories used to test the hypothesis for this problem isA) 4.
B) 5.
C) 6.
D) 10.
Question
You want to test whether or not the following sample of 30 observations follows a normal distribution.The mean of the sample equals 11.83 and the standard deviation equals 4.53.  The expected frequency in the 3rd interval is
A) 3.
B) 4.
C) 5.
D) 10.
The expected frequency in the 3rd interval isA) 3.
B) 4.
C) 5.
D) 10.
Question
You want to test whether or not the following sample of 30 observations follows a normal distribution.The mean of the sample equals 11.83 and the standard deviation equals 4.53.  The calculated value for the test statistic equals
A) 0.
B) 1.67.
C) 2.
D) 6.
The calculated value for the test statistic equalsA) 0.
B) 1.67.
C) 2.
D) 6.
Question
Question
Question
You want to test whether or not the following sample of 30 observations follows a normal distribution.The mean of the sample equals 11.83 and the standard deviation equals 4.53.  At the 5% level of significance, the conclusion of the test is that the
A) null hypothesis cannot be rejected.
B) data does not follow a normal distribution.
C) sample data has no probability distribution.
D) sample data is incorrect.
At the 5% level of significance, the conclusion of the test is that theA) null hypothesis cannot be rejected.
B) data does not follow a normal distribution.
C) sample data has no probability distribution.
D) sample data is incorrect.
Question
Question
You want to test whether or not the following sample of 30 observations follows a normal distribution.The mean of the sample equals 11.83 and the standard deviation equals 4.53.  The p-value is
A) greater than .1.
B) between .05 and .1.
C) between .025 and .05.
D) less than .005.
The p-value isA) greater than .1.
B) between .05 and .1.
C) between .025 and .05.
D) less than .005.
Question
The owner of a car wash wants to see if the arrival rate of cars follows a Poisson distribution.In order to test the assumption of a Poisson distribution, a random sample of 150 ten-minute intervals was taken.You are given the following observed frequencies:  Calculate mean and use Poisson probabilities.The expected frequency of exactly 3 cars arriving in a 10-minute interval is
A) .1533.
B) .1743.
C) 23.
D) 26.145.
Calculate mean and use Poisson probabilities.The expected frequency of exactly 3 cars arriving in a 10-minute interval isA) .1533.
B) .1743.
C) 23.
D) 26.145.
Question
The following table shows the number of individuals in a sample of 450 who indicated they support the new tax proposal.  We are interested in determining whether or not the opinions of the individuals of the three groups are uniformly distributed.The expected frequency for each group is
A) .333.
B) .50.
C) 150.
D) 135.
We are interested in determining whether or not the opinions of the individuals of the three groups are uniformly distributed.The expected frequency for each group isA) .333.
B) .50.
C) 150.
D) 135.
Question
Question
From a poll of 800 television viewers, the following data have been accumulated as to their levels of education and their preference of television stations. 
Test at α = .05 to determine if the selection of a TV station is dependent upon the level of education.Use the p-value approach.
Test at α = .05 to determine if the selection of a TV station is dependent upon the level of education.Use the p-value approach.
Question
Two hundred fifty managers with degrees in business administration indicated their fields of concentration as shown below. 
At α = .01 using the p-value approach, test to determine if the position in management is independent of the major of concentration.
At α = .01 using the p-value approach, test to determine if the position in management is independent of the major of concentration.
Question
A group of 2000 individuals from 3 different cities were asked whether they owned a foreign or a domestic car.The following table shows the results of the survey. 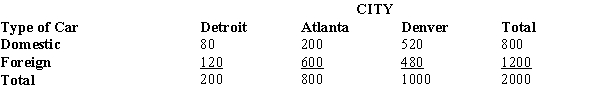
At α = .01 using the p-value approach, test to determine if the type of car purchased is independent of the city in which the purchasers live.
At α = .01 using the p-value approach, test to determine if the type of car purchased is independent of the city in which the purchasers live.
Question
An insurance company has gathered the following information regarding the number of accidents reported per day over a period of 100 days. 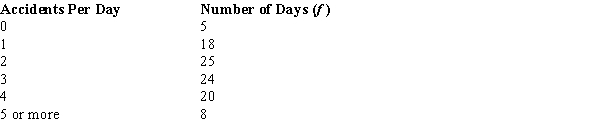
Using the critical value approach, test to see if the above data have a Poisson distribution.Let α = .05.
Using the critical value approach, test to see if the above data have a Poisson distribution.Let α = .05.
Question
The following data show the scores of a sample of 40 students who have taken statistics. 
Use α = .10 and conduct a goodness of fit test to determine if the sample comes from a population that has a normal distribution.Use the critical value approach.
Use α = .10 and conduct a goodness of fit test to determine if the sample comes from a population that has a normal distribution.Use the critical value approach.
Question
Question
A major automobile manufacturer claimed that the frequencies of repairs on all five models of its cars are the same.A sample of 200 repair services showed the following frequencies on the various makes of cars. 
At α = .01, test the manufacturer's claim.
At α = .01, test the manufacturer's claim.
Question
The number of emergency calls per day at a hospital over a period of 120 days is shown below. 
Use α = .05 and the p-value approach to see if the above data have a Poisson distribution.
Use α = .05 and the p-value approach to see if the above data have a Poisson distribution.
Question
Question
Question
Question
From a poll of 800 television viewers, the following data have been accumulated as to their levels of education and their preference of television stations.We are interested in determining if the selection of a TV station is independent of the level of education. 
a.
State the null and alternative hypotheses.
b.
Show the table of the expected frequencies.
c.
Compute the test statistic.
d.
The null hypothesis is to be tested at the 10% level of significance.Determine the critical value for this test.
e.
Determine the p-value and perform the test.
a.
State the null and alternative hypotheses.
b.
Show the table of the expected frequencies.
c.
Compute the test statistic.
d.
The null hypothesis is to be tested at the 10% level of significance.Determine the critical value for this test.
e.
Determine the p-value and perform the test.
Question
Question
Question
The personnel department of a large corporation reported sixty resignations during the last year.The following table groups these resignations according to the season during which they occurred: 
Test to see if the proportion of resignations is uniform over the four seasons.
Let α = .05.
Test to see if the proportion of resignations is uniform over the four seasons.
Let α = .05.
Question
Shown below is a 2 x 3 table with observed values from a sample of 500.At α = .05 using the critical value approach, test for independence of the row and column factors. 
Question
A group of 500 individuals were asked to cast their votes regarding a particular issue of the Equal Rights Amendment.The following table shows the results of the votes: 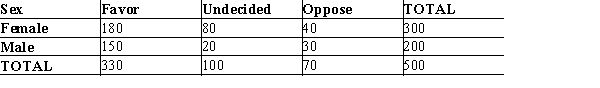
At α = .05 using the p-value approach, test to determine if the votes cast were independent of the sex of the individuals.
At α = .05 using the p-value approach, test to determine if the votes cast were independent of the sex of the individuals.
Question
Shown below is 3 x 2 table with observed values from a sample of 1500.At the 5% level of significance, test for independence of the row and column factors. 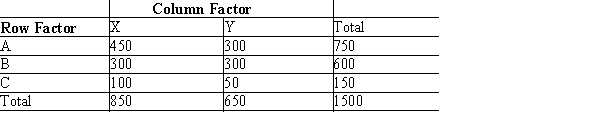

Unlock Deck
Sign up to unlock the cards in this deck!
Unlock Deck
Unlock Deck
1/59
Play
Full screen (f)
Deck 12: Comparing Multiple Proportions, Tests of Independence and Goodness of Fit
1
The degrees of freedom for a data table with 10 rows and 11 columns is
A) 100.
B) 110.
C) 21.
D) 90.
A) 100.
B) 110.
C) 21.
D) 90.
90.
2
When individuals in a sample of 150 were asked whether or not they supported capital punishment, the following information was obtained. We are interested in determining whether or not the opinions of the individuals (as to Yes, No, and No Opinion) are uniformly distributed.The calculated value for the test statistic equals
A) 2.
B) -2.
C) 1.
D) 4.
We are interested in determining whether or not the opinions of the individuals (as to Yes, No, and No Opinion) are uniformly distributed.The calculated value for the test statistic equalsA) 2.
B) -2.
C) 1.
D) 4.
1.
3
A statistical test conducted to determine whether to reject or not reject a hypothesized probability distribution for a population is known as a _____ test.
A) comparison
B) probability
C) goodness of fit
D) normality
A) comparison
B) probability
C) goodness of fit
D) normality
goodness of fit
4
If there are three or more populations, then it is
A) possible to test for equality of three or more population proportions.
B) impossible to test for equality of the three population proportions, because chi-square tests deal with only two populations.
C) customary to use a t distribution to test for equality of the three population proportions.
D) reasonable to test for equality of multiple population proportions using chi-square lower tail tests.
Unlock Deck
Unlock for access to all 59 flashcards in this deck.
Unlock Deck
k this deck
5
The degrees of freedom for a table with 7 rows and 4 columns is
A) 28.
B) 11.
C) 9.
D) 18.
A) 28.
B) 11.
C) 9.
D) 18.
Unlock Deck
Unlock for access to all 59 flashcards in this deck.
Unlock Deck
k this deck
6
An important application of the chi-square distribution is
A) making inferences about a single population variance.
B) testing for goodness of fit.
C) testing for the independence of two categorical variables.
D) All of these alternatives are correct.
A) making inferences about a single population variance.
B) testing for goodness of fit.
C) testing for the independence of two categorical variables.
D) All of these alternatives are correct.
Unlock Deck
Unlock for access to all 59 flashcards in this deck.
Unlock Deck
k this deck
7
Last school year, the student body of a local university consisted of 30% freshmen, 24% sophomores, 26% juniors, and 20% seniors.A sample of 400 students taken from this year's student body showed the following number of students in each classification. We are interested in determining whether or not there has been a significant change in the classifications between the last school year and this school year.The p-value is
A) less than .005.
B) between .025 and .05.
C) between .05 and .1.
D) greater than .1.
We are interested in determining whether or not there has been a significant change in the classifications between the last school year and this school year.The p-value isA) less than .005.
B) between .025 and .05.
C) between .05 and .1.
D) greater than .1.
Unlock Deck
Unlock for access to all 59 flashcards in this deck.
Unlock Deck
k this deck
8
The degrees of freedom for a data table with 10 rows and 10 columns is
A) 100.
B) 81.
C) 18.
D) 20.
A) 100.
B) 81.
C) 18.
D) 20.
Unlock Deck
Unlock for access to all 59 flashcards in this deck.
Unlock Deck
k this deck
9
The number of degrees of freedom associated with the chi-square distribution in a test of independence is number of _____ minus 1.
A) sample items
B) populations
C) rows minus 1 times number of columns
D) populations minus number of estimated parameters
A) sample items
B) populations
C) rows minus 1 times number of columns
D) populations minus number of estimated parameters
Unlock Deck
Unlock for access to all 59 flashcards in this deck.
Unlock Deck
k this deck
10
A population where each of its element is assigned to one and only one of several classes or categories is a _____ population.
A) multinomial
B) Poisson
C) normal
D) binomial
A) multinomial
B) Poisson
C) normal
D) binomial
Unlock Deck
Unlock for access to all 59 flashcards in this deck.
Unlock Deck
k this deck
11
Last school year, the student body of a local university consisted of 30% freshmen, 24% sophomores, 26% juniors, and 20% seniors.A sample of 400 students taken from this year's student body showed the following number of students in each classification. We are interested in determining whether or not there has been a significant change in the classifications between the last school year and this school year.The expected number of freshmen is
A) 120.
B) 96.
C) 113.
D) 10.
We are interested in determining whether or not there has been a significant change in the classifications between the last school year and this school year.The expected number of freshmen isA) 120.
B) 96.
C) 113.
D) 10.
Unlock Deck
Unlock for access to all 59 flashcards in this deck.
Unlock Deck
k this deck
12
Last school year, the student body of a local university consisted of 30% freshmen, 24% sophomores, 26% juniors, and 20% seniors.A sample of 400 students taken from this year's student body showed the following number of students in each classification. We are interested in determining whether or not there has been a significant change in the classifications between the last school year and this school year.The calculated value for the test statistic equals
A) .54.
B) .65.
C) 2.063.
D) 2.664.
We are interested in determining whether or not there has been a significant change in the classifications between the last school year and this school year.The calculated value for the test statistic equalsA) .54.
B) .65.
C) 2.063.
D) 2.664.
Unlock Deck
Unlock for access to all 59 flashcards in this deck.
Unlock Deck
k this deck
13
The sampling distribution for a goodness of fit test is the _____ distribution.
A) Poisson
B) t
C) normal
D) chi-square
A) Poisson
B) t
C) normal
D) chi-square
Unlock Deck
Unlock for access to all 59 flashcards in this deck.
Unlock Deck
k this deck
14
When individuals in a sample of 150 were asked whether or not they supported capital punishment, the following information was obtained. We are interested in determining whether or not the opinions of the individuals (as to Yes, No, and No Opinion) are uniformly distributed.The number of degrees of freedom associated with this problem is
A) 150.
B) 149.
C) 2.
D) 3.
We are interested in determining whether or not the opinions of the individuals (as to Yes, No, and No Opinion) are uniformly distributed.The number of degrees of freedom associated with this problem isA) 150.
B) 149.
C) 2.
D) 3.
Unlock Deck
Unlock for access to all 59 flashcards in this deck.
Unlock Deck
k this deck
15
When individuals in a sample of 150 were asked whether or not they supported capital punishment, the following information was obtained. We are interested in determining whether or not the opinions of the individuals (as to Yes, No, and No Opinion) are uniformly distributed.The p-value is
A) less than .01.
B) larger than .1.
C) between .01 and .05.
D) between .05 and .1.
We are interested in determining whether or not the opinions of the individuals (as to Yes, No, and No Opinion) are uniformly distributed.The p-value isA) less than .01.
B) larger than .1.
C) between .01 and .05.
D) between .05 and .1.
Unlock Deck
Unlock for access to all 59 flashcards in this deck.
Unlock Deck
k this deck
16
Last school year, the student body of a local university consisted of 30% freshmen, 24% sophomores, 26% juniors, and 20% seniors.A sample of 400 students taken from this year's student body showed the following number of students in each classification. We are interested in determining whether or not there has been a significant change in the classifications between the last school year and this school year.At a .01 level of significance, the null hypothesis
A) should not be rejected.
B) should be rejected.
C) was designed wrong.
D) cannot be tested.
We are interested in determining whether or not there has been a significant change in the classifications between the last school year and this school year.At a .01 level of significance, the null hypothesisA) should not be rejected.
B) should be rejected.
C) was designed wrong.
D) cannot be tested.
Unlock Deck
Unlock for access to all 59 flashcards in this deck.
Unlock Deck
k this deck
17
Marascuilo procedure is used to test for a significant difference between pairs of population
A) proportions.
B) means.
C) variances.
D) standard deviations.
A) proportions.
B) means.
C) variances.
D) standard deviations.
Unlock Deck
Unlock for access to all 59 flashcards in this deck.
Unlock Deck
k this deck
18
Last school year, the student body of a local university consisted of 30% freshmen, 24% sophomores, 26% juniors, and 20% seniors.A sample of 400 students taken from this year's student body showed the following number of students in each classification. We are interested in determining whether or not there has been a significant change in the classifications between the last school year and this school year.The expected frequency of seniors is
A) 120.
B) 96.
C) 80.
D) 74.
We are interested in determining whether or not there has been a significant change in the classifications between the last school year and this school year.The expected frequency of seniors isA) 120.
B) 96.
C) 80.
D) 74.
Unlock Deck
Unlock for access to all 59 flashcards in this deck.
Unlock Deck
k this deck
19
When individuals in a sample of 150 were asked whether or not they supported capital punishment, the following information was obtained. We are interested in determining whether or not the opinions of the individuals (as to Yes, No, and No Opinion) are uniformly distributed.The conclusion of the test at the 5% level of significance is that the
A) distribution is uniform.
B) null hypothesis cannot be rejected.
C) distribution might have been normal.
D) Marascuilo procedure is more applicable.
We are interested in determining whether or not the opinions of the individuals (as to Yes, No, and No Opinion) are uniformly distributed.The conclusion of the test at the 5% level of significance is that theA) distribution is uniform.
B) null hypothesis cannot be rejected.
C) distribution might have been normal.
D) Marascuilo procedure is more applicable.
Unlock Deck
Unlock for access to all 59 flashcards in this deck.
Unlock Deck
k this deck
20
When individuals in a sample of 150 were asked whether or not they supported capital punishment, the following information was obtained. We are interested in determining whether or not the opinions of the individuals (as to Yes, No, and No Opinion) are uniformly distributed.The expected frequency for each group is
A) .333.
B) .50.
C) 1/3.
D) 50.
We are interested in determining whether or not the opinions of the individuals (as to Yes, No, and No Opinion) are uniformly distributed.The expected frequency for each group isA) .333.
B) .50.
C) 1/3.
D) 50.
Unlock Deck
Unlock for access to all 59 flashcards in this deck.
Unlock Deck
k this deck
21
The owner of a car wash wants to see if the arrival rate of cars follows a Poisson distribution.In order to test the assumption of a Poisson distribution, a random sample of 150 ten-minute intervals was taken.You are given the following observed frequencies: At the .05 level of significance, the conclusion of the test is that the
A) null hypothesis cannot be rejected.
B) arrival of cars does not follow a Poisson distribution.
C) 10-minute intervals follow a Poisson distribution.
D) arrival of cars has no distribution.
At the .05 level of significance, the conclusion of the test is that theA) null hypothesis cannot be rejected.
B) arrival of cars does not follow a Poisson distribution.
C) 10-minute intervals follow a Poisson distribution.
D) arrival of cars has no distribution.
Unlock Deck
Unlock for access to all 59 flashcards in this deck.
Unlock Deck
k this deck
22
The following table shows the number of individuals in a sample of 300 who indicated they support the new tax proposal. We are interested in determining whether or not the opinions of the individuals of the three groups are uniformly distributed.The number of degrees of freedom associated with this problem is
A) 2.
B) 3.
C) 300.
D) 299.
We are interested in determining whether or not the opinions of the individuals of the three groups are uniformly distributed.The number of degrees of freedom associated with this problem isA) 2.
B) 3.
C) 300.
D) 299.
Unlock Deck
Unlock for access to all 59 flashcards in this deck.
Unlock Deck
k this deck
23
The following table shows the number of individuals in a sample of 300 who indicated they support the new tax proposal. We are interested in determining whether or not the opinions of the individuals of the three groups are uniformly distributed.The calculated value for the test statistic equals
A) 3.
B) 2.
C) 5.3.
D) 0.
We are interested in determining whether or not the opinions of the individuals of the three groups are uniformly distributed.The calculated value for the test statistic equalsA) 3.
B) 2.
C) 5.3.
D) 0.
Unlock Deck
Unlock for access to all 59 flashcards in this deck.
Unlock Deck
k this deck
24
The table below gives beverage preferences for random samples of teens and adults. We are asked to test for independence between age (i.e., adult and teen) and drink preferences.The expected number of adults who prefer coffee is
A) 153.
B) 255.
C) 150.
D) 200.
We are asked to test for independence between age (i.e., adult and teen) and drink preferences.The expected number of adults who prefer coffee isA) 153.
B) 255.
C) 150.
D) 200.
Unlock Deck
Unlock for access to all 59 flashcards in this deck.
Unlock Deck
k this deck
25
The table below gives beverage preferences for random samples of teens and adults. We are asked to test for independence between age (i.e., adult and teen) and drink preferences.The test statistic for this test of independence is
A) 0.
B) 8.4.
C) 62.5.
D) 54.7.
We are asked to test for independence between age (i.e., adult and teen) and drink preferences.The test statistic for this test of independence isA) 0.
B) 8.4.
C) 62.5.
D) 54.7.
Unlock Deck
Unlock for access to all 59 flashcards in this deck.
Unlock Deck
k this deck
26
In the past, 35% of the students at ABC University were in the Business College, 35% of the students were in the Liberal Arts College, and 30% of the students were in the Education College.To see whether or not the proportions have changed, a sample of 300 students from the university was taken.Ninety of the sample students are in the Business College, 120 are in the Liberal Arts College, and 90 are in the Education College.Using α = .05, the conclusion of the test is that the
A) null hypothesis cannot be rejected.
B) proportions have not changed significantly.
C) proportions follow normal distribution.
D) Marascuilo procedure is more applicable.
A) null hypothesis cannot be rejected.
B) proportions have not changed significantly.
C) proportions follow normal distribution.
D) Marascuilo procedure is more applicable.
Unlock Deck
Unlock for access to all 59 flashcards in this deck.
Unlock Deck
k this deck
27
The owner of a car wash wants to see if the arrival rate of cars follows a Poisson distribution.In order to test the assumption of a Poisson distribution, a random sample of 150 ten-minute intervals was taken.You are given the following observed frequencies: The calculated value for the test statistic equals
A) 3.11.
B) .18.
C) 1.72.
D) 2.89.
The calculated value for the test statistic equalsA) 3.11.
B) .18.
C) 1.72.
D) 2.89.
Unlock Deck
Unlock for access to all 59 flashcards in this deck.
Unlock Deck
k this deck
28
In the past, 35% of the students at ABC University were in the Business College, 35% of the students were in the Liberal Arts College, and 30% of the students were in the Education College.To see whether or not the proportions have changed, a sample of 300 students from the university was taken.Ninety of the sample students are in the Business College, 120 are in the Liberal Arts College, and 90 are in the Education College.The expected frequency for the Business College is
A) .3.
B) .35.
C) 90.
D) 105.
A) .3.
B) .35.
C) 90.
D) 105.
Unlock Deck
Unlock for access to all 59 flashcards in this deck.
Unlock Deck
k this deck
29
The table below gives beverage preferences for random samples of teens and adults. We are asked to test for independence between age (i.e., adult and teen) and drink preferences.With a .05 level of significance, the critical value for the test is
A) 5.991.
B) 7.815.
C) 14.067.
D) 15.507.
We are asked to test for independence between age (i.e., adult and teen) and drink preferences.With a .05 level of significance, the critical value for the test isA) 5.991.
B) 7.815.
C) 14.067.
D) 15.507.
Unlock Deck
Unlock for access to all 59 flashcards in this deck.
Unlock Deck
k this deck
30
The owner of a car wash wants to see if the arrival rate of cars follows a Poisson distribution.In order to test the assumption of a Poisson distribution, a random sample of 150 ten-minute intervals was taken.You are given the following observed frequencies: The p-value is
A) greater than .1.
B) between .05 and .1.
C) between .025 and .05.
D) less than .01.
The p-value isA) greater than .1.
B) between .05 and .1.
C) between .025 and .05.
D) less than .01.
Unlock Deck
Unlock for access to all 59 flashcards in this deck.
Unlock Deck
k this deck
31
You want to test whether or not the following sample of 30 observations follows a normal distribution.The mean of the sample equals 11.83 and the standard deviation equals 4.53. The number of intervals or categories used to test the hypothesis for this problem is
A) 4.
B) 5.
C) 6.
D) 10.
The number of intervals or categories used to test the hypothesis for this problem isA) 4.
B) 5.
C) 6.
D) 10.
Unlock Deck
Unlock for access to all 59 flashcards in this deck.
Unlock Deck
k this deck
32
You want to test whether or not the following sample of 30 observations follows a normal distribution.The mean of the sample equals 11.83 and the standard deviation equals 4.53. The expected frequency in the 3rd interval is
A) 3.
B) 4.
C) 5.
D) 10.
The expected frequency in the 3rd interval isA) 3.
B) 4.
C) 5.
D) 10.
Unlock Deck
Unlock for access to all 59 flashcards in this deck.
Unlock Deck
k this deck
33
You want to test whether or not the following sample of 30 observations follows a normal distribution.The mean of the sample equals 11.83 and the standard deviation equals 4.53. The calculated value for the test statistic equals
A) 0.
B) 1.67.
C) 2.
D) 6.
The calculated value for the test statistic equalsA) 0.
B) 1.67.
C) 2.
D) 6.
Unlock Deck
Unlock for access to all 59 flashcards in this deck.
Unlock Deck
k this deck
34
In the past, 35% of the students at ABC University were in the Business College, 35% of the students were in the Liberal Arts College, and 30% of the students were in the Education College.To see whether or not the proportions have changed, a sample of 300 students from the university was taken.Ninety of the sample students are in the Business College, 120 are in the Liberal Arts College, and 90 are in the Education College.The calculated value for the test statistic equals
A) .01.
B) .75.
C) 4.29.
D) 4.38.
A) .01.
B) .75.
C) 4.29.
D) 4.38.
Unlock Deck
Unlock for access to all 59 flashcards in this deck.
Unlock Deck
k this deck
35
In the past, 35% of the students at ABC University were in the Business College, 35% of the students were in the Liberal Arts College, and 30% of the students were in the Education College.To see whether or not the proportions have changed, a sample of 300 students from the university was taken.Ninety of the sample students are in the Business College, 120 are in the Liberal Arts College, and 90 are in the Education College.The hypothesis is to be tested at the 5% level of significance.The critical value from the table equals
A) 7.378.
B) 9.348.
C) 5.991.
D) 7.815.
A) 7.378.
B) 9.348.
C) 5.991.
D) 7.815.
Unlock Deck
Unlock for access to all 59 flashcards in this deck.
Unlock Deck
k this deck
36
You want to test whether or not the following sample of 30 observations follows a normal distribution.The mean of the sample equals 11.83 and the standard deviation equals 4.53. At the 5% level of significance, the conclusion of the test is that the
A) null hypothesis cannot be rejected.
B) data does not follow a normal distribution.
C) sample data has no probability distribution.
D) sample data is incorrect.
At the 5% level of significance, the conclusion of the test is that theA) null hypothesis cannot be rejected.
B) data does not follow a normal distribution.
C) sample data has no probability distribution.
D) sample data is incorrect.
Unlock Deck
Unlock for access to all 59 flashcards in this deck.
Unlock Deck
k this deck
37
In the past, 35% of the students at ABC University were in the Business College, 35% of the students were in the Liberal Arts College, and 30% of the students were in the Education College.To see whether or not the proportions have changed, a sample of 300 students from the university was taken.Ninety of the sample students are in the Business College, 120 are in the Liberal Arts College, and 90 are in the Education College.This problem is an example of a
A) z test for proportions.
B) test for independence.
C) Marascuilo procedure.
D) multinomial population.
A) z test for proportions.
B) test for independence.
C) Marascuilo procedure.
D) multinomial population.
Unlock Deck
Unlock for access to all 59 flashcards in this deck.
Unlock Deck
k this deck
38
You want to test whether or not the following sample of 30 observations follows a normal distribution.The mean of the sample equals 11.83 and the standard deviation equals 4.53. The p-value is
A) greater than .1.
B) between .05 and .1.
C) between .025 and .05.
D) less than .005.
The p-value isA) greater than .1.
B) between .05 and .1.
C) between .025 and .05.
D) less than .005.
Unlock Deck
Unlock for access to all 59 flashcards in this deck.
Unlock Deck
k this deck
39
The owner of a car wash wants to see if the arrival rate of cars follows a Poisson distribution.In order to test the assumption of a Poisson distribution, a random sample of 150 ten-minute intervals was taken.You are given the following observed frequencies: Calculate mean and use Poisson probabilities.The expected frequency of exactly 3 cars arriving in a 10-minute interval is
A) .1533.
B) .1743.
C) 23.
D) 26.145.
Calculate mean and use Poisson probabilities.The expected frequency of exactly 3 cars arriving in a 10-minute interval isA) .1533.
B) .1743.
C) 23.
D) 26.145.
Unlock Deck
Unlock for access to all 59 flashcards in this deck.
Unlock Deck
k this deck
40
The following table shows the number of individuals in a sample of 450 who indicated they support the new tax proposal. We are interested in determining whether or not the opinions of the individuals of the three groups are uniformly distributed.The expected frequency for each group is
A) .333.
B) .50.
C) 150.
D) 135.
We are interested in determining whether or not the opinions of the individuals of the three groups are uniformly distributed.The expected frequency for each group isA) .333.
B) .50.
C) 150.
D) 135.
Unlock Deck
Unlock for access to all 59 flashcards in this deck.
Unlock Deck
k this deck
41
The number of categorical outcomes per trial for a multinomial probability distribution is
A) two or more.
B) three or more.
C) four or more.
D) five or more.
A) two or more.
B) three or more.
C) four or more.
D) five or more.
Unlock Deck
Unlock for access to all 59 flashcards in this deck.
Unlock Deck
k this deck
42
From a poll of 800 television viewers, the following data have been accumulated as to their levels of education and their preference of television stations.
Test at α = .05 to determine if the selection of a TV station is dependent upon the level of education.Use the p-value approach.
Test at α = .05 to determine if the selection of a TV station is dependent upon the level of education.Use the p-value approach.
Unlock Deck
Unlock for access to all 59 flashcards in this deck.
Unlock Deck
k this deck
43
Two hundred fifty managers with degrees in business administration indicated their fields of concentration as shown below.
At α = .01 using the p-value approach, test to determine if the position in management is independent of the major of concentration.
At α = .01 using the p-value approach, test to determine if the position in management is independent of the major of concentration.
Unlock Deck
Unlock for access to all 59 flashcards in this deck.
Unlock Deck
k this deck
44
A group of 2000 individuals from 3 different cities were asked whether they owned a foreign or a domestic car.The following table shows the results of the survey.
At α = .01 using the p-value approach, test to determine if the type of car purchased is independent of the city in which the purchasers live.
At α = .01 using the p-value approach, test to determine if the type of car purchased is independent of the city in which the purchasers live.
Unlock Deck
Unlock for access to all 59 flashcards in this deck.
Unlock Deck
k this deck
45
An insurance company has gathered the following information regarding the number of accidents reported per day over a period of 100 days.
Using the critical value approach, test to see if the above data have a Poisson distribution.Let α = .05.
Using the critical value approach, test to see if the above data have a Poisson distribution.Let α = .05.
Unlock Deck
Unlock for access to all 59 flashcards in this deck.
Unlock Deck
k this deck
46
The following data show the scores of a sample of 40 students who have taken statistics.
Use α = .10 and conduct a goodness of fit test to determine if the sample comes from a population that has a normal distribution.Use the critical value approach.
Use α = .10 and conduct a goodness of fit test to determine if the sample comes from a population that has a normal distribution.Use the critical value approach.
Unlock Deck
Unlock for access to all 59 flashcards in this deck.
Unlock Deck
k this deck
47
The test for goodness of fit, test of independence, and test of multiple proportions are designed for use with _____ data.
A) categorical
B) bivariate
C) quantitative
D) ordinal
A) categorical
B) bivariate
C) quantitative
D) ordinal
Unlock Deck
Unlock for access to all 59 flashcards in this deck.
Unlock Deck
k this deck
48
A major automobile manufacturer claimed that the frequencies of repairs on all five models of its cars are the same.A sample of 200 repair services showed the following frequencies on the various makes of cars.
At α = .01, test the manufacturer's claim.
At α = .01, test the manufacturer's claim.
Unlock Deck
Unlock for access to all 59 flashcards in this deck.
Unlock Deck
k this deck
49
The number of emergency calls per day at a hospital over a period of 120 days is shown below.
Use α = .05 and the p-value approach to see if the above data have a Poisson distribution.
Use α = .05 and the p-value approach to see if the above data have a Poisson distribution.
Unlock Deck
Unlock for access to all 59 flashcards in this deck.
Unlock Deck
k this deck
50
The test for goodness of fit
A) is always a lower tail test.
B) is always an upper tail test.
C) is always a two-tailed test.
D) can be a lower or an upper tail test.
A) is always a lower tail test.
B) is always an upper tail test.
C) is always a two-tailed test.
D) can be a lower or an upper tail test.
Unlock Deck
Unlock for access to all 59 flashcards in this deck.
Unlock Deck
k this deck
51
The test statistic for goodness of fit has a chi-square distribution with k - 1 degrees of freedom provided that the expected frequencies for all categories are
A) 5 or more.
B) 10 or more.
C) k or more.
D) 2k.
A) 5 or more.
B) 10 or more.
C) k or more.
D) 2k.
Unlock Deck
Unlock for access to all 59 flashcards in this deck.
Unlock Deck
k this deck
52
The properties of a multinomial experiment include all of the following except
A) the experiment consists of a sequence of n identical trials.
B) three or more outcomes are possible on each trial.
C) the probability of each outcome can change from trial to trial.
D) the trials are independent.
A) the experiment consists of a sequence of n identical trials.
B) three or more outcomes are possible on each trial.
C) the probability of each outcome can change from trial to trial.
D) the trials are independent.
Unlock Deck
Unlock for access to all 59 flashcards in this deck.
Unlock Deck
k this deck
53
From a poll of 800 television viewers, the following data have been accumulated as to their levels of education and their preference of television stations.We are interested in determining if the selection of a TV station is independent of the level of education.
a.
State the null and alternative hypotheses.
b.
Show the table of the expected frequencies.
c.
Compute the test statistic.
d.
The null hypothesis is to be tested at the 10% level of significance.Determine the critical value for this test.
e.
Determine the p-value and perform the test.
a.
State the null and alternative hypotheses.
b.
Show the table of the expected frequencies.
c.
Compute the test statistic.
d.
The null hypothesis is to be tested at the 10% level of significance.Determine the critical value for this test.
e.
Determine the p-value and perform the test.
Unlock Deck
Unlock for access to all 59 flashcards in this deck.
Unlock Deck
k this deck
54
In 2002, 40% of the students at a major university were Business majors, 35% were Engineering majors, and the rest of the students were majoring in other fields.In a sample of 600 students from the same university taken in 2003, 200 were Business majors, 220 were Engineering majors, and the remaining students in the sample were majoring in other fields.Using α = .01, test to see if there has been a significant change in the proportions between 2002 and 2003.
Unlock Deck
Unlock for access to all 59 flashcards in this deck.
Unlock Deck
k this deck
55
Before the rush began for Christmas shopping, a department store had noted that the percentage of its customers who use the store's credit card, the percentage of those who use a major credit card, and the percentage of those who pay cash are the same.During the Christmas rush, in a sample of 210 shoppers, 66 used the store's credit card; 63 used a major credit card; and 81 paid cash.With α = .05, test to see if the methods of payment have changed during the Christmas rush.
Unlock Deck
Unlock for access to all 59 flashcards in this deck.
Unlock Deck
k this deck
56
The personnel department of a large corporation reported sixty resignations during the last year.The following table groups these resignations according to the season during which they occurred:
Test to see if the proportion of resignations is uniform over the four seasons.
Let α = .05.
Test to see if the proportion of resignations is uniform over the four seasons.
Let α = .05.
Unlock Deck
Unlock for access to all 59 flashcards in this deck.
Unlock Deck
k this deck
57
Shown below is a 2 x 3 table with observed values from a sample of 500.At α = .05 using the critical value approach, test for independence of the row and column factors.
Unlock Deck
Unlock for access to all 59 flashcards in this deck.
Unlock Deck
k this deck
58
A group of 500 individuals were asked to cast their votes regarding a particular issue of the Equal Rights Amendment.The following table shows the results of the votes:
At α = .05 using the p-value approach, test to determine if the votes cast were independent of the sex of the individuals.
At α = .05 using the p-value approach, test to determine if the votes cast were independent of the sex of the individuals.
Unlock Deck
Unlock for access to all 59 flashcards in this deck.
Unlock Deck
k this deck
59
Shown below is 3 x 2 table with observed values from a sample of 1500.At the 5% level of significance, test for independence of the row and column factors.
Unlock Deck
Unlock for access to all 59 flashcards in this deck.
Unlock Deck
k this deck
Unlock Deck
Unlock for access to all 59 flashcards in this deck.


