Exam 12: Comparing Multiple Proportions, Tests of Independence and Goodness of Fit
Exam 1: Data and Statistics84 Questions
Exam 2: Descriptive Statistics: Tabular and Graphical Displays67 Questions
Exam 3: Descriptive Statistics: Numerical Measures127 Questions
Exam 4: Introduction to Probability99 Questions
Exam 5: Discrete Probability Distributions86 Questions
Exam 6: Continuous Probability Distributions120 Questions
Exam 7: Sampling and Sampling Distributions117 Questions
Exam 8: Interval Estimation144 Questions
Exam 9: Hypothesis Tests129 Questions
Exam 10: Inference About Means and Proportions With Two Populations85 Questions
Exam 11: Inferences About Population Variances85 Questions
Exam 12: Comparing Multiple Proportions, Tests of Independence and Goodness of Fit59 Questions
Exam 13: Experimental Design and Analysis of Variance80 Questions
Exam 14: Simple Linear Regression131 Questions
Exam 15: Multiple Regression103 Questions
Select questions type
When individuals in a sample of 150 were asked whether or not they supported capital punishment, the following information was obtained.  We are interested in determining whether or not the opinions of the individuals (as to Yes, No, and No Opinion) are uniformly distributed.The calculated value for the test statistic equals
Free
(Multiple Choice)
4.8/5  (40)
(40)
Correct Answer: Verified
C
The number of emergency calls per day at a hospital over a period of 120 days is shown below. 
Use α = .05 and the p-value approach to see if the above data have a Poisson distribution.
Use α = .05 and the p-value approach to see if the above data have a Poisson distribution.
Free
(Essay)
4.8/5 (33)
Correct Answer:Verified
χ2 = 4.72; p-value is greater than .1; do not reject H0; no evidence that the distribution is not Poisson.
Shown below is a 2 x 3 table with observed values from a sample of 500.At α = .05 using the critical value approach, test for independence of the row and column factors. 
Free
(Essay)
4.7/5 (24)
Correct Answer:Verified
χ2 = 4.44 < 5.991; no evidence that row and column factors are not independent.
You want to test whether or not the following sample of 30 observations follows a normal distribution.The mean of the sample equals 11.83 and the standard deviation equals 4.53.  At the 5% level of significance, the conclusion of the test is that the
(Multiple Choice)
4.9/5 (42)
In the past, 35% of the students at ABC University were in the Business College, 35% of the students were in the Liberal Arts College, and 30% of the students were in the Education College.To see whether or not the proportions have changed, a sample of 300 students from the university was taken.Ninety of the sample students are in the Business College, 120 are in the Liberal Arts College, and 90 are in the Education College.The expected frequency for the Business College is
(Multiple Choice)
4.7/5 (23)
You want to test whether or not the following sample of 30 observations follows a normal distribution.The mean of the sample equals 11.83 and the standard deviation equals 4.53.  The calculated value for the test statistic equals
(Multiple Choice)
4.8/5 (38)
The degrees of freedom for a data table with 10 rows and 10 columns is
(Multiple Choice)
4.8/5 (40)
From a poll of 800 television viewers, the following data have been accumulated as to their levels of education and their preference of television stations.We are interested in determining if the selection of a TV station is independent of the level of education. 
a.
State the null and alternative hypotheses.
b.
Show the table of the expected frequencies.
c.
Compute the test statistic.
d.
The null hypothesis is to be tested at the 10% level of significance.Determine the critical value for this test.
e.
Determine the p-value and perform the test.
a.
State the null and alternative hypotheses.
b.
Show the table of the expected frequencies.
c.
Compute the test statistic.
d.
The null hypothesis is to be tested at the 10% level of significance.Determine the critical value for this test.
e.
Determine the p-value and perform the test.
(Essay)
4.8/5 (32)
The table below gives beverage preferences for random samples of teens and adults.  We are asked to test for independence between age (i.e., adult and teen) and drink preferences.With a .05 level of significance, the critical value for the test is
(Multiple Choice)
4.8/5 (30)
A major automobile manufacturer claimed that the frequencies of repairs on all five models of its cars are the same.A sample of 200 repair services showed the following frequencies on the various makes of cars. 
At α = .01, test the manufacturer's claim.
At α = .01, test the manufacturer's claim.
(Essay)
4.8/5 (39)
A statistical test conducted to determine whether to reject or not reject a hypothesized probability distribution for a population is known as a _____ test.
(Multiple Choice)
5.0/5 (30)
The following table shows the number of individuals in a sample of 300 who indicated they support the new tax proposal.  We are interested in determining whether or not the opinions of the individuals of the three groups are uniformly distributed.The number of degrees of freedom associated with this problem is
(Multiple Choice)
4.7/5 (41)
The owner of a car wash wants to see if the arrival rate of cars follows a Poisson distribution.In order to test the assumption of a Poisson distribution, a random sample of 150 ten-minute intervals was taken.You are given the following observed frequencies: 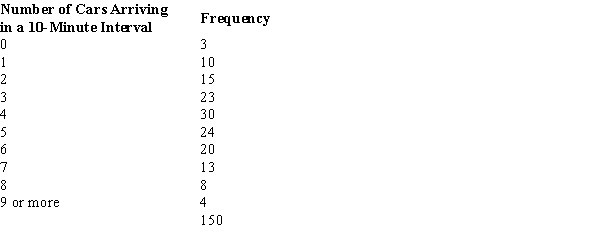 The p-value is
(Multiple Choice)
4.8/5 (43)
You want to test whether or not the following sample of 30 observations follows a normal distribution.The mean of the sample equals 11.83 and the standard deviation equals 4.53.  The p-value is
(Multiple Choice)
4.9/5 (37)
The following table shows the number of individuals in a sample of 300 who indicated they support the new tax proposal.  We are interested in determining whether or not the opinions of the individuals of the three groups are uniformly distributed.The calculated value for the test statistic equals
(Multiple Choice)
4.9/5 (39)
In the past, 35% of the students at ABC University were in the Business College, 35% of the students were in the Liberal Arts College, and 30% of the students were in the Education College.To see whether or not the proportions have changed, a sample of 300 students from the university was taken.Ninety of the sample students are in the Business College, 120 are in the Liberal Arts College, and 90 are in the Education College.Using α = .05, the conclusion of the test is that the
(Multiple Choice)
4.8/5 (26)
Marascuilo procedure is used to test for a significant difference between pairs of population
(Multiple Choice)
4.9/5 (26)
The degrees of freedom for a data table with 10 rows and 11 columns is
(Multiple Choice)
4.8/5 (33)
Filters
- Essay(0)
- Multiple Choice(0)
- Short Answer(0)
- True False(0)
- Matching(0)