Deck 8: Sampling Variability and Sampling Distributions
Full screen (f)
Question
According to internal testing done by the Get-A-Grip tire company, the mean lifetime of tires sold on new cars is 23,000 miles, with a standard deviation of 2,500 miles.
a) If the claim by Get-A-Grip is true, what is the mean of the sampling distribution of for samples of size n = 4?
b) If the claim by Get-A-Grip is true, what is the standard deviation of the sampling distribution of for samples of size n = 4?
c) If the distribution of tire life is approximately normal, what is the probability that the mean of a random sample of size n = 4 of tire lifetimes will be less than 20,000 miles?
a) If the claim by Get-A-Grip is true, what is the mean of the sampling distribution of
for samples of size n = 4? b) If the claim by Get-A-Grip is true, what is the standard deviation of the sampling distribution of
for samples of size n = 4? c) If the distribution of tire life is approximately normal, what is the probability that the mean of a random sample of size n = 4 of tire lifetimes will be less than 20,000 miles?
Question
Question
Question
Question
The standard deviation of the distribution of  decreases as n increases.
decreases as n increases. Question
The distribution of  is normal if the population is normal.
is normal if the population is normal. Question
You will be asked to sketch curves representing the distributions of a set of data, as well as the sampling distributions of the mean under different conditions. You need not get these graphs perfectly correct, but should clearly indicate different aspects of the curves, such as location, variability, and shape. A very large study of college freshmen study habits found that the time (in hours) that freshmen study each week is approximately normal with mean 24 hours and standard deviation 8 hours. Consider random samples of size 16 from the population of freshmen.
a) On the axes below, sketch curves representing the distribution of the original population and the sampling distribution of for a sample of size n = 16.
b) What is the probability that a sample of size n = 16 from this population would result in a sample mean greater than 30 hours?
c) The study of college freshmen also asked about the students' time spent playing video games, and a relative frequency histogram of the results appears below. The mean amount of time spent playing video games was 0.8 hours per week.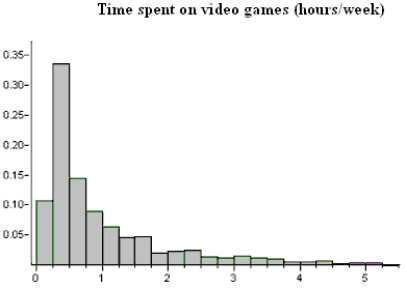 Suppose we were to take a random sample, n = 4, from this population of freshmen and ask them how much time they spent playing video games per week. Describe the shape, center, and spread of the sampling distribution of
  .
.
a) On the axes below, sketch curves representing the distribution of the original population and the sampling distribution of
for a sample of size n = 16. b) What is the probability that a sample of size n = 16 from this population would result in a sample mean greater than 30 hours?
c) The study of college freshmen also asked about the students' time spent playing video games, and a relative frequency histogram of the results appears below. The mean amount of time spent playing video games was 0.8 hours per week.
Suppose we were to take a random sample, n = 4, from this population of freshmen and ask them how much time they spent playing video games per week. Describe the shape, center, and spread of the sampling distribution of . Question
How are the quantities,  and
and  , related?
and , related? Question
Question
Question
The principal at John F. Kennedy High School has been asked to provide the average number of classes taken by the students at KHS. Since the computer system is down, she takes her alphabetized list of students, randomly selects 50 students, determines the number of classes each of the 50 selected students is taking, and calculates  . She then reports to the PTA "Since I took a large random sample, the population mean number of classes taken by the students at KHS is 5.4." Write a short paragraph to send to her that explains why her statement is not correct.
. She then reports to the PTA "Since I took a large random sample, the population mean number of classes taken by the students at KHS is 5.4." Write a short paragraph to send to her that explains why her statement is not correct. Question
Question
How are the quantities,  and
and  , related?
and , related? Question
The distribution of  will always have the same shape as the distribution of the population being sampled.
will always have the same shape as the distribution of the population being sampled. Question
Suppose we artificially categorize populations as approximately normal or not, and samples as large or small. This categorization results in 4 categories:
a) Small samples from an approximately normal population
b) Large samples from an approximately normal population
c) Small samples from a population that is not approximately normal
d) Large samples from a population that is not approximately normal What, if anything, can be said about the shape of the sampling distribution of for each of these 4 situations?
a) Small samples from an approximately normal population
b) Large samples from an approximately normal population
c) Small samples from a population that is not approximately normal
d) Large samples from a population that is not approximately normal What, if anything, can be said about the shape of the sampling distribution of
for each of these 4 situations? Question
For n sufficiently large, the distribution of  is approximately a standard normal distribution.
is approximately a standard normal distribution. Question
Question
According to internal testing done by the HardCore Apple Company, the mean firmness of their apples, as measured on the Mohs hardness scale is 7.0, with a standard deviation of 0.3.
a) If the claim by Hardcore is true, what is the mean of the sampling distribution of for samples of size n = 16?
b) If the claim by HardCore is true, what is the standard deviation of the sampling distribution of for samples of size n = 16?
c) If the distribution of HardCore firmness is approximately normal, and their claim about the mean firmness is true, what is the probability that the mean firmness of a random sample of size n = 16 will be less than 6.9?
a) If the claim by Hardcore is true, what is the mean of the sampling distribution of
for samples of size n = 16? b) If the claim by HardCore is true, what is the standard deviation of the sampling distribution of
for samples of size n = 16? c) If the distribution of HardCore firmness is approximately normal, and their claim about the mean firmness is true, what is the probability that the mean firmness of a random sample of size n = 16 will be less than 6.9?
Question
As n grows larger, the mean of the sampling distribution of  gets closer to μ.
gets closer to μ. Question
Question
Consider the following "population": {2, 2, 4, 5}. Suppose that a random sample of size n = 2 is to be selected without replacement from this population. There are 6 possible samples (since the order of selection does not matter). Compute the sample mean for each of these samples and use that information to construct the sampling distribution of  . (Display it in table form.)
. (Display it in table form.) Question
Question
Question
Question
You will be asked to sketch curves representing the distributions of a set of data, as well as the sampling distributions of the mean under different conditions. You need not get these graphs perfectly correct, but should clearly indicate different aspects of the curves, such as location, variability, and shape. The State Fisheries Department wishes to stock the Styx River with fish, and would like the species to not only survive but thrive. (The "substrate" of a river is an important determinant of the quality of spawning habitat.) The pebble diameters in the river are approximately normally distributed with a mean of 24 mm, and a standard deviation of 8 mm. The Fisheries people will select a random sample of pebbles from the Styx River in an attempt to judge the average pebble size.
a) On the scale below, sketch curves representing the distribution of the original population and the sampling distribution of for a sample of size n = 16.
b) What is the approximate probability that a sample of n = 16 from this population would result in a sample mean greater than 30 mm?
c) Another issue that must be considered in stocking a river with fish is that not only natural predators of the fish, but fishermen and fisherwomen (fisherpersons?) will be taking fish from the river, and thus driving the population down. The graph below is a relative frequency histogram of the lengths of the gentle Hecate fish in the Styx River, as recorded during a massive fish tagging survey. The mean length for these fish was 0.8 feet.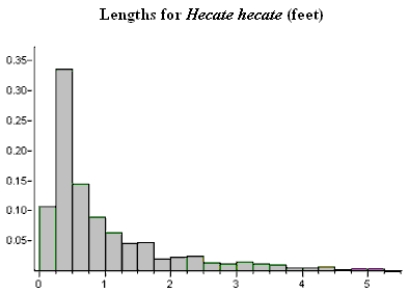 Suppose we were to take a random sample, n = 4, from this population of fish and measure their lengths. Describe the shape, center, and spread of the sampling distribution of
  .
.
a) On the scale below, sketch curves representing the distribution of the original population and the sampling distribution of
for a sample of size n = 16. b) What is the approximate probability that a sample of n = 16 from this population would result in a sample mean greater than 30 mm?
c) Another issue that must be considered in stocking a river with fish is that not only natural predators of the fish, but fishermen and fisherwomen (fisherpersons?) will be taking fish from the river, and thus driving the population down. The graph below is a relative frequency histogram of the lengths of the gentle Hecate fish in the Styx River, as recorded during a massive fish tagging survey. The mean length for these fish was 0.8 feet.
Suppose we were to take a random sample, n = 4, from this population of fish and measure their lengths. Describe the shape, center, and spread of the sampling distribution of . Question
Question
Consider the following "population": {1, 1, 3, 4}. Suppose that a random sample of size n = 2 is to be selected without replacement from this population. There are 6 possible samples (since the order of selection does not matter). Compute the sample mean for each of these samples and use that information to construct the sampling distribution of  . (Display it in table form.)
. (Display it in table form.)
Unlock Deck
Sign up to unlock the cards in this deck!
Unlock Deck
Unlock Deck
1/27
Play
Full screen (f)
Deck 8: Sampling Variability and Sampling Distributions
1
According to internal testing done by the Get-A-Grip tire company, the mean lifetime of tires sold on new cars is 23,000 miles, with a standard deviation of 2,500 miles.
a) If the claim by Get-A-Grip is true, what is the mean of the sampling distribution of for samples of size n = 4?
b) If the claim by Get-A-Grip is true, what is the standard deviation of the sampling distribution of for samples of size n = 4?
c) If the distribution of tire life is approximately normal, what is the probability that the mean of a random sample of size n = 4 of tire lifetimes will be less than 20,000 miles?
a) If the claim by Get-A-Grip is true, what is the mean of the sampling distribution of
for samples of size n = 4? b) If the claim by Get-A-Grip is true, what is the standard deviation of the sampling distribution of
for samples of size n = 4? c) If the distribution of tire life is approximately normal, what is the probability that the mean of a random sample of size n = 4 of tire lifetimes will be less than 20,000 miles?
a) 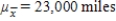
b)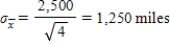
c)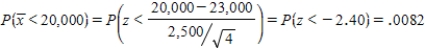
b)
c)
2
What is a sampling distribution of a statistic?
The distribution of the possible values of a statistic is called its sampling distribution. Note: Generally if the student communicates the idea that the sampling distribution associates different values of the statistic with their probabilities, he or she should get credit.
3
The closer π is to 0 or 1, the larger n must be in order for the distribution of p to be approximately normal.
True
4
The sampling distribution of p tends to be more spread out for larger sample sizes than for smaller sample sizes.
Unlock Deck
Unlock for access to all 27 flashcards in this deck.
Unlock Deck
k this deck
5
The standard deviation of the distribution of decreases as n increases.
decreases as n increases. Unlock Deck
Unlock for access to all 27 flashcards in this deck.
Unlock Deck
k this deck
6
The distribution of is normal if the population is normal.
is normal if the population is normal. Unlock Deck
Unlock for access to all 27 flashcards in this deck.
Unlock Deck
k this deck
7
You will be asked to sketch curves representing the distributions of a set of data, as well as the sampling distributions of the mean under different conditions. You need not get these graphs perfectly correct, but should clearly indicate different aspects of the curves, such as location, variability, and shape. A very large study of college freshmen study habits found that the time (in hours) that freshmen study each week is approximately normal with mean 24 hours and standard deviation 8 hours. Consider random samples of size 16 from the population of freshmen.
a) On the axes below, sketch curves representing the distribution of the original population and the sampling distribution of for a sample of size n = 16.
b) What is the probability that a sample of size n = 16 from this population would result in a sample mean greater than 30 hours?
c) The study of college freshmen also asked about the students' time spent playing video games, and a relative frequency histogram of the results appears below. The mean amount of time spent playing video games was 0.8 hours per week. Suppose we were to take a random sample, n = 4, from this population of freshmen and ask them how much time they spent playing video games per week. Describe the shape, center, and spread of the sampling distribution of .
a) On the axes below, sketch curves representing the distribution of the original population and the sampling distribution of
for a sample of size n = 16. b) What is the probability that a sample of size n = 16 from this population would result in a sample mean greater than 30 hours?
c) The study of college freshmen also asked about the students' time spent playing video games, and a relative frequency histogram of the results appears below. The mean amount of time spent playing video games was 0.8 hours per week.
Suppose we were to take a random sample, n = 4, from this population of freshmen and ask them how much time they spent playing video games per week. Describe the shape, center, and spread of the sampling distribution of . Unlock Deck
Unlock for access to all 27 flashcards in this deck.
Unlock Deck
k this deck
8
How are the quantities, and , related?
and , related? Unlock Deck
Unlock for access to all 27 flashcards in this deck.
Unlock Deck
k this deck
9
One method for estimating abundance of animals is known as line-intercept sampling. The theory of this method, when applied to Alaskan wolverines, predicts that π = 0.453 of attempts to locate wolverine tracks should be successful. Suppose that biologists will make 100 attempts to locate wolverine tracks in random locations in Alaska.
a) Show that this sample size is large enough to justify using the normal approximation to the sampling distribution of p.
b) What is the mean of the sampling distribution of p if the theory of line-intercept sampling is correct?
c) What is the standard deviation of the sampling distribution of p if the theory of line-intercept sampling is correct?
d) If the theory of line-intercept sampling is correct, what is the probability that a sample proportion, p, would differ from π = 0.453 by as much as 0.05?
Unlock Deck
Unlock for access to all 27 flashcards in this deck.
Unlock Deck
k this deck
10
If π = 0.90, a sample size of n = 10 is large enough for the sampling distribution to be well approximated by a normal distribution.
Unlock Deck
Unlock for access to all 27 flashcards in this deck.
Unlock Deck
k this deck
11
The principal at John F. Kennedy High School has been asked to provide the average number of classes taken by the students at KHS. Since the computer system is down, she takes her alphabetized list of students, randomly selects 50 students, determines the number of classes each of the 50 selected students is taking, and calculates . She then reports to the PTA "Since I took a large random sample, the population mean number of classes taken by the students at KHS is 5.4." Write a short paragraph to send to her that explains why her statement is not correct.
. She then reports to the PTA "Since I took a large random sample, the population mean number of classes taken by the students at KHS is 5.4." Write a short paragraph to send to her that explains why her statement is not correct. Unlock Deck
Unlock for access to all 27 flashcards in this deck.
Unlock Deck
k this deck
12
A statistic is a characteristic of the population.
Unlock Deck
Unlock for access to all 27 flashcards in this deck.
Unlock Deck
k this deck
13
How are the quantities, and , related?
and , related? Unlock Deck
Unlock for access to all 27 flashcards in this deck.
Unlock Deck
k this deck
14
The distribution of will always have the same shape as the distribution of the population being sampled.
will always have the same shape as the distribution of the population being sampled. Unlock Deck
Unlock for access to all 27 flashcards in this deck.
Unlock Deck
k this deck
15
Suppose we artificially categorize populations as approximately normal or not, and samples as large or small. This categorization results in 4 categories:
a) Small samples from an approximately normal population
b) Large samples from an approximately normal population
c) Small samples from a population that is not approximately normal
d) Large samples from a population that is not approximately normal What, if anything, can be said about the shape of the sampling distribution of for each of these 4 situations?
a) Small samples from an approximately normal population
b) Large samples from an approximately normal population
c) Small samples from a population that is not approximately normal
d) Large samples from a population that is not approximately normal What, if anything, can be said about the shape of the sampling distribution of
for each of these 4 situations? Unlock Deck
Unlock for access to all 27 flashcards in this deck.
Unlock Deck
k this deck
16
For n sufficiently large, the distribution of is approximately a standard normal distribution.
is approximately a standard normal distribution. Unlock Deck
Unlock for access to all 27 flashcards in this deck.
Unlock Deck
k this deck
17
One method for estimating the availability of office space in large cities is to conduct a random sample of offices, and calculate the proportion of offices currently being used. Suppose that real estate agents believe that π = 0.70 of all offices are currently occupied, and decide to take a sample to assess their belief. They are considering a sample size of n = 40.
a) Show that this sample size is large enough to justify using the normal approximation to the sampling distribution of p.
b) What is the mean of the sampling distribution of p if the real estate agents are correct? c) What is the standard deviation of the sampling distribution of p if the real estate agents are correct?
d) If the real estate agents are correct, what is the probability that a sample proportion, p, would differ from π = 0.70 by as much as 0.05?
Unlock Deck
Unlock for access to all 27 flashcards in this deck.
Unlock Deck
k this deck
18
According to internal testing done by the HardCore Apple Company, the mean firmness of their apples, as measured on the Mohs hardness scale is 7.0, with a standard deviation of 0.3.
a) If the claim by Hardcore is true, what is the mean of the sampling distribution of for samples of size n = 16?
b) If the claim by HardCore is true, what is the standard deviation of the sampling distribution of for samples of size n = 16?
c) If the distribution of HardCore firmness is approximately normal, and their claim about the mean firmness is true, what is the probability that the mean firmness of a random sample of size n = 16 will be less than 6.9?
a) If the claim by Hardcore is true, what is the mean of the sampling distribution of
for samples of size n = 16? b) If the claim by HardCore is true, what is the standard deviation of the sampling distribution of
for samples of size n = 16? c) If the distribution of HardCore firmness is approximately normal, and their claim about the mean firmness is true, what is the probability that the mean firmness of a random sample of size n = 16 will be less than 6.9?
Unlock Deck
Unlock for access to all 27 flashcards in this deck.
Unlock Deck
k this deck
19
As n grows larger, the mean of the sampling distribution of gets closer to μ.
gets closer to μ. Unlock Deck
Unlock for access to all 27 flashcards in this deck.
Unlock Deck
k this deck
20
The mean of the sampling distribution of p is π no matter how large n is.
Unlock Deck
Unlock for access to all 27 flashcards in this deck.
Unlock Deck
k this deck
21
Consider the following "population": {2, 2, 4, 5}. Suppose that a random sample of size n = 2 is to be selected without replacement from this population. There are 6 possible samples (since the order of selection does not matter). Compute the sample mean for each of these samples and use that information to construct the sampling distribution of . (Display it in table form.)
. (Display it in table form.) Unlock Deck
Unlock for access to all 27 flashcards in this deck.
Unlock Deck
k this deck
22
The principal at Thomas Jefferson High School has been asked to estimate the proportion of students at KHS who drive to school and use the school parking lot. He takes a random sample of size n = 32 students and calculates a sample proportion, p = 0.8. "Now," he exclaims, "since my sample size is greater than 30, the sampling distribution of the sample proportion is approximately normal." Write a short paragraph that explains why his statement is not correct.
Unlock Deck
Unlock for access to all 27 flashcards in this deck.
Unlock Deck
k this deck
23
Consider a sample from a skewed population. What is the minimum sample size to apply the Central Limit Theorem?
A) 5
B) 10
C) 30
D) 100
E) 300
A) 5
B) 10
C) 30
D) 100
E) 300
Unlock Deck
Unlock for access to all 27 flashcards in this deck.
Unlock Deck
k this deck
24
Some biologists believe the evolution of handedness is linked to complex behaviors such as tool-use. Under this theory, handedness would be genetically passed on from parents to children. That is, left-handed parents would be more likely to have left-handed children than right-handed parents. An alternate theory asserts that handedness should be random, with left- and right-handedness equally likely. In a recent study using a simple random sample of n = 76 right-handed parents, 50 of the children born were right-handed. (p = 0.658.) Suppose handedness is a random occurrence with either hand equally likely to be dominant, implying that the probability of a right-handed offspring is π = 0.50.
a) Show that it is reasonable to approximate the sampling distribution of p using a normal distribution.
b) Assuming left- and right-handed children are equally likely from right-handed parents, what is the probability of observing a sample proportion of at least p = 0.658?
a) Show that it is reasonable to approximate the sampling distribution of p using a normal distribution.
b) Assuming left- and right-handed children are equally likely from right-handed parents, what is the probability of observing a sample proportion of at least p = 0.658?
Unlock Deck
Unlock for access to all 27 flashcards in this deck.
Unlock Deck
k this deck
25
You will be asked to sketch curves representing the distributions of a set of data, as well as the sampling distributions of the mean under different conditions. You need not get these graphs perfectly correct, but should clearly indicate different aspects of the curves, such as location, variability, and shape. The State Fisheries Department wishes to stock the Styx River with fish, and would like the species to not only survive but thrive. (The "substrate" of a river is an important determinant of the quality of spawning habitat.) The pebble diameters in the river are approximately normally distributed with a mean of 24 mm, and a standard deviation of 8 mm. The Fisheries people will select a random sample of pebbles from the Styx River in an attempt to judge the average pebble size.
a) On the scale below, sketch curves representing the distribution of the original population and the sampling distribution of for a sample of size n = 16.
b) What is the approximate probability that a sample of n = 16 from this population would result in a sample mean greater than 30 mm?
c) Another issue that must be considered in stocking a river with fish is that not only natural predators of the fish, but fishermen and fisherwomen (fisherpersons?) will be taking fish from the river, and thus driving the population down. The graph below is a relative frequency histogram of the lengths of the gentle Hecate fish in the Styx River, as recorded during a massive fish tagging survey. The mean length for these fish was 0.8 feet. Suppose we were to take a random sample, n = 4, from this population of fish and measure their lengths. Describe the shape, center, and spread of the sampling distribution of .
a) On the scale below, sketch curves representing the distribution of the original population and the sampling distribution of
for a sample of size n = 16. b) What is the approximate probability that a sample of n = 16 from this population would result in a sample mean greater than 30 mm?
c) Another issue that must be considered in stocking a river with fish is that not only natural predators of the fish, but fishermen and fisherwomen (fisherpersons?) will be taking fish from the river, and thus driving the population down. The graph below is a relative frequency histogram of the lengths of the gentle Hecate fish in the Styx River, as recorded during a massive fish tagging survey. The mean length for these fish was 0.8 feet.
Suppose we were to take a random sample, n = 4, from this population of fish and measure their lengths. Describe the shape, center, and spread of the sampling distribution of . Unlock Deck
Unlock for access to all 27 flashcards in this deck.
Unlock Deck
k this deck
26
The first large-scale study of the human sex ratio involved over 6,000 families each having 12 children. (This was done in 19th Century Germany--large families were more common then and there.) 52% of the children they observed were boys. Suppose that 21st Century researchers wish to replicate this observational study. In order to see if this proportion of boys might have changed in the intervening years, suppose the researchers track down 50 families with 12 children. From these 600 children, a random sample of 50 children is taken. 30 of the 50 children were boys (p = 0.6.)
a) Show that it is reasonable to approximate the sampling distribution of p using a normal distribution.
b) If the modern true population proportion of newborn boys is π = 0.52, what is the probability of observing a sample proportion of at least p = 0.6?
a) Show that it is reasonable to approximate the sampling distribution of p using a normal distribution.
b) If the modern true population proportion of newborn boys is π = 0.52, what is the probability of observing a sample proportion of at least p = 0.6?
Unlock Deck
Unlock for access to all 27 flashcards in this deck.
Unlock Deck
k this deck
27
Consider the following "population": {1, 1, 3, 4}. Suppose that a random sample of size n = 2 is to be selected without replacement from this population. There are 6 possible samples (since the order of selection does not matter). Compute the sample mean for each of these samples and use that information to construct the sampling distribution of . (Display it in table form.)
. (Display it in table form.) Unlock Deck
Unlock for access to all 27 flashcards in this deck.
Unlock Deck
k this deck
Unlock Deck
Unlock for access to all 27 flashcards in this deck.


