Deck 15: Analysis of Variance
Full screen (f)
Question
Question
Question
Question
Question
Question
Question
Question
Question
Question
Question
Question
Question
Question
When the discrepancies between the values of the  's in a single-factor ANOVA can be attributed to sampling variability, the H0 : μ1 = μ2 = ... = μk should be rejected.
's in a single-factor ANOVA can be attributed to sampling variability, the H0 : μ1 = μ2 = ... = μk should be rejected. Question
In a randomized block design, the test statistic for testing the equality of the treatment means is  .
.
. Question
Question
Question
Question
The test statistic for testing the equality of population means in a single-factor ANOVA is  .
.
. Question
Question
A study investigating the effectiveness of 4 different brands of mosquito repellent was performed as a completely randomized design. The results of the experiment are given in the table below for the response variable y = the length of effectiveness of a single application of mosquito repellent. 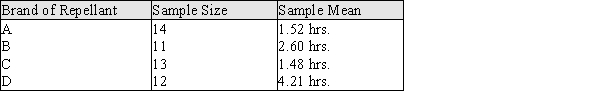 SSE = 115.2
a) Construct ANOVA table for this experiment.
b) Test the equality of the means of the four different brands of mosquito repellent at the .05 level.
c) Using the 95% Tukey-Kramer procedure determine which pairs of means are significantly different.
SSE = 115.2 a) Construct ANOVA table for this experiment.
b) Test the equality of the means of the four different brands of mosquito repellent at the .05 level.
c) Using the 95% Tukey-Kramer procedure determine which pairs of means are significantly different.
Question
A construction engineer has designed an experiment to investigate 3 different types of pressure treatment that can be applied to raw lumber. The experiment was conducted as a completely randomized design in which 30 pieces of raw lumber were selected with 10 assigned at random to each of the three pressure treatments. The response variable was water repellency. The sample means and the sum of squared error are given below. 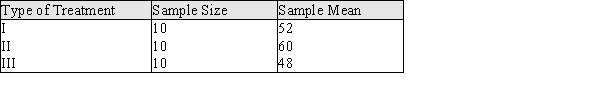 SSE = 168.2
a) Construct the ANOVA table for this experiment.
b) Test the equality of the means of the three different treatments using a .05 significance level.
c) Using the 95% Tukey-Kramer procedure determine which pairs of means are significantly different.
SSE = 168.2 a) Construct the ANOVA table for this experiment.
b) Test the equality of the means of the three different treatments using a .05 significance level.
c) Using the 95% Tukey-Kramer procedure determine which pairs of means are significantly different.
Question
Question
Question
Question
The following Tukey-Kramer summary is from a single-factor ANOVA experiment, with treatments A, B, C, and D. Tukey-Kramer summary given below for a single-factor ANOVA. Interpret these multiple comparisons for this experiment. 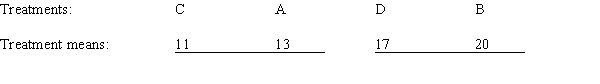
Question
The following partial ANOVA table was based on a randomized block experiment with 5 treatments and 5 blocks. 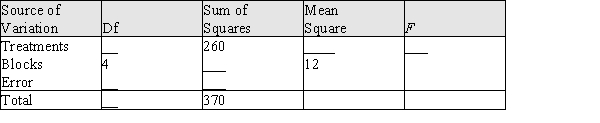 a) Fill in the missing entries in the ANOVA table. b) Test the equality of the treatment means using a .05 significance level. c) If the five treatment means are
  use the 95% Tukey-Kramer procedure to determine which means differ.
a) Fill in the missing entries in the ANOVA table. b) Test the equality of the treatment means using a .05 significance level. c) If the five treatment means are use the 95% Tukey-Kramer procedure to determine which means differ. Question
The following partial ANOVA table was based on an experiment performed as a two-factor design with 2 levels of factor A, 3 levels of factor B, and 5 observations on each treatment. 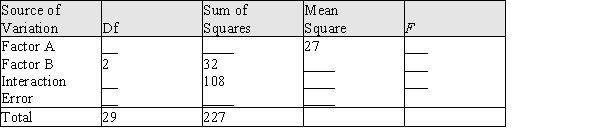 a) Fill in the missing entries in the ANOVA table. b) First test the hypothesis of no interaction between the factors at the .05 level. If appropriate, perform tests of the main effects for the two factors also.
a) Fill in the missing entries in the ANOVA table. b) First test the hypothesis of no interaction between the factors at the .05 level. If appropriate, perform tests of the main effects for the two factors also. Question
In a study of the effects of rewards on learning in statistics students, an experimenter divided 20 students into 4 groups of equal sizes using random assignment to the groups. Each student was given a computer-generated statistics test. The students were rewarded with jelly beans as they took the test. The investigators observed the total number of correct answers on the test. The treatments were as follows: 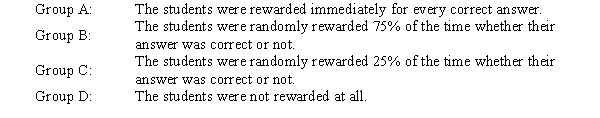 The following table contains summary information for this experiment.
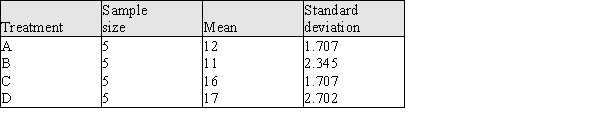
a) Construct the appropriate ANOVA table and test the hypothesis that there is no difference between the mean number of correct answers for the four treatments for the population of statistics students from which this sample was taken.
b) Is there evidence that the 25% random reward schedule and the 75% random reward schedule result in different achievement? Give statistical evidence to support your answer.
The following table contains summary information for this experiment. a) Construct the appropriate ANOVA table and test the hypothesis that there is no difference between the mean number of correct answers for the four treatments for the population of statistics students from which this sample was taken.
b) Is there evidence that the 25% random reward schedule and the 75% random reward schedule result in different achievement? Give statistical evidence to support your answer.
Question
Question
In a study of the effects of rewards on learning in rats, an experimenter divided 20 rats into 4 groups of equal sizes. Each rat was run through a maze, and there was only one correct method of exiting the maze. The rats were rewarded on different schedules. The investigators observed the number of trials it took the rats to learn the maze.
Group A: The rats were rewarded for every correct direction chosen in the maze
Group B: The rats were randomly rewarded 75% of the time
Group C: The rats were randomly rewarded 25% of the time
Group D: The rats were not rewarded at all.
The following table contains summary information for this experiment.
a) Construct the appropriate ANOVA table and test the hypothesis that there is no difference between the mean number of trials needed to learn the maze for the different reward treatments.
b) Is there evidence that the 25% random reward schedule and the 75% random reward schedule result in a different mean number of trials to learn the maze? Give statistical evidence to support your answer.
Question
A veterinarian is studying three different medications that could be used in the prevention of heartworm in young puppies. She has acquired for study four different litters of cocker spaniels, and 3 puppies were randomly selected from each litter. The three selected puppies from a litter were then randomly assigned to one of the four treatments. The data below represents the number of months after a single treatment before the initial onset of heartworm in the puppies for this randomized block design. 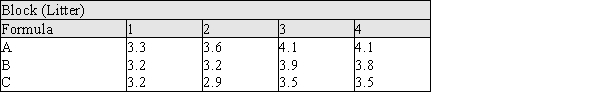 a) Construct the ANOVA table for this experiment. b) Test the equality of the mean time to onset of heartworm for the three different medications at the .05 level. c) Using the 95% Tukey-Kramer procedure determine which of the treatment means are significantly different.
a) Construct the ANOVA table for this experiment. b) Test the equality of the mean time to onset of heartworm for the three different medications at the .05 level. c) Using the 95% Tukey-Kramer procedure determine which of the treatment means are significantly different. Question
A dairy scientist is studying three different formulas that could be used in producing low fat cheese. The experimental process involves mixing the basic cheese ingredients in 4 different vats (blocks) and then splitting the mixture from each vat into three different batches. Additives are added to each of the batches according to each of the three formulas resulting in a round of low fat cheese. The data below represents the fat content (in grams per ounce) of the resulting rounds of cheese for this randomized block design. 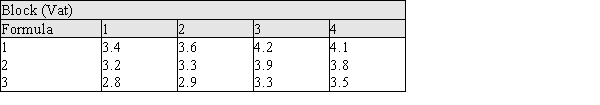
a) Construct the ANOVA table for this experiment.
b) Test the equality of the mean fat content for the three different low fat cheese formulas at the .05 level.
c) Using the 95% Tukey-Kramer procedure determine which of the treatment means are significantly different.
a) Construct the ANOVA table for this experiment.
b) Test the equality of the mean fat content for the three different low fat cheese formulas at the .05 level.
c) Using the 95% Tukey-Kramer procedure determine which of the treatment means are significantly different.
Question
Question
Nutritionists study the impact of four different diets on women's vulnerability to vitamin B6 deficiency. The researchers randomly assigned adult women to one of four groups. Each group followed a specific diet. Let µ1, µ2, µ3, and µ4 represent the mean daily intake of vitamin B6 (in mg) for diets 1, 2, 3, and 4, respectively. The sample data are given in the table below. Use the 95% Tukey-Kramer procedure to identify the correct statement describing the differences among the diets. 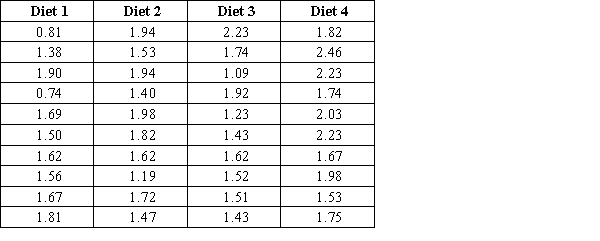
A) µ1 is significantly different from µ3 and there are no other significant differences.
B) µ4 is significantly different from both µ1 and µ3, and there are no other significant differences.
C) µ2 and µ4 are significantly different from µ1 and µ3. There are no other significant differences.
D) µ1 is significantly different from µ4 and there are no other significant differences.
E) µ2 is significantly different from both µ1 and µ3, and there are no other significant differences.
Question
The supermarket chain chooses a new logo from the three proposed options. A control group of 20 people scores the logos, which are shown in a random order, on a ten-point scale of attractiveness. Let µ1, µ2, and µ3 represent the mean scores for logos 1, 2, and 3 respectively. After using a multiple comparison procedure, the results were announced: The rating of logo 3 significantly differs from the ratings of logo 1. The rating of logo 1 is approximately equal to the rating of logo 2. The rating of logo 2 significantly differs from the ratings of logo 3. Which of the following sets of Tukey-Kramer intervals is consistent with the conclusions?
A)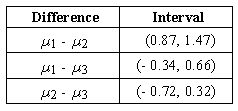
B)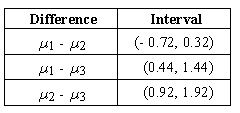
C)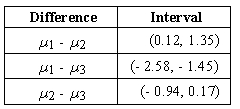
D)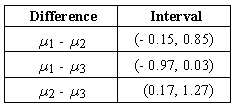
E)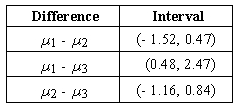
A)
B)
C)
D)
E)
Question
Question
In an experiment on anticipated test performance, males and females were given an algebra test. Before they took the test, they were told that based on their past performance they were expected to score "above average", "about average", or "below average," the level of expected performance being randomly chosen. The subjects scores on the tests were then analyzed using ANOVA. Each gender by encouragement combination had 10 individuals for a total of 60. 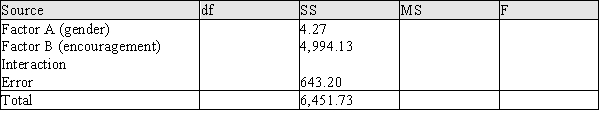
a) Complete the table above.
b) At .05 the level of significance, does there appear to be an interaction between gender and encouragement?
a) Complete the table above.
b) At .05 the level of significance, does there appear to be an interaction between gender and encouragement?
Question
Question

Unlock Deck
Sign up to unlock the cards in this deck!
Unlock Deck
Unlock Deck
1/40
Play
Full screen (f)
Deck 15: Analysis of Variance
1
The Tukey-Kramer procedure can only be used in an ANOVA for a completely randomized design.
False
2
The fundamental identity in a two-factor ANOVA is SSTo = SSA + SSB +SSE.
False
3
When using the 95% Tukey-Kramer procedure, in the long run only about 5% of time would at least one of the intervals not include the value that is being estimated.
True
4
In a two-factor ANOVA with k levels of factor A and l levels of factor B, the number of treatment combinations is k + l.
Unlock Deck
Unlock for access to all 40 flashcards in this deck.
Unlock Deck
k this deck
5
The objective of a single-factor analysis of variance for k populations is to test the equality of the k population variances.
Unlock Deck
Unlock for access to all 40 flashcards in this deck.
Unlock Deck
k this deck
6
Homogeneous groups of experimental units are called blocks.
Unlock Deck
Unlock for access to all 40 flashcards in this deck.
Unlock Deck
k this deck
7
The P-value associated with the calculated F value in an ANOVA is the area to the right of the calculated value under an F distribution curve.
Unlock Deck
Unlock for access to all 40 flashcards in this deck.
Unlock Deck
k this deck
8
MSTr and MSE are statistics.
Unlock Deck
Unlock for access to all 40 flashcards in this deck.
Unlock Deck
k this deck
9
As long as the other assumptions are plausible, the F test for testing the equality of population means in an ANOVA can be safely used when the largest sample standard deviation is no more than twice the smallest standard deviation.
Unlock Deck
Unlock for access to all 40 flashcards in this deck.
Unlock Deck
k this deck
10
The fundamental identity for a single-factor ANOVA is MSTo = MSTr + MSE.
Unlock Deck
Unlock for access to all 40 flashcards in this deck.
Unlock Deck
k this deck
11
SSE measures the within-sample variability.
Unlock Deck
Unlock for access to all 40 flashcards in this deck.
Unlock Deck
k this deck
12
The Tukey-Kramer procedure controls the simultaneous confidence level.
Unlock Deck
Unlock for access to all 40 flashcards in this deck.
Unlock Deck
k this deck
13
In a randomized block design having 10 treatments and 5 blocks with each treatment occurring once in each block, there are 36 degrees of freedom for the error source of variation.
Unlock Deck
Unlock for access to all 40 flashcards in this deck.
Unlock Deck
k this deck
14
When the discrepancies between the values of the 's in a single-factor ANOVA can be attributed to sampling variability, the H0 : μ1 = μ2 = ... = μk should be rejected.
's in a single-factor ANOVA can be attributed to sampling variability, the H0 : μ1 = μ2 = ... = μk should be rejected. Unlock Deck
Unlock for access to all 40 flashcards in this deck.
Unlock Deck
k this deck
15
In a randomized block design, the test statistic for testing the equality of the treatment means is .
. Unlock Deck
Unlock for access to all 40 flashcards in this deck.
Unlock Deck
k this deck
16
When using the Tukey-Kramer multiple comparison procedure, if the confidence interval for μ1 − μ2 contains 0 then μ1 and μ2 are declared to be significantly different.
Unlock Deck
Unlock for access to all 40 flashcards in this deck.
Unlock Deck
k this deck
17
If H0 : μ1 = μ2 = ... = μk is true, then μMSTr = μMSE.
Unlock Deck
Unlock for access to all 40 flashcards in this deck.
Unlock Deck
k this deck
18
A comparison of the treatments based on independently selected experimental units that are randomly assigned to treatments is referred to as a completely randomized design.
Unlock Deck
Unlock for access to all 40 flashcards in this deck.
Unlock Deck
k this deck
19
The test statistic for testing the equality of population means in a single-factor ANOVA is .
. Unlock Deck
Unlock for access to all 40 flashcards in this deck.
Unlock Deck
k this deck
20
In a two-factor ANOVA the main effects of factors A and B should be tested before testing for the presence of the interaction.
Unlock Deck
Unlock for access to all 40 flashcards in this deck.
Unlock Deck
k this deck
21
A study investigating the effectiveness of 4 different brands of mosquito repellent was performed as a completely randomized design. The results of the experiment are given in the table below for the response variable y = the length of effectiveness of a single application of mosquito repellent. SSE = 115.2
a) Construct ANOVA table for this experiment.
b) Test the equality of the means of the four different brands of mosquito repellent at the .05 level.
c) Using the 95% Tukey-Kramer procedure determine which pairs of means are significantly different.
SSE = 115.2 a) Construct ANOVA table for this experiment.
b) Test the equality of the means of the four different brands of mosquito repellent at the .05 level.
c) Using the 95% Tukey-Kramer procedure determine which pairs of means are significantly different.
Unlock Deck
Unlock for access to all 40 flashcards in this deck.
Unlock Deck
k this deck
22
A construction engineer has designed an experiment to investigate 3 different types of pressure treatment that can be applied to raw lumber. The experiment was conducted as a completely randomized design in which 30 pieces of raw lumber were selected with 10 assigned at random to each of the three pressure treatments. The response variable was water repellency. The sample means and the sum of squared error are given below. SSE = 168.2
a) Construct the ANOVA table for this experiment.
b) Test the equality of the means of the three different treatments using a .05 significance level.
c) Using the 95% Tukey-Kramer procedure determine which pairs of means are significantly different.
SSE = 168.2 a) Construct the ANOVA table for this experiment.
b) Test the equality of the means of the three different treatments using a .05 significance level.
c) Using the 95% Tukey-Kramer procedure determine which pairs of means are significantly different.
Unlock Deck
Unlock for access to all 40 flashcards in this deck.
Unlock Deck
k this deck
23
What are the assumptions of the two-factor ANOVA F tests?
Unlock Deck
Unlock for access to all 40 flashcards in this deck.
Unlock Deck
k this deck
24
Why is the 95% Tukey-Kramer multiple comparison procedure used rather than multiple 95% t confidence intervals when trying to determine which means are significantly different?
Unlock Deck
Unlock for access to all 40 flashcards in this deck.
Unlock Deck
k this deck
25
An experiment was designed to investigate the effectiveness of 5 different methods that are used for decontaminating topsoil. Each of the 5 methods is applied to a plot of contaminated soil at 3 different Superfund sites (blocks) and the reduction in heavy metals in the topsoil is recorded. The experiment yields the following summary information. SSTo = 1,209.3 SSTr = 635.8 SSBl = 297.6
a) Construct the ANOVA table for this experiment.
b) Test for the null hypothesis that there is no difference in the mean reduction of heavy metals for the 5 different methods using a .05 significance level.
a) Construct the ANOVA table for this experiment.
b) Test for the null hypothesis that there is no difference in the mean reduction of heavy metals for the 5 different methods using a .05 significance level.
Unlock Deck
Unlock for access to all 40 flashcards in this deck.
Unlock Deck
k this deck
26
The following Tukey-Kramer summary is from a single-factor ANOVA experiment, with treatments A, B, C, and D. Tukey-Kramer summary given below for a single-factor ANOVA. Interpret these multiple comparisons for this experiment.
Unlock Deck
Unlock for access to all 40 flashcards in this deck.
Unlock Deck
k this deck
27
The following partial ANOVA table was based on a randomized block experiment with 5 treatments and 5 blocks. a) Fill in the missing entries in the ANOVA table. b) Test the equality of the treatment means using a .05 significance level. c) If the five treatment means are use the 95% Tukey-Kramer procedure to determine which means differ.
a) Fill in the missing entries in the ANOVA table. b) Test the equality of the treatment means using a .05 significance level. c) If the five treatment means are use the 95% Tukey-Kramer procedure to determine which means differ. Unlock Deck
Unlock for access to all 40 flashcards in this deck.
Unlock Deck
k this deck
28
The following partial ANOVA table was based on an experiment performed as a two-factor design with 2 levels of factor A, 3 levels of factor B, and 5 observations on each treatment. a) Fill in the missing entries in the ANOVA table. b) First test the hypothesis of no interaction between the factors at the .05 level. If appropriate, perform tests of the main effects for the two factors also.
a) Fill in the missing entries in the ANOVA table. b) First test the hypothesis of no interaction between the factors at the .05 level. If appropriate, perform tests of the main effects for the two factors also. Unlock Deck
Unlock for access to all 40 flashcards in this deck.
Unlock Deck
k this deck
29
In a study of the effects of rewards on learning in statistics students, an experimenter divided 20 students into 4 groups of equal sizes using random assignment to the groups. Each student was given a computer-generated statistics test. The students were rewarded with jelly beans as they took the test. The investigators observed the total number of correct answers on the test. The treatments were as follows: The following table contains summary information for this experiment.
a) Construct the appropriate ANOVA table and test the hypothesis that there is no difference between the mean number of correct answers for the four treatments for the population of statistics students from which this sample was taken.
b) Is there evidence that the 25% random reward schedule and the 75% random reward schedule result in different achievement? Give statistical evidence to support your answer.
The following table contains summary information for this experiment. a) Construct the appropriate ANOVA table and test the hypothesis that there is no difference between the mean number of correct answers for the four treatments for the population of statistics students from which this sample was taken.
b) Is there evidence that the 25% random reward schedule and the 75% random reward schedule result in different achievement? Give statistical evidence to support your answer.
Unlock Deck
Unlock for access to all 40 flashcards in this deck.
Unlock Deck
k this deck
30
Briefly explain how to check the assumption of normality in a single-factor ANOVA.
Unlock Deck
Unlock for access to all 40 flashcards in this deck.
Unlock Deck
k this deck
31
In a study of the effects of rewards on learning in rats, an experimenter divided 20 rats into 4 groups of equal sizes. Each rat was run through a maze, and there was only one correct method of exiting the maze. The rats were rewarded on different schedules. The investigators observed the number of trials it took the rats to learn the maze.
Group A: The rats were rewarded for every correct direction chosen in the maze
Group B: The rats were randomly rewarded 75% of the time
Group C: The rats were randomly rewarded 25% of the time
Group D: The rats were not rewarded at all.
The following table contains summary information for this experiment.
a) Construct the appropriate ANOVA table and test the hypothesis that there is no difference between the mean number of trials needed to learn the maze for the different reward treatments.
b) Is there evidence that the 25% random reward schedule and the 75% random reward schedule result in a different mean number of trials to learn the maze? Give statistical evidence to support your answer.
Group A: The rats were rewarded for every correct direction chosen in the maze
Group B: The rats were randomly rewarded 75% of the time
Group C: The rats were randomly rewarded 25% of the time
Group D: The rats were not rewarded at all.
The following table contains summary information for this experiment.
a) Construct the appropriate ANOVA table and test the hypothesis that there is no difference between the mean number of trials needed to learn the maze for the different reward treatments.
b) Is there evidence that the 25% random reward schedule and the 75% random reward schedule result in a different mean number of trials to learn the maze? Give statistical evidence to support your answer.
Unlock Deck
Unlock for access to all 40 flashcards in this deck.
Unlock Deck
k this deck
32
A veterinarian is studying three different medications that could be used in the prevention of heartworm in young puppies. She has acquired for study four different litters of cocker spaniels, and 3 puppies were randomly selected from each litter. The three selected puppies from a litter were then randomly assigned to one of the four treatments. The data below represents the number of months after a single treatment before the initial onset of heartworm in the puppies for this randomized block design. a) Construct the ANOVA table for this experiment. b) Test the equality of the mean time to onset of heartworm for the three different medications at the .05 level. c) Using the 95% Tukey-Kramer procedure determine which of the treatment means are significantly different.
a) Construct the ANOVA table for this experiment. b) Test the equality of the mean time to onset of heartworm for the three different medications at the .05 level. c) Using the 95% Tukey-Kramer procedure determine which of the treatment means are significantly different. Unlock Deck
Unlock for access to all 40 flashcards in this deck.
Unlock Deck
k this deck
33
A dairy scientist is studying three different formulas that could be used in producing low fat cheese. The experimental process involves mixing the basic cheese ingredients in 4 different vats (blocks) and then splitting the mixture from each vat into three different batches. Additives are added to each of the batches according to each of the three formulas resulting in a round of low fat cheese. The data below represents the fat content (in grams per ounce) of the resulting rounds of cheese for this randomized block design.
a) Construct the ANOVA table for this experiment.
b) Test the equality of the mean fat content for the three different low fat cheese formulas at the .05 level.
c) Using the 95% Tukey-Kramer procedure determine which of the treatment means are significantly different.
a) Construct the ANOVA table for this experiment.
b) Test the equality of the mean fat content for the three different low fat cheese formulas at the .05 level.
c) Using the 95% Tukey-Kramer procedure determine which of the treatment means are significantly different.
Unlock Deck
Unlock for access to all 40 flashcards in this deck.
Unlock Deck
k this deck
34
If the line segments in an interaction plot are parallel, then the plot indicates that the two factors interact with each other.
Unlock Deck
Unlock for access to all 40 flashcards in this deck.
Unlock Deck
k this deck
35
Nutritionists study the impact of four different diets on women's vulnerability to vitamin B6 deficiency. The researchers randomly assigned adult women to one of four groups. Each group followed a specific diet. Let µ1, µ2, µ3, and µ4 represent the mean daily intake of vitamin B6 (in mg) for diets 1, 2, 3, and 4, respectively. The sample data are given in the table below. Use the 95% Tukey-Kramer procedure to identify the correct statement describing the differences among the diets.
A) µ1 is significantly different from µ3 and there are no other significant differences.
B) µ4 is significantly different from both µ1 and µ3, and there are no other significant differences.
C) µ2 and µ4 are significantly different from µ1 and µ3. There are no other significant differences.
D) µ1 is significantly different from µ4 and there are no other significant differences.
E) µ2 is significantly different from both µ1 and µ3, and there are no other significant differences.
Unlock Deck
Unlock for access to all 40 flashcards in this deck.
Unlock Deck
k this deck
36
The supermarket chain chooses a new logo from the three proposed options. A control group of 20 people scores the logos, which are shown in a random order, on a ten-point scale of attractiveness. Let µ1, µ2, and µ3 represent the mean scores for logos 1, 2, and 3 respectively. After using a multiple comparison procedure, the results were announced: The rating of logo 3 significantly differs from the ratings of logo 1. The rating of logo 1 is approximately equal to the rating of logo 2. The rating of logo 2 significantly differs from the ratings of logo 3. Which of the following sets of Tukey-Kramer intervals is consistent with the conclusions?
A)
B)
C)
D)
E)
A)
B)
C)
D)
E)
Unlock Deck
Unlock for access to all 40 flashcards in this deck.
Unlock Deck
k this deck
37
Two factors A and B are said to interact when the change in the true average response when the level of one factor changes depends on the level of the other factor.
Unlock Deck
Unlock for access to all 40 flashcards in this deck.
Unlock Deck
k this deck
38
In an experiment on anticipated test performance, males and females were given an algebra test. Before they took the test, they were told that based on their past performance they were expected to score "above average", "about average", or "below average," the level of expected performance being randomly chosen. The subjects scores on the tests were then analyzed using ANOVA. Each gender by encouragement combination had 10 individuals for a total of 60.
a) Complete the table above.
b) At .05 the level of significance, does there appear to be an interaction between gender and encouragement?
a) Complete the table above.
b) At .05 the level of significance, does there appear to be an interaction between gender and encouragement?
Unlock Deck
Unlock for access to all 40 flashcards in this deck.
Unlock Deck
k this deck
39
What are the assumptions of the randomized block ANOVA F test for testing the equality of treatment means?
Unlock Deck
Unlock for access to all 40 flashcards in this deck.
Unlock Deck
k this deck
40
What are the assumptions of the single-factor ANOVA F test?
Unlock Deck
Unlock for access to all 40 flashcards in this deck.
Unlock Deck
k this deck
Unlock Deck
Unlock for access to all 40 flashcards in this deck.


