Deck 2: Frequency Distributions
Full screen (f)
Question
Question
For the following distribution, how many people had scores less than X = 19? 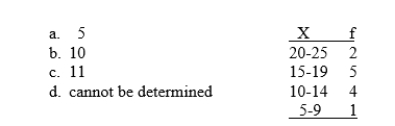
Question
Question
What is the total number of scores for the distribution shown in the following table? 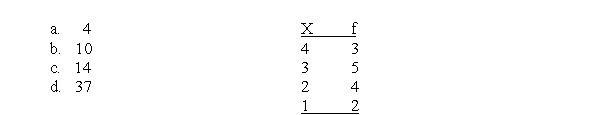
Question
For the following distribution of quiz scores, if a score of X = 3 or higher is needed for a passing grade, how many individuals passed? 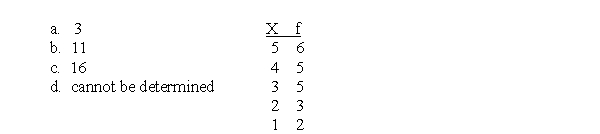
Question
What scale of measurement was used to measure the scores in the distribution shown in the following graph? 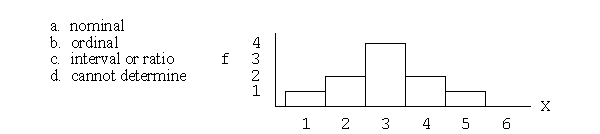
Question
For the following distribution, what is the highest score? 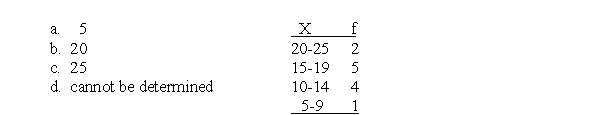
Question
If the following distribution was shown in a histogram, the bar above the 15-19 interval would reach from _____ to _____. 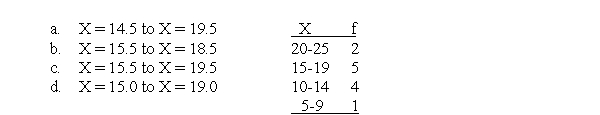
Question
For the following distribution of quiz scores, How many individuals had a score of X = 2? 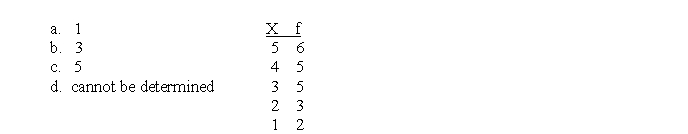
Question
For the following distribution, how many people had scores greater than X = 14? 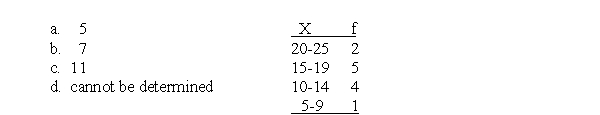
Question
Question
For the following frequency distribution of exam scores, how many students had scores lower than X = 80? 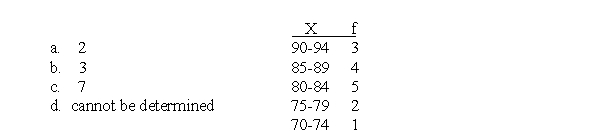
Question
For the distribution in the following graph, what is the value of ΣX? 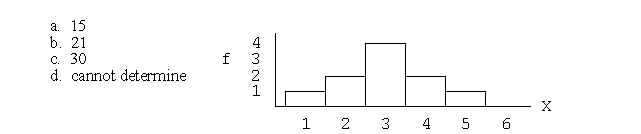
Question
Question
Question
For the following distribution, what is the width of each class interval? 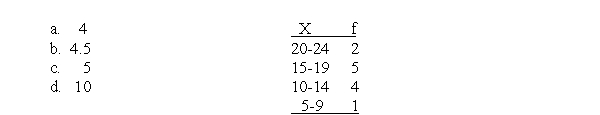
Question
For the following frequency distribution of quiz scores, how many individuals took the quiz? 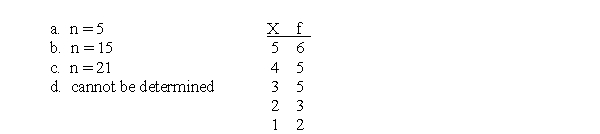
Question
Question
Question
For the following frequency distribution of exam scores, what is the lowest score on the exam? 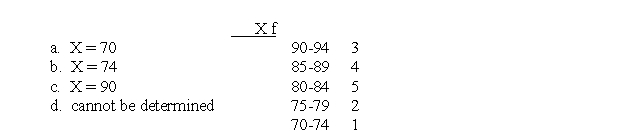
Question
Question
For the distribution in the following table, what is the percentile rank for X = 7? 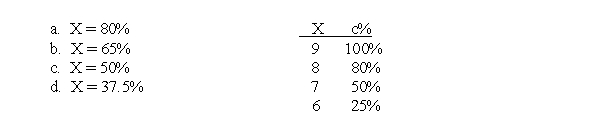
Question
Question
For the distribution in the following table, what is the 50th percentile? 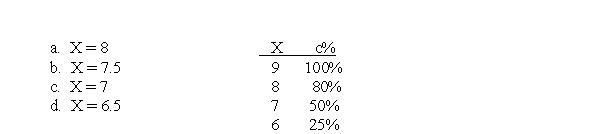
Question
For the distribution in the following table, what is the percentile rank for X = 24.5? 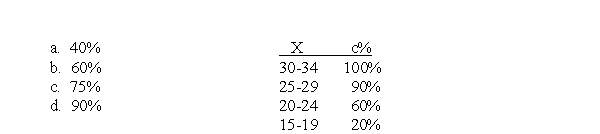
Question
Question
Question
For the distribution in the following table, what is the percentile rank for X = 32? 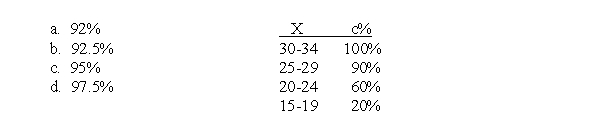
Question
For the distribution in the following table, what is the 90th percentile 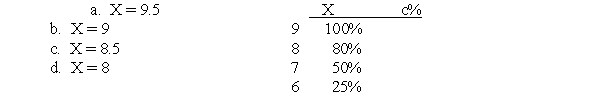
Question
For the distribution in the following table, what is the 50th percentile? 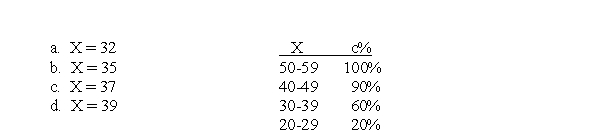
Question
For the scores shown in the following stem and leaf display, what is the highest score in the distribution? 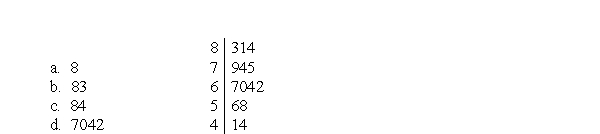
Question
For the distribution in the following table, what is the 90th percentile? 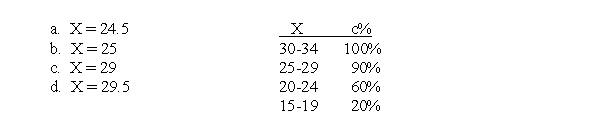
Question
Question
Question
Question
For the distribution in the following table, what is the percentile rank for X = 8.5? 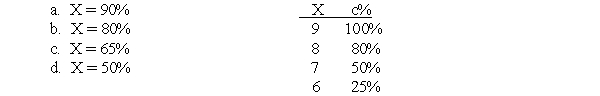
Question
If the following scores were placed in a stem and leaf display, how many leaves would be associated with a stem of 6? 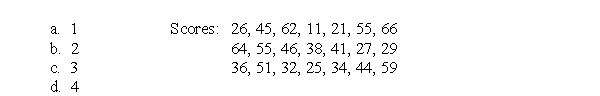
Question
Question
What is the shape for the distribution shown in the following graph? 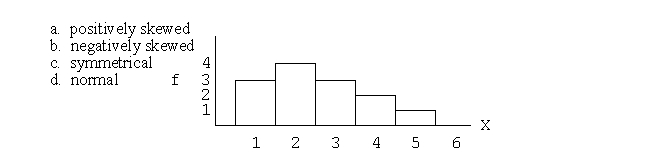
Question
Question
Question
Question
Question
For the following distribution, seven people have scores greater than X = 14. 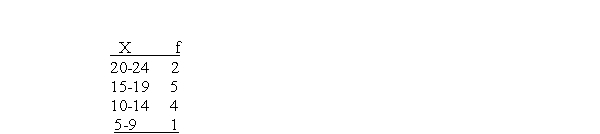
Question
Question
Question
Question
Question
Question
There is a total of n = 5 scores in the distribution shown in the following table. 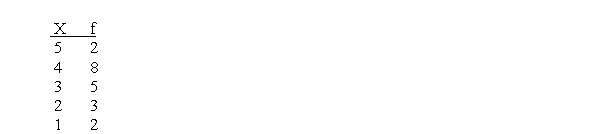
Question
Question
Question
Question
Question
Question
Question
For the following distribution of scores, 20% of the individuals have scores of X = 1. 
Question
Question
Question
In the following distribution, the scores are grouped into class intervals that are each 5 points wide. 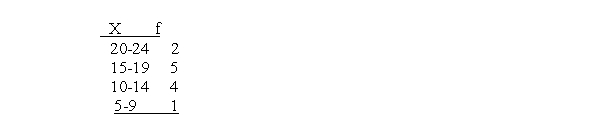
Question
For the distribution in the following table, the 90th percentile is X = 27.5. 
Question
Question
For the distribution in the following table, the 80th percentile is X = 24. 
Question
Question
Question
Question
Question
For the distribution in the following table, the percentile rank for X = 19.5 is 20%. 
Question
For the distribution in the following table, the percentile rank for X = 25 is 82%. 
Question

Unlock Deck
Sign up to unlock the cards in this deck!
Unlock Deck
Unlock Deck
1/70
Play
Full screen (f)
Deck 2: Frequency Distributions
1
A sample of n = 15 scores ranges from a high of X = 11 to a low of X = 3.If these scores are placed in a frequency distribution table, how many X values will be listed in the first column?
A)8
B)9
C)11
D)15
A)8
B)9
C)11
D)15
B
2
For the following distribution, how many people had scores less than X = 19?
D
3
A researcher records the number of traffic tickets issued in each county along the New York State thruway.If the results are presented in a frequency distribution graph, what kind of graph should be used?
A)a bar graph
B)a histogram
C)a polygon
D)either a histogram or a polygon
A)a bar graph
B)a histogram
C)a polygon
D)either a histogram or a polygon
A
4
What is the total number of scores for the distribution shown in the following table?
Unlock Deck
Unlock for access to all 70 flashcards in this deck.
Unlock Deck
k this deck
5
For the following distribution of quiz scores, if a score of X = 3 or higher is needed for a passing grade, how many individuals passed?
Unlock Deck
Unlock for access to all 70 flashcards in this deck.
Unlock Deck
k this deck
6
What scale of measurement was used to measure the scores in the distribution shown in the following graph?
Unlock Deck
Unlock for access to all 70 flashcards in this deck.
Unlock Deck
k this deck
7
For the following distribution, what is the highest score?
Unlock Deck
Unlock for access to all 70 flashcards in this deck.
Unlock Deck
k this deck
8
If the following distribution was shown in a histogram, the bar above the 15-19 interval would reach from _____ to _____.
Unlock Deck
Unlock for access to all 70 flashcards in this deck.
Unlock Deck
k this deck
9
For the following distribution of quiz scores, How many individuals had a score of X = 2?
Unlock Deck
Unlock for access to all 70 flashcards in this deck.
Unlock Deck
k this deck
10
For the following distribution, how many people had scores greater than X = 14?
Unlock Deck
Unlock for access to all 70 flashcards in this deck.
Unlock Deck
k this deck
11
What frequency distribution graph is appropriate for scores measured on a nominal scale?
A)only a histogram
B)only a polygon
C)either a histogram or a polygon
D)only a bar graph
A)only a histogram
B)only a polygon
C)either a histogram or a polygon
D)only a bar graph
Unlock Deck
Unlock for access to all 70 flashcards in this deck.
Unlock Deck
k this deck
12
For the following frequency distribution of exam scores, how many students had scores lower than X = 80?
Unlock Deck
Unlock for access to all 70 flashcards in this deck.
Unlock Deck
k this deck
13
For the distribution in the following graph, what is the value of ΣX?
Unlock Deck
Unlock for access to all 70 flashcards in this deck.
Unlock Deck
k this deck
14
In a grouped frequency distribution one interval is listed as 50?59.Assuming that the scores are measuring a continuous variable, what are the real limits of this interval?
A)50 and 59
B)50.5 and 59.5
C)49.5 and 59.5
D)49.5 and 60.5
A)50 and 59
B)50.5 and 59.5
C)49.5 and 59.5
D)49.5 and 60.5
Unlock Deck
Unlock for access to all 70 flashcards in this deck.
Unlock Deck
k this deck
15
What kind of frequency distribution graph shows the frequencies as bars, with no space between adjacent bars?
A)a bar graph
B)a histogram
C)a polygon
D)all of the above
A)a bar graph
B)a histogram
C)a polygon
D)all of the above
Unlock Deck
Unlock for access to all 70 flashcards in this deck.
Unlock Deck
k this deck
16
For the following distribution, what is the width of each class interval?
Unlock Deck
Unlock for access to all 70 flashcards in this deck.
Unlock Deck
k this deck
17
For the following frequency distribution of quiz scores, how many individuals took the quiz?
Unlock Deck
Unlock for access to all 70 flashcards in this deck.
Unlock Deck
k this deck
18
In a frequency distribution graph, frequencies are presented on the and the scores (categories) are listed on the .
A)X axis/Y axis
B)horizontal line/vertical line
C)Y axis/X axis
D)class interval/horizontal line
A)X axis/Y axis
B)horizontal line/vertical line
C)Y axis/X axis
D)class interval/horizontal line
Unlock Deck
Unlock for access to all 70 flashcards in this deck.
Unlock Deck
k this deck
19
The classrooms in the Psychology department are numbered from 100 to 108.A professor records the number of classes held in each room during the fall semester.If these values are presented in a frequency distribution graph, what kind of graph would be appropriate?
A)a histogram
B)a polygon
C)a histogram or a polygon
D)a bar graph
A)a histogram
B)a polygon
C)a histogram or a polygon
D)a bar graph
Unlock Deck
Unlock for access to all 70 flashcards in this deck.
Unlock Deck
k this deck
20
For the following frequency distribution of exam scores, what is the lowest score on the exam?
Unlock Deck
Unlock for access to all 70 flashcards in this deck.
Unlock Deck
k this deck
21
If a frequency distribution is shown in a bar graph, what scale was used to measure the scores?
A)nominal
B)nominal or ordinal
C)ratio
D)interval or ratio
A)nominal
B)nominal or ordinal
C)ratio
D)interval or ratio
Unlock Deck
Unlock for access to all 70 flashcards in this deck.
Unlock Deck
k this deck
22
For the distribution in the following table, what is the percentile rank for X = 7?
Unlock Deck
Unlock for access to all 70 flashcards in this deck.
Unlock Deck
k this deck
23
A skewed distribution typically has _____ tail(s) and a normal distribution has ____ tail(s).
A)1, 1
B)1, 2
C)2, 1
D)2, 2
A)1, 1
B)1, 2
C)2, 1
D)2, 2
Unlock Deck
Unlock for access to all 70 flashcards in this deck.
Unlock Deck
k this deck
24
For the distribution in the following table, what is the 50th percentile?
Unlock Deck
Unlock for access to all 70 flashcards in this deck.
Unlock Deck
k this deck
25
For the distribution in the following table, what is the percentile rank for X = 24.5?
Unlock Deck
Unlock for access to all 70 flashcards in this deck.
Unlock Deck
k this deck
26
The normal distribution is an example of
A)a histogram showing data from a sample
B)a polygon showing data from a sample
C)a bar graph showing data from a population
D)a smooth curve showing data from a population
A)a histogram showing data from a sample
B)a polygon showing data from a sample
C)a bar graph showing data from a population
D)a smooth curve showing data from a population
Unlock Deck
Unlock for access to all 70 flashcards in this deck.
Unlock Deck
k this deck
27
What term is used to describe the shape of a distribution in which the scores pile up on the left-hand side of the graph and taper off to the right?
A)symmetrical
B)positively skewed
C)negatively skewed
D)normal
A)symmetrical
B)positively skewed
C)negatively skewed
D)normal
Unlock Deck
Unlock for access to all 70 flashcards in this deck.
Unlock Deck
k this deck
28
For the distribution in the following table, what is the percentile rank for X = 32?
Unlock Deck
Unlock for access to all 70 flashcards in this deck.
Unlock Deck
k this deck
29
For the distribution in the following table, what is the 90th percentile
Unlock Deck
Unlock for access to all 70 flashcards in this deck.
Unlock Deck
k this deck
30
For the distribution in the following table, what is the 50th percentile?
Unlock Deck
Unlock for access to all 70 flashcards in this deck.
Unlock Deck
k this deck
31
For the scores shown in the following stem and leaf display, what is the highest score in the distribution?
Unlock Deck
Unlock for access to all 70 flashcards in this deck.
Unlock Deck
k this deck
32
For the distribution in the following table, what is the 90th percentile?
Unlock Deck
Unlock for access to all 70 flashcards in this deck.
Unlock Deck
k this deck
33
The students in a psychology class seemed to think that the midterm exam was very easy.If they are correct, what is the most likely shape for the distribution of exam scores?
A)symmetrical
B)positively skewed
C)negatively skewed
D)normal
A)symmetrical
B)positively skewed
C)negatively skewed
D)normal
Unlock Deck
Unlock for access to all 70 flashcards in this deck.
Unlock Deck
k this deck
34
What kind of frequency distribution graph shows the frequencies as bars that are separated by spaces?
A)a bar graph
B)a histogram
C)a polygon
D)all of the above
A)a bar graph
B)a histogram
C)a polygon
D)all of the above
Unlock Deck
Unlock for access to all 70 flashcards in this deck.
Unlock Deck
k this deck
35
If a set of exam scores forms a symmetrical distribution, what can you conclude about the students scores?
A)Most of the students had relatively high scores.
B)Most of the students had relatively low scores.
C)About 50% of the students had high scores and the rest had low scores.
D)It is not possible the draw any conclusions about the students' scores.
A)Most of the students had relatively high scores.
B)Most of the students had relatively low scores.
C)About 50% of the students had high scores and the rest had low scores.
D)It is not possible the draw any conclusions about the students' scores.
Unlock Deck
Unlock for access to all 70 flashcards in this deck.
Unlock Deck
k this deck
36
For the distribution in the following table, what is the percentile rank for X = 8.5?
Unlock Deck
Unlock for access to all 70 flashcards in this deck.
Unlock Deck
k this deck
37
If the following scores were placed in a stem and leaf display, how many leaves would be associated with a stem of 6?
Unlock Deck
Unlock for access to all 70 flashcards in this deck.
Unlock Deck
k this deck
38
In a distribution with positive skew, scores with the highest frequencies are _____.
A)on the right side of the distribution
B)on the left side of the distribution
C)in the middle of the distribution
D)represented at two distinct peaks
A)on the right side of the distribution
B)on the left side of the distribution
C)in the middle of the distribution
D)represented at two distinct peaks
Unlock Deck
Unlock for access to all 70 flashcards in this deck.
Unlock Deck
k this deck
39
What is the shape for the distribution shown in the following graph?
Unlock Deck
Unlock for access to all 70 flashcards in this deck.
Unlock Deck
k this deck
40
What is the shape of the distribution for the following set of data? Scores: 1, 2, 3, 3, 4, 4, 4 5, 5, 5, 5, 6
A)symmetrical
B)positively skewed
C)negatively skewed
D)cumulative
A)symmetrical
B)positively skewed
C)negatively skewed
D)cumulative
Unlock Deck
Unlock for access to all 70 flashcards in this deck.
Unlock Deck
k this deck
41
A researcher surveys a sample of n = 200 college students and asks each person to identify his or her favorite movie from the past year.If the data were organized in a frequency distribution table, the first column would be a list of movies.
Unlock Deck
Unlock for access to all 70 flashcards in this deck.
Unlock Deck
k this deck
42
For the following distribution of scores, X = 18.
Unlock Deck
Unlock for access to all 70 flashcards in this deck.
Unlock Deck
k this deck
43
If a set of scores covers a range of 80 points, the grouped frequency table should use an interval width of 8 points.
Unlock Deck
Unlock for access to all 70 flashcards in this deck.
Unlock Deck
k this deck
44
For the following distribution, seven people have scores greater than X = 14.
Unlock Deck
Unlock for access to all 70 flashcards in this deck.
Unlock Deck
k this deck
45
A grouped frequency distribution table does not provide enough information to obtain a complete listing of the original set of scores.
Unlock Deck
Unlock for access to all 70 flashcards in this deck.
Unlock Deck
k this deck
46
It is customary to list the score categories in a frequency distribution from the highest down to the lowest.
Unlock Deck
Unlock for access to all 70 flashcards in this deck.
Unlock Deck
k this deck
47
A set of scores ranges from X = 18 to X= 91.If the scores are put in a grouped frequency distribution table with an interval width of 10 points, the top interval would be 91-100.
Unlock Deck
Unlock for access to all 70 flashcards in this deck.
Unlock Deck
k this deck
48
A group of quiz scores ranges from 3 to 10, but no student had a score of X = 5.If the scores are put in a frequency distribution table, X = 5 would not be listed in the X column.
Unlock Deck
Unlock for access to all 70 flashcards in this deck.
Unlock Deck
k this deck
49
A set of scores ranges from a low of X = 18 to a high of X = 98.If the scores are put in a grouped frequency distribution table with an interval width of 10 points, the bottom interval should be 10-19.
Unlock Deck
Unlock for access to all 70 flashcards in this deck.
Unlock Deck
k this deck
50
There is a total of n = 5 scores in the distribution shown in the following table.
Unlock Deck
Unlock for access to all 70 flashcards in this deck.
Unlock Deck
k this deck
51
A professor records the number of students who are absent each day for the semester.Because this is a discrete variable, a bar graph should be used to show the frequency distribution.
Unlock Deck
Unlock for access to all 70 flashcards in this deck.
Unlock Deck
k this deck
52
If it is appropriate to present a distribution of scores in a polygon, then it would also be appropriate to present the scores in a bar graph.
Unlock Deck
Unlock for access to all 70 flashcards in this deck.
Unlock Deck
k this deck
53
In a grouped frequency distribution table, one interval is identified as 30-34.This interval has a width of 5 points.
Unlock Deck
Unlock for access to all 70 flashcards in this deck.
Unlock Deck
k this deck
54
For the following distribution of scores, X2 = 92.
Unlock Deck
Unlock for access to all 70 flashcards in this deck.
Unlock Deck
k this deck
55
A grouped frequency distribution table lists one interval as, 20-29.The width of this interval is 9 points.
Unlock Deck
Unlock for access to all 70 flashcards in this deck.
Unlock Deck
k this deck
56
A researcher surveys a sample of n = 200 college students and asks each person to identify his or her favorite movie from the past year.If the results are presented in a frequency distribution graph, the researcher should use a bar graph.
Unlock Deck
Unlock for access to all 70 flashcards in this deck.
Unlock Deck
k this deck
57
For the following distribution of scores, 20% of the individuals have scores of X = 1.
Unlock Deck
Unlock for access to all 70 flashcards in this deck.
Unlock Deck
k this deck
58
In a grouped frequency distribution table, the top value in each class interval should be a multiple of the interval width.
Unlock Deck
Unlock for access to all 70 flashcards in this deck.
Unlock Deck
k this deck
59
A histogram is constructed so that adjacent bars touch.
Unlock Deck
Unlock for access to all 70 flashcards in this deck.
Unlock Deck
k this deck
60
In the following distribution, the scores are grouped into class intervals that are each 5 points wide.
Unlock Deck
Unlock for access to all 70 flashcards in this deck.
Unlock Deck
k this deck
61
For the distribution in the following table, the 90th percentile is X = 27.5.
Unlock Deck
Unlock for access to all 70 flashcards in this deck.
Unlock Deck
k this deck
62
A stem and leaf display does not provide enough information to obtain a complete listing of the original set of scores.
Unlock Deck
Unlock for access to all 70 flashcards in this deck.
Unlock Deck
k this deck
63
For the distribution in the following table, the 80th percentile is X = 24.
Unlock Deck
Unlock for access to all 70 flashcards in this deck.
Unlock Deck
k this deck
64
The normal distribution is an example of a symmetrical distribution.
Unlock Deck
Unlock for access to all 70 flashcards in this deck.
Unlock Deck
k this deck
65
The scores for a very easy exam would probably form a positively skewed distribution.
Unlock Deck
Unlock for access to all 70 flashcards in this deck.
Unlock Deck
k this deck
66
A score equal to the 5th percentile is one of the highest scores in the distribution.
Unlock Deck
Unlock for access to all 70 flashcards in this deck.
Unlock Deck
k this deck
67
If a set of exam scores forms a negatively skewed distribution, it suggests that the majority of the students did not score well on the exam.
Unlock Deck
Unlock for access to all 70 flashcards in this deck.
Unlock Deck
k this deck
68
For the distribution in the following table, the percentile rank for X = 19.5 is 20%.
Unlock Deck
Unlock for access to all 70 flashcards in this deck.
Unlock Deck
k this deck
69
For the distribution in the following table, the percentile rank for X = 25 is 82%.
Unlock Deck
Unlock for access to all 70 flashcards in this deck.
Unlock Deck
k this deck
70
In February in New York, the daily high temperatures are typically low with only a few relatively warm days.A frequency distribution showing the daily high temperatures would probably form a negatively skewed distribution.
Unlock Deck
Unlock for access to all 70 flashcards in this deck.
Unlock Deck
k this deck
Unlock Deck
Unlock for access to all 70 flashcards in this deck.


