Exam 2: Frequency Distributions
Exam 1: Introduction to Statistics70 Questions
Exam 2: Frequency Distributions70 Questions
Exam 3: Central Tendency70 Questions
Exam 4: Variability70 Questions
Exam 5: Z-Scores40 Questions
Exam 6: Probability69 Questions
Exam 7: The Distribution of Sample Means69 Questions
Exam 8: Introduction to Hypothesis Testing69 Questions
Exam 9: Introduction to the T Statistic68 Questions
Exam 10: The T Test for Two Independent Samples70 Questions
Exam 11: The T Test for Two Related Samples69 Questions
Exam 12: Introduction to Analysis of Variance70 Questions
Exam 13: Repeated-Measures Anova70 Questions
Exam 14: Two-Factor Analysis of Variance70 Questions
Exam 15: Correlation70 Questions
Exam 16: Introduction to Regression70 Questions
Exam 17: Chi-Square Tests70 Questions
Exam 18: The Binomial Test70 Questions
Exam 19: Choosing the Right Statistics4 Questions
Select questions type
In a distribution with positive skew, scores with the highest frequencies are _____.
Free
(Multiple Choice)
4.9/5  (35)
(35)
Correct Answer: Verified
B
For the following frequency distribution of exam scores, how many students had scores lower than X = 80? x f 90-94 3 85-89 4 80-84 5 75-79 2 70-74 1
Free
(Multiple Choice)
4.7/5 (27)
Correct Answer:Verified
B
The students in a psychology class seemed to think that the midterm exam was very easy.If they are correct, what is the most likely shape for the distribution of exam scores?
Free
(Multiple Choice)
4.8/5 (38)
Correct Answer:Verified
C
For the distribution in the following table, the 90th percentile is X = 27.5. 
(True/False)
4.7/5 (31)
The classrooms in the Psychology department are numbered from 100 to 108.A professor records the number of classes held in each room during the fall semester.If these values are presented in a frequency distribution graph, what kind of graph would be appropriate?
(Multiple Choice)
5.0/5 (39)
What term is used to describe the shape of a distribution in which the scores pile up on the left-hand side of the graph and taper off to the right?
(Multiple Choice)
4.9/5 (33)
For the distribution in the following table, what is the 50th percentile? 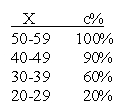
(Multiple Choice)
4.9/5 (31)
If a set of scores covers a range of 80 points, the grouped frequency table should use an interval width of 8 points.
(True/False)
4.9/5 (41)
If the following scores were placed in a stem and leaf display, how many leaves would be associated with a stem of 6? Scores:
(Multiple Choice)
4.8/5 (37)
A score equal to the 5th percentile is one of the highest scores in the distribution.
(True/False)
4.8/5 (43)
The scores for a very easy exam would probably form a positively skewed distribution.
(True/False)
4.7/5 (44)
For the following distribution, seven people have scores greater than X = 14. f 20-24 2 15-19 5 10-14 4 5-9 1
(True/False)
4.8/5 (42)
A sample of n = 15 scores ranges from a high of X = 11 to a low of X = 3.If these scores are placed in a frequency distribution table, how many X values will be listed in the first column?
(Multiple Choice)
4.8/5 (39)
What is the shape for the distribution shown in the following graph? 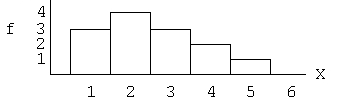
(Multiple Choice)
4.8/5 (41)
A researcher surveys a sample of n = 200 college students and asks each person to identify his or her favorite movie from the past year.If the data were organized in a frequency distribution table, the first column would be a list of movies.
(True/False)
4.8/5 (34)
For the distribution in the following table, the percentile rank for X = 19.5 is 20%. 
(True/False)
4.7/5 (36)
In a grouped frequency distribution one interval is listed as 50?59.Assuming that the scores are measuring a continuous variable, what are the real limits of this interval?
(Multiple Choice)
4.7/5 (36)
For the following distribution of quiz scores, How many individuals had a score of X = 2?
X f 5 6 4 5 3 5 2 3 1 2
(Multiple Choice)
4.9/5 (33)
For the distribution in the following table, the percentile rank for X = 25 is 82%. 
(True/False)
4.9/5 (30)
It is customary to list the score categories in a frequency distribution from the highest down to the lowest.
(True/False)
4.8/5 (35)
Filters
- Essay(0)
- Multiple Choice(0)
- Short Answer(0)
- True False(0)
- Matching(0)