Deck 12: Analysis of Variance
Full screen (f)
Question
Question
Question
Question
Data is collected from 20 sales people in order to verify that the more contacts made with potential
Clients, the greater the sales volume. A scatter diagram of the collected information is shown below.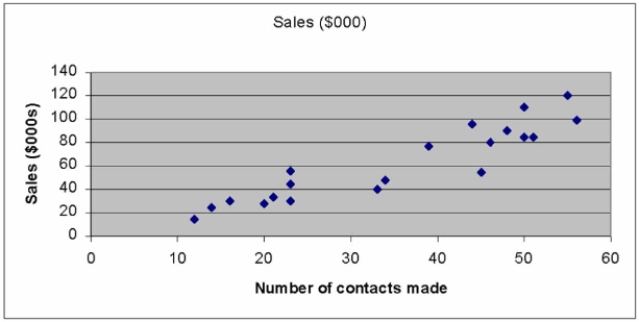
Looking at this scatter diagram you determine:
A) there is clearly no relationship between the number of sales contacts made and the sales earned.
B) there is a moderate but inverse relationship between the two variables.
C) there is a moderate and direct relationship between the two variables.
D) the Sales ($000s) is the independent variable.
Question
A sales manager for an advertising agency believes there is a relationship between the number of
Contacts and the amount of the sales. To verify this believe, the following data was collected: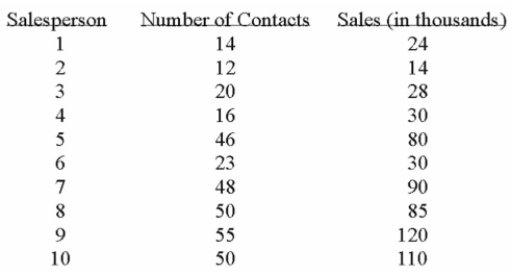

What is the independent variable?
A) Salesperson
B) Number of contacts
C) Amount of sales Multiple Choice Difficulty: Medium Learning
Contacts and the amount of the sales. To verify this believe, the following data was collected:
What is the independent variable?
A) Salesperson
B) Number of contacts
C) Amount of sales Multiple Choice Difficulty: Medium Learning
Question
A sales manager for an advertising agency believes there is a relationship between the number of
Contacts and the amount of the sales. To verify this believe, the following data was collected:
What is the dependent variable?
A) Salesperson
B) Number of contacts
C) Amount of sales Multiple Choice Difficulty: Medium Learning
Contacts and the amount of the sales. To verify this believe, the following data was collected:
What is the dependent variable?
A) Salesperson
B) Number of contacts
C) Amount of sales Multiple Choice Difficulty: Medium Learning
Question
Question
Given the scatter diagram below, that shows the number of workdays absent per year based on the
Age of the employees, which of the following statements are true?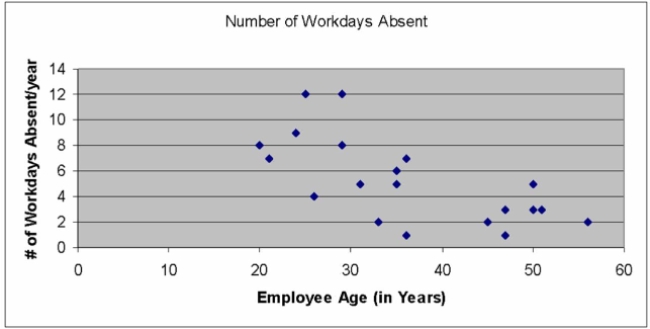
A) There is clearly no relationship whatsoever between an employee's age and the number of workday absences that they take.
B) There is a single but strong outlier in this data set.
C) There appears to be an inverse relationship between the two variables.
D) There is a single but strong outlier in this data set, but clearly no relationship whatsoever between an employee's age and the number of workday absences that they take.
E) There is a single but strong outlier in this data set and an inverse relationship between the two variables.
Question
Question
Question
Question
Question
Question
Given the scatter diagram below, that shows the number of workdays absent per year based on the
Age of the employees, which of the following statements are true?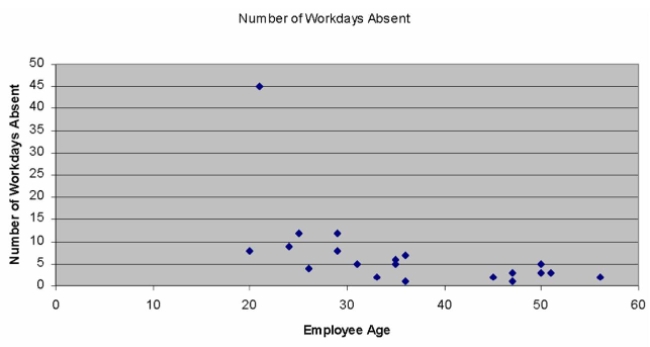
A) There is clearly no relationship whatsoever between an employee's age and the number of workday absences that they take.
B) There is a single but strong outlier in this data set.
C) In analyzing this data, you may wish to remove the one point that doesn't "fit" with all the others before continuing your analysis.
D) There is clearly no relationship whatsoever between an employee's age and the number of workday absences that they take, however, there is a single but strong outlier in this
Data set.
E) There is a single but strong outlier in this data set; in analyzing this data, you may wish to remove the one point that doesn't "fit" with all the others before continuing your analysis.
Question
Question
Question
Question
Question
Question
Question
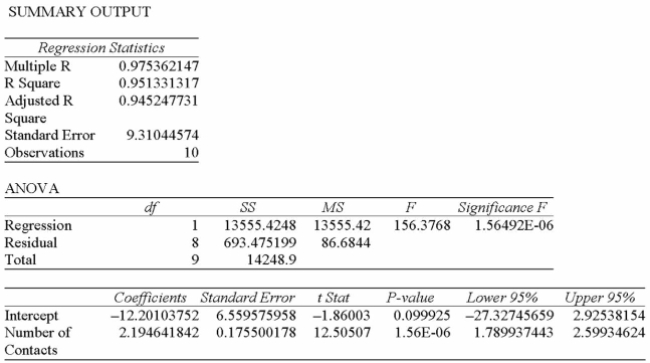
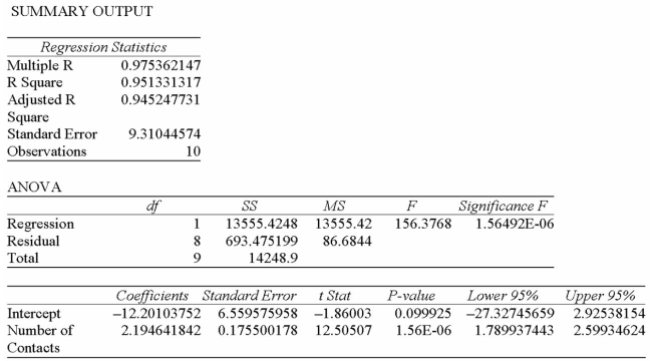
Data is collected from 20 sales people in order to verify that the more contacts made with potential
Clients, the greater the sales volume. The Excel printout is shown below.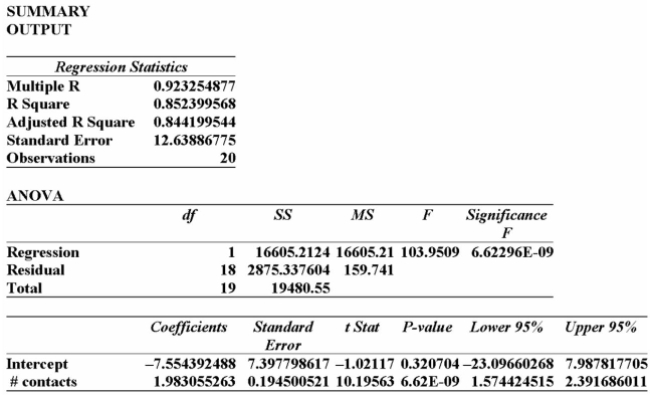
This model predicts that with 25 sales contacts, sales will be:
A) $49 576.
B) $42 022.
C) $190 843.
D) $19 429.
E) $16 605.
Clients, the greater the sales volume. The Excel printout is shown below.
This model predicts that with 25 sales contacts, sales will be:
A) $49 576.
B) $42 022.
C) $190 843.
D) $19 429.
E) $16 605.
Question
Question
Information was collected from employee records to determine whether there is an association
Between an employee's age and the number or workdays they miss. Excel results are summarized
Below:
From this printout you determine:
A) the y-intercept of 23 makes no sense.
B) for each additional year of age, we can expect the number of days of absence to increase by 0.45 days.
C) for each additional year of age, we can expect the number of days of absence to decrease by 0.45 days.
D) the y-intercept of 23 makes no sense; for each additional year of age, we can expect the number of days of absence to increase by 0.45 days.
E) the y-intercept of 23 makes no sense; for each additional year of age, we can expect the number of days of absence to decrease by 0.45 days.
Question
Question
Question
Information was collected from employee records to determine whether there is an association
Between an employee's age and the number or workdays they miss. Excel results are summarized
Below:
From this printout you determine:
A) the employee age is the dependent variable.
B) the employee age is the independent variable.
C) the regression equation is Y = 23.57 - 0.45x.
D) the regression equation is Y = 23.57 x -0.45.
E) the employee age is the independent variable; the regression equation is Y = 23.57 - 0.45x.
Question
Question
Information was collected from employee records to determine whether there is an association
Between an employee's age and the number or workdays they miss. Excel results are summarized
Below:
From this printout you determine:
A) the employee age is the dependent variable.
B) the employee age is the independent variable.
C) the regression equation is Y = 23.57 - 8.3x.
D) the regression equation is Y = 23.57 x -0.45.
E) the employee age is the independent variable; the regression equation is Y = 23.57 + 0.45x.
Question
Question
Question
Question
Information was collected from employee records to determine whether there is an association
Between an employee's age and the number or workdays they miss. Excel results are summarized
Below:
From this printout you determine:
A) the y-intercept of 23 makes no sense.
B) the employee age is the independent variable.
C) the regression equation is Y = 23.57 - 0.45x.
D) the employee age is the independent variable; the regression equation is Y = 23.57 - 0.45x.
E) the employee age is the independent variable; the regression equation is Y = 23.57 - 0.45x, however the y-intercept of 23 makes no sense.
Question
Data is collected from 20 sales people in order to verify that the more contacts made with potential
Clients, the greater the sales volume. The Excel printout is shown below.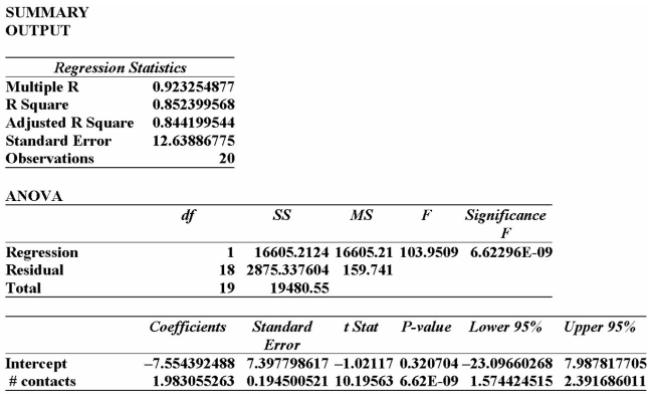
From this printout you determine:
A) there is a very weak relationship between the # of contacts and the sales $.
B) there is a very strong relationship between the # of contacts and the sales $.
C) the regression equation is y = 1.98 x +7.55.
D) the regression equation is y = -7.55 x +1.98.
Question
Question
Question
Information was collected from employee records to determine whether there is an association
Between an employee's age and the number or workdays they miss. Excel results are summarized
Below: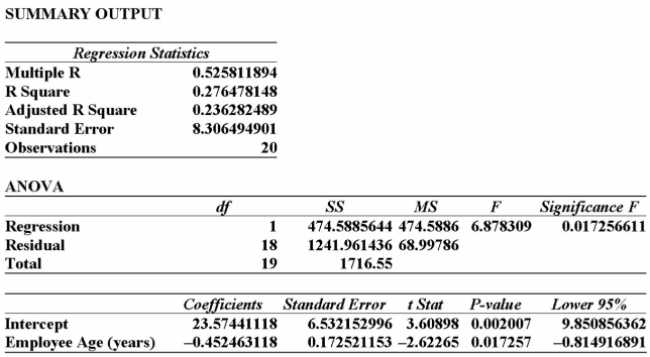
From this printout you determine:
A) the employee age is the dependent variable.
B) the employee age is the independent variable.
C) the older the employee the more days they are absent from work.
D) the intercept of 23 indicates the most days absent.
Question
Question
Information was collected from employee records to determine whether there is an association
Between an employee's age and the number or workdays they miss. Excel results are summarized
Below:
From this printout you determine:
A) when tested at the 2% level of significance, there is no relationship between an employee's age and the number of days of work absences.
B) for each additional year of age, we can expect the number of days of absence to increase by 0.45 days.
C) almost 53% of the variation in the number of absent days can be explained by the variation in the employees ages.
D) when tested at the 2% level of significance, there is no relationship between an employee's age and the number of days of work absences; for each additional year of age,
Question
Information was collected from employee records to determine whether there is an association
Between an employee's age and the number or workdays they miss. Excel results are summarized
Below: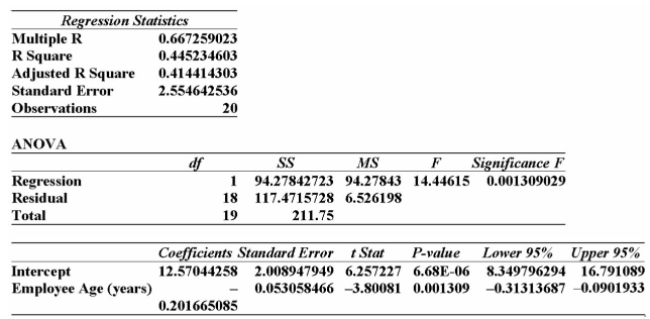
From this printout you determine:
A) when tested at the 2% level of significance, there is no relationship between an employee's age and the number of days of work absences.
B) for each additional year of age, we can expect the number of days of absence to decrease by 0.2 days.
C) almost 67% of the variation in the number of absent days can be explained by the variation in the employee's ages.
D) when tested at the 2% level of significance, there is relationship between an employee's age and the number of days of work absences. For each additional year of age, we can
Expect the number of days of absence to decrease by 0.2 days.
E) when tested at the 2% level of significance, there is no relationship between an employee's age and the number of days of work absences. Almost 67% of the variation in
Question
Question
Question
The partial MegaStat output below is regression analysis of the relationship between annual payroll
And number of wins in a season for 28 teams in professional sports. The purpose of the analysis is
To predict the number of wins when given an annual payroll in $millions. Although technically not a
Sample, the baseball data below will be treated as a convenience sample of all major league
Professional sports.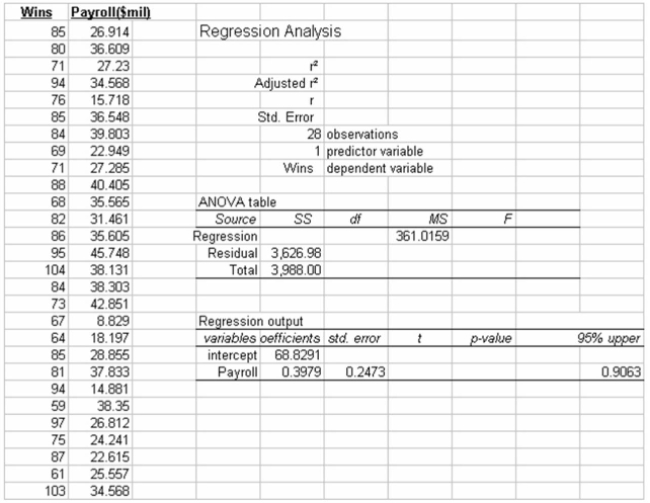
Refer to the printout above. The regression equation is:
A) = 2,049 + 68.8291x
B) = 82.5157 + 28.2049x
C) = 28.2049 + 7.5888x
D) = 82.5157 + 7.5888x
E)
And number of wins in a season for 28 teams in professional sports. The purpose of the analysis is
To predict the number of wins when given an annual payroll in $millions. Although technically not a
Sample, the baseball data below will be treated as a convenience sample of all major league
Professional sports.
Refer to the printout above. The regression equation is:
A)
= 2,049 + 68.8291xB)
= 82.5157 + 28.2049xC)
= 28.2049 + 7.5888xD)
= 82.5157 + 7.5888xE)
Question
The partial megastat output below is regression analysis of the relationship between annual payroll
And number of wins in a season for 28 teams in professional sports. The purpose of the analysis is
To predict the number of wins when given an annual payroll in $millions. Although technically not a
Sample, the baseball data below will be treated as a convenience sample of all major league
Professional sports.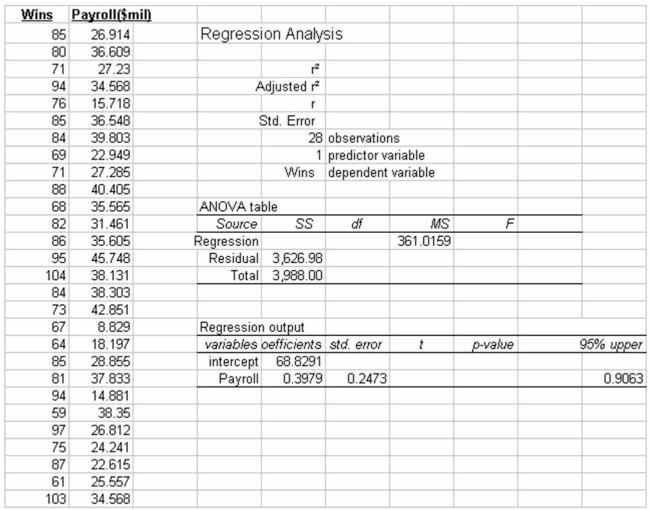
Refer to the printout above. The regression equation is:
A) = 0.379 + 68.8291x
B) = 68.8291 + 0.3979x
C) = 0.2473 + 0.3979x
D) = 68.8291 + 0.2473x
E)
And number of wins in a season for 28 teams in professional sports. The purpose of the analysis is
To predict the number of wins when given an annual payroll in $millions. Although technically not a
Sample, the baseball data below will be treated as a convenience sample of all major league
Professional sports.
Refer to the printout above. The regression equation is:
A)
= 0.379 + 68.8291xB)
= 68.8291 + 0.3979xC)
= 0.2473 + 0.3979xD)
= 68.8291 + 0.2473xE)
Question
We have collected price per share and dividend information from a sample of 30 companies. Using
The MegaStat printout, determine the regression equation that predicts the dividend from the
Stock's selling price.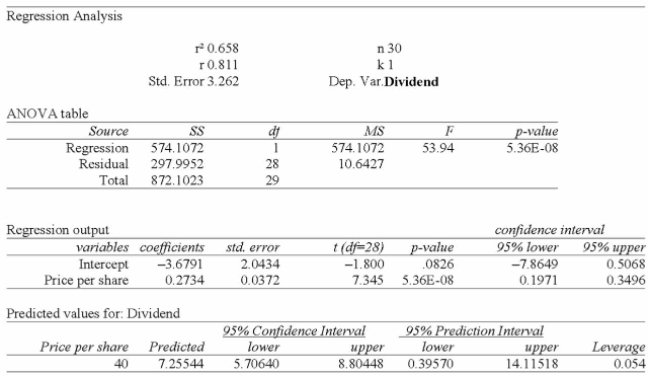
A) Y = 0.27 +3.68x
B) Y = 0.27x + 3.68
C) Y = -3.68 + 0.27x
D) Y = -0.27x - 3.68
E) Y=0.27x-3.6791
The MegaStat printout, determine the regression equation that predicts the dividend from the
Stock's selling price.
A) Y = 0.27 +3.68x
B) Y = 0.27x + 3.68
C) Y = -3.68 + 0.27x
D) Y = -0.27x - 3.68
E) Y=0.27x-3.6791
Question
A sales manager for an advertising agency believes there is a relationship between the number of
Contacts and the amount of the sales. To verify this believe, the following data was collected:
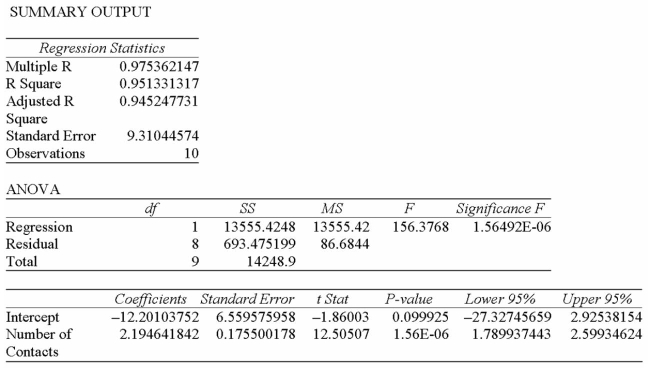
The y-intercept in this instance suggests:
A) for each additional contact made, the salesperson can anticipate an additional $2,195 in sales.
B) when no contacts are made, the salesperson can anticipate sales of $2,195.
C) for each additional contact made, the salesperson can anticipate a drop of $12,201 in sales.
D) when no contacts are made, the salesperson can anticipate sales of $12,201.
E) when no contacts are made, the salesperson can anticipate negative sales-therefore the
regression model doesn't make sense for no contacts.
Contacts and the amount of the sales. To verify this believe, the following data was collected:
The y-intercept in this instance suggests:
A) for each additional contact made, the salesperson can anticipate an additional $2,195 in sales.
B) when no contacts are made, the salesperson can anticipate sales of $2,195.
C) for each additional contact made, the salesperson can anticipate a drop of $12,201 in sales.
D) when no contacts are made, the salesperson can anticipate sales of $12,201.
E) when no contacts are made, the salesperson can anticipate negative sales-therefore the
regression model doesn't make sense for no contacts.
Question
A sales manager for an advertising agency believes there is a relationship between the number of
Contacts and the amount of the sales. To verify this believe, the following data was collected: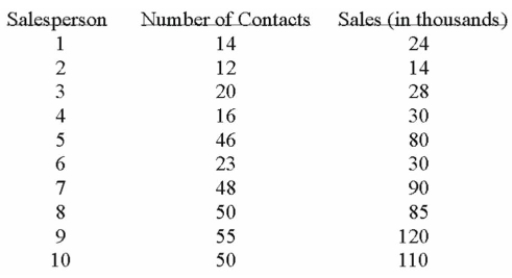

The slope in this instance indicates:
A) for each additional contact made, the salesperson can anticipate an additional $2195 in sales.
B) for each additional sale made, the salesperson can anticipate an additional 2 contacts are needed.
C) for each additional contact made, the salesperson can anticipate an additional $2.19 in sales.
D) for each additional contact made, the salesperson can anticipate an additional $12,201 in sales.
Contacts and the amount of the sales. To verify this believe, the following data was collected:
The slope in this instance indicates:
A) for each additional contact made, the salesperson can anticipate an additional $2195 in sales.
B) for each additional sale made, the salesperson can anticipate an additional 2 contacts are needed.
C) for each additional contact made, the salesperson can anticipate an additional $2.19 in sales.
D) for each additional contact made, the salesperson can anticipate an additional $12,201 in sales.
Question
Question
A sales manager for an advertising agency believes there is a relationship between the number of
Contacts and the amount of the sales. To verify this believe, the following data was collected:

What is the Y-intercept of the linear equation?
A) -12.201
B) 2.1946
C) -2.1946
D) 12.201 Multiple Choice Difficulty: Medium Learning
Contacts and the amount of the sales. To verify this believe, the following data was collected:
What is the Y-intercept of the linear equation?
A) -12.201
B) 2.1946
C) -2.1946
D) 12.201 Multiple Choice Difficulty: Medium Learning
Question
Question
We have collected price per share and dividend information from a sample of 30 companies. 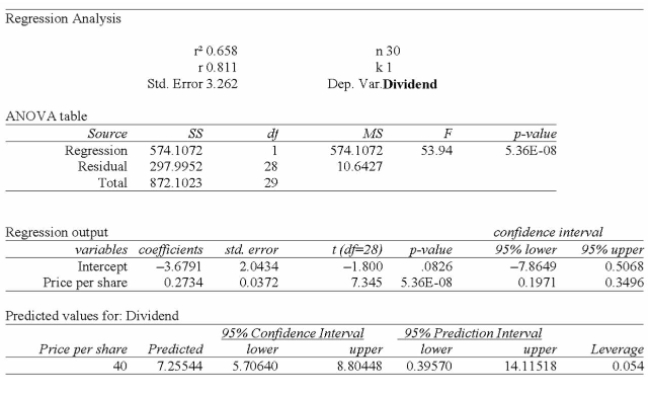 The y-intercept in this instance suggests:
A) for each additional dollar in stock price, we can anticipate an additional $2.73 in dividend.
B) for each additional dollar in stock price, we can anticipate a drop of $2.41 in dividend.
C) when the stock price is zero, we can anticipate a dividend of $0.27. This value, however, makes no sense.
D) when the stock price is zero, we can anticipate a dividend of $-3.68. This value, however, makes no sense.
E) when the dividends are zero, we can anticipate a negative share price.
The y-intercept in this instance suggests:A) for each additional dollar in stock price, we can anticipate an additional $2.73 in dividend.
B) for each additional dollar in stock price, we can anticipate a drop of $2.41 in dividend.
C) when the stock price is zero, we can anticipate a dividend of $0.27. This value, however, makes no sense.
D) when the stock price is zero, we can anticipate a dividend of $-3.68. This value, however, makes no sense.
E) when the dividends are zero, we can anticipate a negative share price.
Question
Data is collected from 20 sales people in order to verify that the more contacts made with potential
Clients, the greater the sales volume. The Excel printout is shown below.
The y-intercept in this instance suggests:
A) for each additional contact made, the salesperson can anticipate an additional $193 in sales.
B) for each additional contact made, the salesperson can anticipate a drop of $1983 in sales.
C) when no contacts are made, the salesperson can anticipate sales of $7554.
D) when no contacts are made, the salesperson can anticipate sales of $1983.
E) when no contacts are made, the salesperson can anticipate negative sales - therefore the regression model doesn't make sense for no contacts.
Question
A sales manager for an advertising agency believes there is a relationship between the number of
Contacts and the amount of the sales. To verify this believe, the following data was collected:
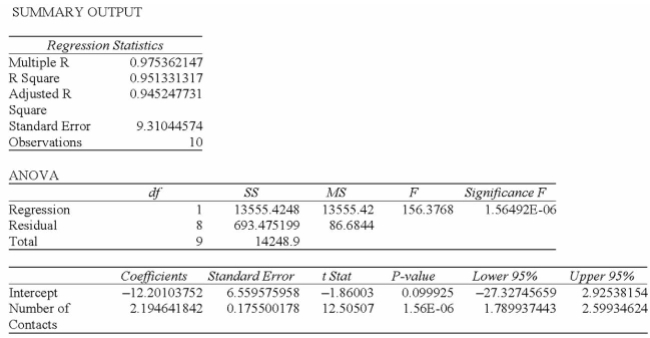
What is the slope of the linear equation?
A) -12.201
B) 12.201
C) 2.1946
D) -2.1946 Multiple Choice Difficulty: Medium Learning
Contacts and the amount of the sales. To verify this believe, the following data was collected:
What is the slope of the linear equation?
A) -12.201
B) 12.201
C) 2.1946
D) -2.1946 Multiple Choice Difficulty: Medium Learning
Question
Question
Information was collected from employee records to determine whether there is an association
Between an employee's age and the number or workdays they miss. Partial excel results are
Summarized below from two different samples: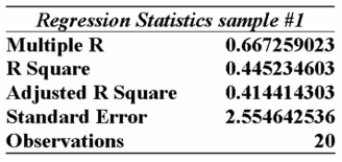
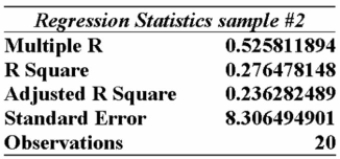
Given this information alone, would you decide to continue with the regression analysis for sample
#1 or #2 or both?
A) Continue with both samples, because the sample sizes are over 15.
B) Continue with sample #1 because the multiple r value is larger than that of sample #2.
C) Continue with sample #2 because the multiple r value is larger than that of sample #1.
D) Don't continue with either sample, because the standard error values are more than 2.
E) Don't continue with either sample, because the sample sizes are too small to be of use.
Between an employee's age and the number or workdays they miss. Partial excel results are
Summarized below from two different samples:
Given this information alone, would you decide to continue with the regression analysis for sample
#1 or #2 or both?
A) Continue with both samples, because the sample sizes are over 15.
B) Continue with sample #1 because the multiple r value is larger than that of sample #2.
C) Continue with sample #2 because the multiple r value is larger than that of sample #1.
D) Don't continue with either sample, because the standard error values are more than 2.
E) Don't continue with either sample, because the sample sizes are too small to be of use.
Question
Question
The partial MegaStat output below is regression analysis of the relationship between annual payroll
And number of wins in a season for 28 teams in professional sports. The purpose of the analysis is
To predict the number of wins when given an annual payroll in $millions. Although technically not a
Sample, the baseball data below will be treated as a convenience sample of all major league
Professional sports.
Refer to the printout above. Predict the number of wins for a team with PAYROLL = 25(million)
(nearest whole number)
A) 10
B) 69
C) 79
D) 74
E) 64 Multiple Choice Difficulty: Medium Learning
Question
We have collected price per share and dividend information from a sample of 30 companies.  The slope in this instance indicates:
A) for each additional dollar in stock price, we can anticipate an additional $2.73 in dividend.
B) for each additional dollar in stock price, we can anticipate an additional $3.68 in dividend.
C) for each additional dollar in stock price, we can anticipate an additional $0.27 in dividend.
D) for each additional dollar in dividend, we can anticipate an additional $2.71 in stock price.
E) for each additional dollar in dividend, we can anticipate a drop of $3.68 in stock price.
The slope in this instance indicates:A) for each additional dollar in stock price, we can anticipate an additional $2.73 in dividend.
B) for each additional dollar in stock price, we can anticipate an additional $3.68 in dividend.
C) for each additional dollar in stock price, we can anticipate an additional $0.27 in dividend.
D) for each additional dollar in dividend, we can anticipate an additional $2.71 in stock price.
E) for each additional dollar in dividend, we can anticipate a drop of $3.68 in stock price.
Question
Data is collected from 20 sales people in order to verify that the more contacts made with potential
Clients, the greater the sales volume. The Excel printout is shown below.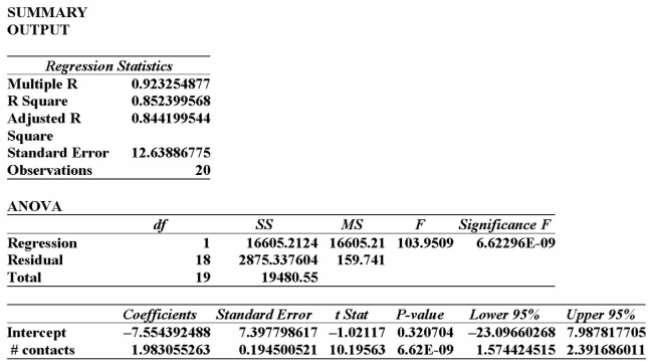
The slope in this instance indicates:
A) for each additional contact made, the salesperson can anticipate an additional $1983 in sales.
B) for each additional contact made, the salesperson can anticipate an additional $1.98 in sales.
C) for each additional contact made, the salesperson can anticipate an additional $7,554 in sales.
D) for each additional contact made, the salesperson can anticipate a drop of $7,554 in sales.
E) for each additional sale made, the salesperson can anticipate an additional 2 contacts are needed.
Question
Question
A sales manager for an advertising agency believes there is a relationship between the number of
Contacts and the amount of the sales. To verify this belief, the following data was collected: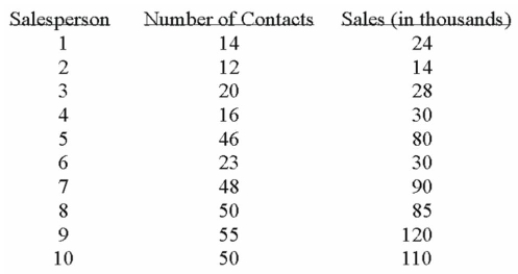
What is the regression equation?
A) Y' = 2.1946 - 12.201X
B) Y' = -12.201 + 2.1946X
C) Y' = 12.201 + 2.1946X
D) Y' = 2.1946 + 12.201X Multiple Choice Difficulty: Medium Learning
Contacts and the amount of the sales. To verify this belief, the following data was collected:
What is the regression equation?
A) Y' = 2.1946 - 12.201X
B) Y' = -12.201 + 2.1946X
C) Y' = 12.201 + 2.1946X
D) Y' = 2.1946 + 12.201X Multiple Choice Difficulty: Medium Learning
Question
Question
Question
Question
Question
Question
Use the scatter diagrams to verify which statements are correct:
Chart A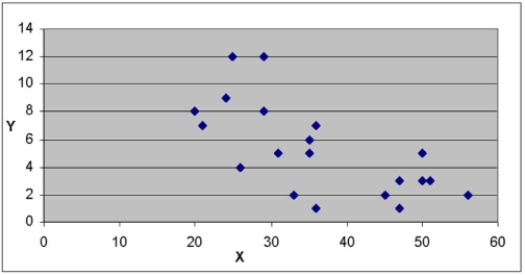
Chart B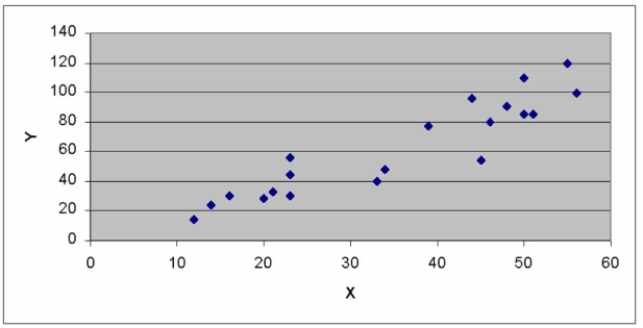
Chart C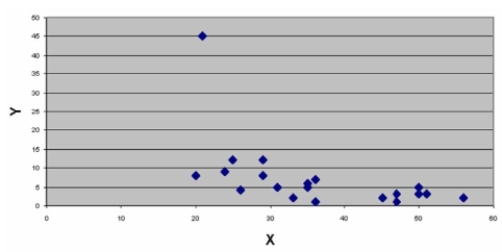
A) The variables in Chart A have a strong positive correlation.
B) The variables in Chart C have a strong positive correlation.
C) The variables in Chart B have a negative correlation.
D) Charts A & B have no obvious outliers.
Chart A
Chart B
Chart C
A) The variables in Chart A have a strong positive correlation.
B) The variables in Chart C have a strong positive correlation.
C) The variables in Chart B have a negative correlation.
D) Charts A & B have no obvious outliers.
Question
Question
Question
Question
Question
Question
Question
The partial MegaStat output below is regression analysis of the relationship between annual payroll
And number of wins in a season for 28 teams in professional sports. The purpose of the analysis is
To predict the number of wins when given an annual payroll in $millions. Although technically not a
Sample, the baseball data below will be treated as a convenience sample of all major league
Professional sports.
Refer to the printout above. Predict the number of wins for a team with PAYROLL = 25(million)
(nearest whole number)
A) 10
B) 69
C) 79
D) 74
E) 64 Multiple Choice Difficulty: Hard Learning
Question
Question
Question
Question
Question
Question
Question
The partial MegaStat output below is regression analysis of the relationship between annual payroll
And number of wins in a season for 28 teams in professional sports. The purpose of the analysis is
To predict the number of wins when given an annual payroll in $millions. Although technically not a
Sample, the baseball data below will be treated as a convenience sample of all major league
Professional sports.
Refer to the printout above. How many independent variables?
A) 1
B) 2
C) 9
D) 10
E) 11

Unlock Deck
Sign up to unlock the cards in this deck!
Unlock Deck
Unlock Deck
1/173
Play
Full screen (f)
Deck 12: Analysis of Variance
1
i. If we are studying the relationship between high school performance and college performance,
And want to predict college performance, high school performance is the independent variable.
ii. An economist is interested in predicting the unemployment rate based on gross domestic
Product. Since the economist is interested in predicting unemployment, the independent variable is
Gross domestic product.
iii. The variable used to predict the value of another is called the dependent variable.
A) (i), (ii), and (iii) are all correct statements.
B) (i) and (ii) are correct statements but not (iii).
C) (i) and (iii) are correct statements but not (ii).
D) (ii) and (iii) are correct statements but not (i).
E) (i), (ii), and (iii) are all false statements.
(i) and (ii) are correct statements but not (iii).
2
What is the chart called when the paired data (the dependent and independent variables) are
Plotted?
A) Scatter diagram
B) Bar
C) Pie
D) Linear regression
Plotted?
A) Scatter diagram
B) Bar
C) Pie
D) Linear regression
Scatter diagram
3
In the regression equation, Y' = a + bX, what does the letter "a" represent?
A) Y intercept
B) Slope of the line
C) Any value of the independent variable that is selected
A) Y intercept
B) Slope of the line
C) Any value of the independent variable that is selected
Y intercept
4
Data is collected from 20 sales people in order to verify that the more contacts made with potential
Clients, the greater the sales volume. A scatter diagram of the collected information is shown below.
Looking at this scatter diagram you determine:
A) there is clearly no relationship between the number of sales contacts made and the sales earned.
B) there is a moderate but inverse relationship between the two variables.
C) there is a moderate and direct relationship between the two variables.
D) the Sales ($000s) is the independent variable.
Unlock Deck
Unlock for access to all 173 flashcards in this deck.
Unlock Deck
k this deck
5
A sales manager for an advertising agency believes there is a relationship between the number of
Contacts and the amount of the sales. To verify this believe, the following data was collected:
What is the independent variable?
A) Salesperson
B) Number of contacts
C) Amount of sales Multiple Choice Difficulty: Medium Learning
Contacts and the amount of the sales. To verify this believe, the following data was collected:
What is the independent variable?
A) Salesperson
B) Number of contacts
C) Amount of sales Multiple Choice Difficulty: Medium Learning
Unlock Deck
Unlock for access to all 173 flashcards in this deck.
Unlock Deck
k this deck
6
A sales manager for an advertising agency believes there is a relationship between the number of
Contacts and the amount of the sales. To verify this believe, the following data was collected:
What is the dependent variable?
A) Salesperson
B) Number of contacts
C) Amount of sales Multiple Choice Difficulty: Medium Learning
Contacts and the amount of the sales. To verify this believe, the following data was collected:
What is the dependent variable?
A) Salesperson
B) Number of contacts
C) Amount of sales Multiple Choice Difficulty: Medium Learning
Unlock Deck
Unlock for access to all 173 flashcards in this deck.
Unlock Deck
k this deck
7
i. In order to visualize the form of the regression equation, we can draw a scatter diagram.
ii. When a regression line has a zero slope, indicating a lack of a relationship, the line is vertical to
The x-axis.
iii. In regression analysis, the predicted value of Y' rarely agrees exactly with the actual Y value, i.e.,
We expect some prediction error.
A) (i), (ii), and (iii) are all correct statements.
B) (i) and (ii) are correct statements but not (iii).
C) (i) and (iii) are correct statements but not (ii).
D) (ii) and (iii) are correct statements but not (i).
E) (i), (ii), and (iii) are all false statements.
Unlock Deck
Unlock for access to all 173 flashcards in this deck.
Unlock Deck
k this deck
8
Given the scatter diagram below, that shows the number of workdays absent per year based on the
Age of the employees, which of the following statements are true?
A) There is clearly no relationship whatsoever between an employee's age and the number of workday absences that they take.
B) There is a single but strong outlier in this data set.
C) There appears to be an inverse relationship between the two variables.
D) There is a single but strong outlier in this data set, but clearly no relationship whatsoever between an employee's age and the number of workday absences that they take.
E) There is a single but strong outlier in this data set and an inverse relationship between the two variables.
Unlock Deck
Unlock for access to all 173 flashcards in this deck.
Unlock Deck
k this deck
9
i. The least squares technique minimizes the sum of the squares of the vertical distances between
The actual Y values and the predicted values of Y.
ii. When a regression line has a zero slope, indicating a lack of a relationship, the line is vertical to
The x-axis.
iii. In regression analysis, the predicted value of Y' rarely agrees exactly with the actual Y value, i.e.,
We expect some prediction error.
A) (i), (ii), and (iii) are all correct statements.
B) (i) and (ii) are correct statements but not (iii).
C) (i) and (iii) are correct statements but not (ii).
D) (ii) and (iii) are correct statements but not (i).
E) (i), (ii), and (iii) are all false statements.
Unlock Deck
Unlock for access to all 173 flashcards in this deck.
Unlock Deck
k this deck
10
i. If we are studying the relationship between high school performance and college performance,
And want to predict college performance, high school performance is the dependent variable.
ii. A financial advisor is interested in predicting bond yield based on bond term, i.e., one year, two
Years, etc. The dependent variable is bond term.
iii. The variable used to predict the value of another is called the dependent variable.
A) (i), (ii), and (iii) are all correct statements.
B) (i) and (ii) are correct statements but not (iii).
C) (i) and (iii) are correct statements but not (ii).
D) (ii) and (iii) are correct statements but not (i).
E) (i), (ii), and (iii) are all false statements.
Unlock Deck
Unlock for access to all 173 flashcards in this deck.
Unlock Deck
k this deck
11
i. A scatter diagram is a chart that portrays the relationship between two variables.
ii. If a scatter diagram shows very little scatter about a straight line drawn through the plots, it
Indicates a rather weak relationship.
iii. A scatter diagram may be put together using excel or MegaStat.
A) (i), (ii), and (iii) are all correct statements.
B) (i) and (ii) are correct statements but not (iii).
C) (i) and (iii) are correct statements but not (ii).
D) (ii) and (iii) are correct statements but not (i).
E) (i), (ii), and (iii) are all false statements.
Unlock Deck
Unlock for access to all 173 flashcards in this deck.
Unlock Deck
k this deck
12
A scatter diagram is a chart,
A) in which the dependent variable is scaled along the vertical axis.
B) in which the independent variable is scaled along the horizontal axis.
C) that portrays the relationship between two variables.
D) in which the dependent variable is scaled along the vertical axis, the independent variable is scaled along the horizontal axis and portrays the relationship between two variables.
Unlock Deck
Unlock for access to all 173 flashcards in this deck.
Unlock Deck
k this deck
13
i. The technique used to measure the strength of the relationship between two sets of variables
Using the coefficient of correlation and the coefficient of determination is called regression analysis.
ii. In order to visualize the form of the regression equation, we can draw a scatter diagram.
iii. When a regression line has a zero slope, indicating a lack of a relationship, the line is horizontal
To the x-axis.
A) (i), (ii), and (iii) are all correct statements.
B) (i) and (ii) are correct statements but not (iii).
C) (i) and (iii) are correct statements but not (ii).
D) (ii) and (iii) are correct statements but not (i).
E) (i), (ii), and (iii) are all false statements.
Unlock Deck
Unlock for access to all 173 flashcards in this deck.
Unlock Deck
k this deck
14
Given the scatter diagram below, that shows the number of workdays absent per year based on the
Age of the employees, which of the following statements are true?
A) There is clearly no relationship whatsoever between an employee's age and the number of workday absences that they take.
B) There is a single but strong outlier in this data set.
C) In analyzing this data, you may wish to remove the one point that doesn't "fit" with all the others before continuing your analysis.
D) There is clearly no relationship whatsoever between an employee's age and the number of workday absences that they take, however, there is a single but strong outlier in this
Data set.
E) There is a single but strong outlier in this data set; in analyzing this data, you may wish to remove the one point that doesn't "fit" with all the others before continuing your analysis.
Unlock Deck
Unlock for access to all 173 flashcards in this deck.
Unlock Deck
k this deck
15
Suppose the least squares regression equation is Y' = 1202 + 1,133X. When X = 3, what does Y'
Equal?
A) 5,734
B) 8,000
C) 4,601
D) 4,050
Equal?
A) 5,734
B) 8,000
C) 4,601
D) 4,050
Unlock Deck
Unlock for access to all 173 flashcards in this deck.
Unlock Deck
k this deck
16
Based on the regression equation, we can
A) predict the value of the dependent variable given a value of the independent variable.
B) predict the value of the independent variable given a value of the dependent variable.
C) measure the association between two variables.
A) predict the value of the dependent variable given a value of the independent variable.
B) predict the value of the independent variable given a value of the dependent variable.
C) measure the association between two variables.
Unlock Deck
Unlock for access to all 173 flashcards in this deck.
Unlock Deck
k this deck
17
i. If we are studying the relationship between high school performance and college performance,
And want to predict college performance, high school performance is the independent variable.
ii. A financial advisor is interested in predicting bond yield based on bond term, i.e., one year, two
Years, etc. The dependent variable is bond yield.
iii. The variable used to predict the value of another is called the independent variable.
A) (i), (ii), and (iii) are all correct statements.
B) (i) and (ii) are correct statements but not (iii).
C) (i) and (iii) are correct statements but not (ii).
D) (ii) and (iii) are correct statements but not (i).
E) (i), (ii), and (iii) are all false statements.
Unlock Deck
Unlock for access to all 173 flashcards in this deck.
Unlock Deck
k this deck
18
In the equation Y' = a + bX, what is Y'?
A) Slope of the line
B) Y intercept
C) Predicted value of Y, given a specific X value
D) Value of Y when X = 0
A) Slope of the line
B) Y intercept
C) Predicted value of Y, given a specific X value
D) Value of Y when X = 0
Unlock Deck
Unlock for access to all 173 flashcards in this deck.
Unlock Deck
k this deck
19
What is the variable used to predict the value of another called?
A) Independent
B) Dependent
C) Correlation
D) Determination
A) Independent
B) Dependent
C) Correlation
D) Determination
Unlock Deck
Unlock for access to all 173 flashcards in this deck.
Unlock Deck
k this deck
20
In the regression equation, Y' = a + bX, what does the letter "b" represent?
A) Y intercept
B) Slope of the line
C) Any value of the independent variable that is selected
D) Value of Y when X = 0
A) Y intercept
B) Slope of the line
C) Any value of the independent variable that is selected
D) Value of Y when X = 0
Unlock Deck
Unlock for access to all 173 flashcards in this deck.
Unlock Deck
k this deck
21
Data is collected from 20 sales people in order to verify that the more contacts made with potential
Clients, the greater the sales volume. The Excel printout is shown below.
This model predicts that with 25 sales contacts, sales will be:
A) $49 576.
B) $42 022.
C) $190 843.
D) $19 429.
E) $16 605.
Clients, the greater the sales volume. The Excel printout is shown below.
This model predicts that with 25 sales contacts, sales will be:
A) $49 576.
B) $42 022.
C) $190 843.
D) $19 429.
E) $16 605.
Unlock Deck
Unlock for access to all 173 flashcards in this deck.
Unlock Deck
k this deck
22
i. In order to visualize the form of the regression equation, we can draw a scatter diagram.
ii. The least squares technique minimizes the sum of the squares of the vertical distances between
The actual Y values and the predicted values of Y.
iii. In regression analysis, the predicted value of Y' rarely agrees exactly with the actual Y value, i.e.,
We expect some prediction error.
A) (i), (ii), and (iii) are all correct statements.
B) (i) and (ii) are correct statements but not (iii).
C) (i) and (iii) are correct statements but not (ii).
D) (ii) and (iii) are correct statements but not (i).
E) (i), (ii), and (iii) are all false statements.
Unlock Deck
Unlock for access to all 173 flashcards in this deck.
Unlock Deck
k this deck
23
Information was collected from employee records to determine whether there is an association
Between an employee's age and the number or workdays they miss. Excel results are summarized
Below:
From this printout you determine:
A) the y-intercept of 23 makes no sense.
B) for each additional year of age, we can expect the number of days of absence to increase by 0.45 days.
C) for each additional year of age, we can expect the number of days of absence to decrease by 0.45 days.
D) the y-intercept of 23 makes no sense; for each additional year of age, we can expect the number of days of absence to increase by 0.45 days.
E) the y-intercept of 23 makes no sense; for each additional year of age, we can expect the number of days of absence to decrease by 0.45 days.
Unlock Deck
Unlock for access to all 173 flashcards in this deck.
Unlock Deck
k this deck
24
In the least squares equation, Y' = 10 + 20 X the value of 20 indicates
A) the Y intercept.
B) for each unit increased in X, Y increases by 20.
C) for each unit increased in Y, X increases by 20.
A) the Y intercept.
B) for each unit increased in X, Y increases by 20.
C) for each unit increased in Y, X increases by 20.
Unlock Deck
Unlock for access to all 173 flashcards in this deck.
Unlock Deck
k this deck
25
Given the following five points: (-2,0), (-1,0), (0,1), (1,1), and (2,3).
What is the Y intercept?
A) 0.0
B) 0.7
C) 1.0
D) 1.5
What is the Y intercept?
A) 0.0
B) 0.7
C) 1.0
D) 1.5
Unlock Deck
Unlock for access to all 173 flashcards in this deck.
Unlock Deck
k this deck
26
Information was collected from employee records to determine whether there is an association
Between an employee's age and the number or workdays they miss. Excel results are summarized
Below:
From this printout you determine:
A) the employee age is the dependent variable.
B) the employee age is the independent variable.
C) the regression equation is Y = 23.57 - 0.45x.
D) the regression equation is Y = 23.57 x -0.45.
E) the employee age is the independent variable; the regression equation is Y = 23.57 - 0.45x.
Unlock Deck
Unlock for access to all 173 flashcards in this deck.
Unlock Deck
k this deck
27
Given the following five points: (-2,0), (-1,0), (0,1), (1,1), and (2,3).
What is the slope of the line?
A) 0.0
B) 0.5
C) 0.6
D) 0.7
What is the slope of the line?
A) 0.0
B) 0.5
C) 0.6
D) 0.7
Unlock Deck
Unlock for access to all 173 flashcards in this deck.
Unlock Deck
k this deck
28
Information was collected from employee records to determine whether there is an association
Between an employee's age and the number or workdays they miss. Excel results are summarized
Below:
From this printout you determine:
A) the employee age is the dependent variable.
B) the employee age is the independent variable.
C) the regression equation is Y = 23.57 - 8.3x.
D) the regression equation is Y = 23.57 x -0.45.
E) the employee age is the independent variable; the regression equation is Y = 23.57 + 0.45x.
Unlock Deck
Unlock for access to all 173 flashcards in this deck.
Unlock Deck
k this deck
29
i. The technique used to measure the strength of the relationship between two sets of variables
Using the coefficient of correlation and the coefficient of determination is called regression analysis.
ii. In order to visualize the form of the regression equation, we can draw a scatter diagram.
iii. When a regression line has a zero slope, indicating a lack of a relationship, the line is horizontal
To the x-axis.
A) (i), (ii), and (iii) are all correct statements.
B) (i) and (ii) are correct statements but not (iii).
C) (i) and (iii) are correct statements but not (ii).
D) (ii) and (iii) are correct statements but not (i).
E) (i), (ii), and (iii) are all false statements.
Using the coefficient of correlation and the coefficient of determination is called regression analysis.
ii. In order to visualize the form of the regression equation, we can draw a scatter diagram.
iii. When a regression line has a zero slope, indicating a lack of a relationship, the line is horizontal
To the x-axis.
A) (i), (ii), and (iii) are all correct statements.
B) (i) and (ii) are correct statements but not (iii).
C) (i) and (iii) are correct statements but not (ii).
D) (ii) and (iii) are correct statements but not (i).
E) (i), (ii), and (iii) are all false statements.
Unlock Deck
Unlock for access to all 173 flashcards in this deck.
Unlock Deck
k this deck
30
i. The technique used to measure the strength of the relationship between two sets of variables
Using the coefficient of correlation and the coefficient of determination is called regression analysis.
ii. In order to visualize the form of the regression equation, we can draw a scatter diagram.
iii. The equation for a straight line going through the plots on a scatter diagram is called a
Regression equation. It is alternately called an estimating equation and a predicting equation.
A) (i), (ii), and (iii) are all correct statements.
B) (i) and (ii) are correct statements but not (iii).
C) (i) and (iii) are correct statements but not (ii).
D) (ii) and (iii) are correct statements but not (i).
E) (i), (ii), and (iii) are all false statements.
Unlock Deck
Unlock for access to all 173 flashcards in this deck.
Unlock Deck
k this deck
31
i. The technique used to measure the strength of the relationship between two sets of variables
Using the coefficient of correlation and the coefficient of determination is called regression analysis.
ii. In order to visualize the form of the regression equation, we can draw a scatter diagram.
iii. The least squares technique minimizes the sum of the squares of the vertical distances between
The actual Y values and the predicted values of Y.
A) (i), (ii), and (iii) are all correct statements.
B) (i) and (ii) are correct statements but not (iii).
C) (i) and (iii) are correct statements but not (ii).
D) (ii) and (iii) are correct statements but not (i).
E) (i), (ii), and (iii) are all false statements.
Unlock Deck
Unlock for access to all 173 flashcards in this deck.
Unlock Deck
k this deck
32
Information was collected from employee records to determine whether there is an association
Between an employee's age and the number or workdays they miss. Excel results are summarized
Below:
From this printout you determine:
A) the y-intercept of 23 makes no sense.
B) the employee age is the independent variable.
C) the regression equation is Y = 23.57 - 0.45x.
D) the employee age is the independent variable; the regression equation is Y = 23.57 - 0.45x.
E) the employee age is the independent variable; the regression equation is Y = 23.57 - 0.45x, however the y-intercept of 23 makes no sense.
Unlock Deck
Unlock for access to all 173 flashcards in this deck.
Unlock Deck
k this deck
33
Data is collected from 20 sales people in order to verify that the more contacts made with potential
Clients, the greater the sales volume. The Excel printout is shown below.
From this printout you determine:
A) there is a very weak relationship between the # of contacts and the sales $.
B) there is a very strong relationship between the # of contacts and the sales $.
C) the regression equation is y = 1.98 x +7.55.
D) the regression equation is y = -7.55 x +1.98.
Unlock Deck
Unlock for access to all 173 flashcards in this deck.
Unlock Deck
k this deck
34
i. In order to visualize the form of the regression equation, we can draw a scatter diagram.
ii. In regression analysis, the predicted value of Y' rarely agrees exactly with the actual Y value, i.e.,
We expect some prediction error.
iii. The technique used to measure the strength of the relationship between two sets of variables
Using the coefficient of correlation and the coefficient of determination is called regression analysis.
A) (i), (ii), and (iii) are all correct statements.
B) (i) and (ii) are correct statements but not (iii).
C) (i) and (iii) are correct statements but not (ii).
D) (ii) and (iii) are correct statements but not (i).
E) (i), (ii), and (iii) are all false statements.
Unlock Deck
Unlock for access to all 173 flashcards in this deck.
Unlock Deck
k this deck
35
Assume the least squares equation is Y' = 10 + 20X. What does the value of 10 in the equation
Indicate?
A) Y intercept
B) For each unit increased in Y, X increases by 10
C) For each unit increased in X, Y increases by 10
Indicate?
A) Y intercept
B) For each unit increased in Y, X increases by 10
C) For each unit increased in X, Y increases by 10
Unlock Deck
Unlock for access to all 173 flashcards in this deck.
Unlock Deck
k this deck
36
Information was collected from employee records to determine whether there is an association
Between an employee's age and the number or workdays they miss. Excel results are summarized
Below:
From this printout you determine:
A) the employee age is the dependent variable.
B) the employee age is the independent variable.
C) the older the employee the more days they are absent from work.
D) the intercept of 23 indicates the most days absent.
Unlock Deck
Unlock for access to all 173 flashcards in this deck.
Unlock Deck
k this deck
37
i. The technique used to measure the strength of the relationship between two sets of variables
Using the coefficient of correlation and the coefficient of determination is called regression analysis.
ii. In order to visualize the form of the regression equation, we can draw a scatter diagram.
iii. A line found using the least squares principle is the best-fitting line because the sum of the
Squares of the vertical deviations between the actual and estimated values is minimized.
A) (i), (ii), and (iii) are all correct statements.
B) (i) and (ii) are correct statements but not (iii).
C) (i) and (iii) are correct statements but not (ii).
D) (ii) and (iii) are correct statements but not (i).
E) (i), (ii), and (iii) are all false statements.
Unlock Deck
Unlock for access to all 173 flashcards in this deck.
Unlock Deck
k this deck
38
Information was collected from employee records to determine whether there is an association
Between an employee's age and the number or workdays they miss. Excel results are summarized
Below:
From this printout you determine:
A) when tested at the 2% level of significance, there is no relationship between an employee's age and the number of days of work absences.
B) for each additional year of age, we can expect the number of days of absence to increase by 0.45 days.
C) almost 53% of the variation in the number of absent days can be explained by the variation in the employees ages.
D) when tested at the 2% level of significance, there is no relationship between an employee's age and the number of days of work absences; for each additional year of age,
Unlock Deck
Unlock for access to all 173 flashcards in this deck.
Unlock Deck
k this deck
39
Information was collected from employee records to determine whether there is an association
Between an employee's age and the number or workdays they miss. Excel results are summarized
Below:
From this printout you determine:
A) when tested at the 2% level of significance, there is no relationship between an employee's age and the number of days of work absences.
B) for each additional year of age, we can expect the number of days of absence to decrease by 0.2 days.
C) almost 67% of the variation in the number of absent days can be explained by the variation in the employee's ages.
D) when tested at the 2% level of significance, there is relationship between an employee's age and the number of days of work absences. For each additional year of age, we can
Expect the number of days of absence to decrease by 0.2 days.
E) when tested at the 2% level of significance, there is no relationship between an employee's age and the number of days of work absences. Almost 67% of the variation in
Unlock Deck
Unlock for access to all 173 flashcards in this deck.
Unlock Deck
k this deck
40
i. The technique used to measure the strength of the relationship between two sets of variables
Using the coefficient of correlation and the coefficient of determination is called regression analysis.
ii. In order to visualize the form of the regression equation, we can draw a scatter diagram.
iii. A regression equation may be determined using a mathematical method called the least squares
Principle.
A) (i), (ii), and (iii) are all correct statements.
B) (i) and (ii) are correct statements but not (iii).
C) (i) and (iii) are correct statements but not (ii).
D) (ii) and (iii) are correct statements but not (i).
E) (i), (ii), and (iii) are all false statements.
Unlock Deck
Unlock for access to all 173 flashcards in this deck.
Unlock Deck
k this deck
41
The partial MegaStat output below is regression analysis of the relationship between annual payroll
And number of wins in a season for 28 teams in professional sports. The purpose of the analysis is
To predict the number of wins when given an annual payroll in $millions. Although technically not a
Sample, the baseball data below will be treated as a convenience sample of all major league
Professional sports.
Refer to the printout above. Predict the number of wins for a team with a payroll of $36,000,000.
A) 80
B) 82
C) 83
D) 68
E) 81501
Unlock Deck
Unlock for access to all 173 flashcards in this deck.
Unlock Deck
k this deck
42
The partial MegaStat output below is regression analysis of the relationship between annual payroll
And number of wins in a season for 28 teams in professional sports. The purpose of the analysis is
To predict the number of wins when given an annual payroll in $millions. Although technically not a
Sample, the baseball data below will be treated as a convenience sample of all major league
Professional sports.
Refer to the printout above. The regression equation is:
A) = 2,049 + 68.8291x
B) = 82.5157 + 28.2049x
C) = 28.2049 + 7.5888x
D) = 82.5157 + 7.5888x
E)
And number of wins in a season for 28 teams in professional sports. The purpose of the analysis is
To predict the number of wins when given an annual payroll in $millions. Although technically not a
Sample, the baseball data below will be treated as a convenience sample of all major league
Professional sports.
Refer to the printout above. The regression equation is:
A)
= 2,049 + 68.8291xB)
= 82.5157 + 28.2049xC)
= 28.2049 + 7.5888xD)
= 82.5157 + 7.5888xE)
Unlock Deck
Unlock for access to all 173 flashcards in this deck.
Unlock Deck
k this deck
43
The partial megastat output below is regression analysis of the relationship between annual payroll
And number of wins in a season for 28 teams in professional sports. The purpose of the analysis is
To predict the number of wins when given an annual payroll in $millions. Although technically not a
Sample, the baseball data below will be treated as a convenience sample of all major league
Professional sports.
Refer to the printout above. The regression equation is:
A) = 0.379 + 68.8291x
B) = 68.8291 + 0.3979x
C) = 0.2473 + 0.3979x
D) = 68.8291 + 0.2473x
E)
And number of wins in a season for 28 teams in professional sports. The purpose of the analysis is
To predict the number of wins when given an annual payroll in $millions. Although technically not a
Sample, the baseball data below will be treated as a convenience sample of all major league
Professional sports.
Refer to the printout above. The regression equation is:
A)
= 0.379 + 68.8291xB)
= 68.8291 + 0.3979xC)
= 0.2473 + 0.3979xD)
= 68.8291 + 0.2473xE)
Unlock Deck
Unlock for access to all 173 flashcards in this deck.
Unlock Deck
k this deck
44
We have collected price per share and dividend information from a sample of 30 companies. Using
The MegaStat printout, determine the regression equation that predicts the dividend from the
Stock's selling price.
A) Y = 0.27 +3.68x
B) Y = 0.27x + 3.68
C) Y = -3.68 + 0.27x
D) Y = -0.27x - 3.68
E) Y=0.27x-3.6791
The MegaStat printout, determine the regression equation that predicts the dividend from the
Stock's selling price.
A) Y = 0.27 +3.68x
B) Y = 0.27x + 3.68
C) Y = -3.68 + 0.27x
D) Y = -0.27x - 3.68
E) Y=0.27x-3.6791
Unlock Deck
Unlock for access to all 173 flashcards in this deck.
Unlock Deck
k this deck
45
A sales manager for an advertising agency believes there is a relationship between the number of
Contacts and the amount of the sales. To verify this believe, the following data was collected:
The y-intercept in this instance suggests:
A) for each additional contact made, the salesperson can anticipate an additional $2,195 in sales.
B) when no contacts are made, the salesperson can anticipate sales of $2,195.
C) for each additional contact made, the salesperson can anticipate a drop of $12,201 in sales.
D) when no contacts are made, the salesperson can anticipate sales of $12,201.
E) when no contacts are made, the salesperson can anticipate negative sales-therefore the
regression model doesn't make sense for no contacts.
Unlock Deck
Unlock for access to all 173 flashcards in this deck.
Unlock Deck
k this deck
46
A sales manager for an advertising agency believes there is a relationship between the number of
Contacts and the amount of the sales. To verify this believe, the following data was collected:
The slope in this instance indicates:
A) for each additional contact made, the salesperson can anticipate an additional $2195 in sales.
B) for each additional sale made, the salesperson can anticipate an additional 2 contacts are needed.
C) for each additional contact made, the salesperson can anticipate an additional $2.19 in sales.
D) for each additional contact made, the salesperson can anticipate an additional $12,201 in sales.
Unlock Deck
Unlock for access to all 173 flashcards in this deck.
Unlock Deck
k this deck
47
i. A coefficient of correlation r close to 0 (say, 0.08) shows that the relationship between two
Variables is quite weak.
ii. A coefficient of correlation of -0.96 indicates a very weak negative correlation.
iii. The coefficient of determination can only be positive.
A) (i), (ii), and (iii) are all correct statements.
B) (i) and (ii) are correct statements but not (iii).
C) (i) and (iii) are correct statements but not (ii).
D) (ii) and (iii) are correct statements but not (i).
E) (i), (ii), and (iii) are all false statements.
Unlock Deck
Unlock for access to all 173 flashcards in this deck.
Unlock Deck
k this deck
48
A sales manager for an advertising agency believes there is a relationship between the number of
Contacts and the amount of the sales. To verify this believe, the following data was collected:
What is the Y-intercept of the linear equation?
A) -12.201
B) 2.1946
C) -2.1946
D) 12.201 Multiple Choice Difficulty: Medium Learning
Contacts and the amount of the sales. To verify this believe, the following data was collected:
What is the Y-intercept of the linear equation?
A) -12.201
B) 2.1946
C) -2.1946
D) 12.201 Multiple Choice Difficulty: Medium Learning
Unlock Deck
Unlock for access to all 173 flashcards in this deck.
Unlock Deck
k this deck
49
i. The strength of the correlation between two variables depends on the sign of the coefficient of
Correlation.
ii. A coefficient of correlation r close to 0 (say, 0.08) shows that the relationship between two
Variables is quite weak.
iii. Coefficients of -0.91 and +0.91 have equal strength.
A) (i), (ii), and (iii) are all correct statements.
B) (i) and (ii) are correct statements but not (iii).
C) (i) and (iii) are correct statements but not (ii).
D) (ii) and (iii) are correct statements but not (i).
E) (i), (ii), and (iii) are all false statements.
Unlock Deck
Unlock for access to all 173 flashcards in this deck.
Unlock Deck
k this deck
50
We have collected price per share and dividend information from a sample of 30 companies. The y-intercept in this instance suggests:
A) for each additional dollar in stock price, we can anticipate an additional $2.73 in dividend.
B) for each additional dollar in stock price, we can anticipate a drop of $2.41 in dividend.
C) when the stock price is zero, we can anticipate a dividend of $0.27. This value, however, makes no sense.
D) when the stock price is zero, we can anticipate a dividend of $-3.68. This value, however, makes no sense.
E) when the dividends are zero, we can anticipate a negative share price.
The y-intercept in this instance suggests:A) for each additional dollar in stock price, we can anticipate an additional $2.73 in dividend.
B) for each additional dollar in stock price, we can anticipate a drop of $2.41 in dividend.
C) when the stock price is zero, we can anticipate a dividend of $0.27. This value, however, makes no sense.
D) when the stock price is zero, we can anticipate a dividend of $-3.68. This value, however, makes no sense.
E) when the dividends are zero, we can anticipate a negative share price.
Unlock Deck
Unlock for access to all 173 flashcards in this deck.
Unlock Deck
k this deck
51
Data is collected from 20 sales people in order to verify that the more contacts made with potential
Clients, the greater the sales volume. The Excel printout is shown below.
The y-intercept in this instance suggests:
A) for each additional contact made, the salesperson can anticipate an additional $193 in sales.
B) for each additional contact made, the salesperson can anticipate a drop of $1983 in sales.
C) when no contacts are made, the salesperson can anticipate sales of $7554.
D) when no contacts are made, the salesperson can anticipate sales of $1983.
E) when no contacts are made, the salesperson can anticipate negative sales - therefore the regression model doesn't make sense for no contacts.
Unlock Deck
Unlock for access to all 173 flashcards in this deck.
Unlock Deck
k this deck
52
A sales manager for an advertising agency believes there is a relationship between the number of
Contacts and the amount of the sales. To verify this believe, the following data was collected:
What is the slope of the linear equation?
A) -12.201
B) 12.201
C) 2.1946
D) -2.1946 Multiple Choice Difficulty: Medium Learning
Contacts and the amount of the sales. To verify this believe, the following data was collected:
What is the slope of the linear equation?
A) -12.201
B) 12.201
C) 2.1946
D) -2.1946 Multiple Choice Difficulty: Medium Learning
Unlock Deck
Unlock for access to all 173 flashcards in this deck.
Unlock Deck
k this deck
53
i. A coefficient of correlation r close to 0 (say, 0.08) shows that the relationship between two
Variables is quite weak.
ii. The coefficient of determination is the proportion of the total variation in the dependent variable
Y that is explained or accounted for by its relationship with the independent variable X.
iii. If the coefficient of correlation is -0.90, the coefficient of determination is -0.81.
A) (i), (ii), and (iii) are all correct statements.
B) (i) and (ii) are correct statements but not (iii).
C) (i) and (iii) are correct statements but not (ii).
D) (ii) and (iii) are correct statements but not (i).
E) (i), (ii), and (iii) are all false statements.
Unlock Deck
Unlock for access to all 173 flashcards in this deck.
Unlock Deck
k this deck
54
Information was collected from employee records to determine whether there is an association
Between an employee's age and the number or workdays they miss. Partial excel results are
Summarized below from two different samples:
Given this information alone, would you decide to continue with the regression analysis for sample
#1 or #2 or both?
A) Continue with both samples, because the sample sizes are over 15.
B) Continue with sample #1 because the multiple r value is larger than that of sample #2.
C) Continue with sample #2 because the multiple r value is larger than that of sample #1.
D) Don't continue with either sample, because the standard error values are more than 2.
E) Don't continue with either sample, because the sample sizes are too small to be of use.
Unlock Deck
Unlock for access to all 173 flashcards in this deck.
Unlock Deck
k this deck
55
The slope of the regression line:
A) represents the average change in Y' for each change of one unit in the independent variable, X.
B) represents the average change in X for each change of one unit in the dependent variable, Y.
C) represents the change in Y' for each change of one unit in the independent variable, X.
A) represents the average change in Y' for each change of one unit in the independent variable, X.
B) represents the average change in X for each change of one unit in the dependent variable, Y.
C) represents the change in Y' for each change of one unit in the independent variable, X.
Unlock Deck
Unlock for access to all 173 flashcards in this deck.
Unlock Deck
k this deck
56
The partial MegaStat output below is regression analysis of the relationship between annual payroll
And number of wins in a season for 28 teams in professional sports. The purpose of the analysis is
To predict the number of wins when given an annual payroll in $millions. Although technically not a
Sample, the baseball data below will be treated as a convenience sample of all major league
Professional sports.
Refer to the printout above. Predict the number of wins for a team with PAYROLL = 25(million)
(nearest whole number)
A) 10
B) 69
C) 79
D) 74
E) 64 Multiple Choice Difficulty: Medium Learning
Unlock Deck
Unlock for access to all 173 flashcards in this deck.
Unlock Deck
k this deck
57
We have collected price per share and dividend information from a sample of 30 companies. The slope in this instance indicates:
A) for each additional dollar in stock price, we can anticipate an additional $2.73 in dividend.
B) for each additional dollar in stock price, we can anticipate an additional $3.68 in dividend.
C) for each additional dollar in stock price, we can anticipate an additional $0.27 in dividend.
D) for each additional dollar in dividend, we can anticipate an additional $2.71 in stock price.
E) for each additional dollar in dividend, we can anticipate a drop of $3.68 in stock price.
The slope in this instance indicates:A) for each additional dollar in stock price, we can anticipate an additional $2.73 in dividend.
B) for each additional dollar in stock price, we can anticipate an additional $3.68 in dividend.
C) for each additional dollar in stock price, we can anticipate an additional $0.27 in dividend.
D) for each additional dollar in dividend, we can anticipate an additional $2.71 in stock price.
E) for each additional dollar in dividend, we can anticipate a drop of $3.68 in stock price.
Unlock Deck
Unlock for access to all 173 flashcards in this deck.
Unlock Deck
k this deck
58
Data is collected from 20 sales people in order to verify that the more contacts made with potential
Clients, the greater the sales volume. The Excel printout is shown below.
The slope in this instance indicates:
A) for each additional contact made, the salesperson can anticipate an additional $1983 in sales.
B) for each additional contact made, the salesperson can anticipate an additional $1.98 in sales.
C) for each additional contact made, the salesperson can anticipate an additional $7,554 in sales.
D) for each additional contact made, the salesperson can anticipate a drop of $7,554 in sales.
E) for each additional sale made, the salesperson can anticipate an additional 2 contacts are needed.
Unlock Deck
Unlock for access to all 173 flashcards in this deck.
Unlock Deck
k this deck
59
i. The purpose of correlation analysis is to find how strong the relationship is between two variables.
ii. A coefficient of correlation of -0.96 indicates a very weak negative correlation.
iii. The standard error of estimate measures the accuracy of our prediction.
A) (i), (ii), and (iii) are all correct statements.
B) (i) and (ii) are correct statements but not (iii).
C) (i) and (iii) are correct statements but not (ii).
D) (ii) and (iii) are correct statements but not (i).
E) (i), (ii), and (iii) are all false statements.
Unlock Deck
Unlock for access to all 173 flashcards in this deck.
Unlock Deck
k this deck
60
A sales manager for an advertising agency believes there is a relationship between the number of
Contacts and the amount of the sales. To verify this belief, the following data was collected:
What is the regression equation?
A) Y' = 2.1946 - 12.201X
B) Y' = -12.201 + 2.1946X
C) Y' = 12.201 + 2.1946X
D) Y' = 2.1946 + 12.201X Multiple Choice Difficulty: Medium Learning
Contacts and the amount of the sales. To verify this belief, the following data was collected:
What is the regression equation?
A) Y' = 2.1946 - 12.201X
B) Y' = -12.201 + 2.1946X
C) Y' = 12.201 + 2.1946X
D) Y' = 2.1946 + 12.201X Multiple Choice Difficulty: Medium Learning
Unlock Deck
Unlock for access to all 173 flashcards in this deck.
Unlock Deck
k this deck
61
What is the difference between a confidence interval and a prediction interval for the dependent
Variable in correlation analysis?
A) A prediction interval reports the mean value of Y for a given X, whereas a confidence interval reports the range of values of Y for a particular value of X.
B) A confidence interval reports the mean value of Y for a given X, whereas a prediction interval reports the range of values of Y for a particular value of X.
C) A confidence interval reports the value of Y for a given X, whereas a prediction interval reports the value of Y for a particular value of X.
Unlock Deck
Unlock for access to all 173 flashcards in this deck.
Unlock Deck
k this deck
62
i. A coefficient of correlation r close to 0 (say, 0.08) shows that the relationship between two
Variables is quite weak.
ii. Coefficients of -0.91 and +0.91 have equal strength.
iii. If the coefficient of correlation is 0.68, the coefficient of determination is 0.4624.
A) (i), (ii), and (iii) are all correct statements.
B) (i) and (ii) are correct statements but not (iii).
C) (i) and (iii) are correct statements but not (ii).
D) (ii) and (iii) are correct statements but not (i).
E) (i), (ii), and (iii) are all false statements.
Unlock Deck
Unlock for access to all 173 flashcards in this deck.
Unlock Deck
k this deck
63
i. The purpose of correlation analysis is to find how strong the relationship is between two variables.
ii. A correlation coefficient of -1 or +1 indicates perfect correlation.
iii. The standard error of estimate measures the accuracy of our prediction.
A) (i), (ii), and (iii) are all correct statements.
B) (i) and (ii) are correct statements but not (iii).
C) (i) and (iii) are correct statements but not (ii).
D) (ii) and (iii) are correct statements but not (i).
E) (i), (ii), and (iii) are all false statements.
Unlock Deck
Unlock for access to all 173 flashcards in this deck.
Unlock Deck
k this deck
64
i. The coefficient of correlation is a measure of the strength of relationship between two variables.
ii. The coefficient of determination can only be positive.
iii. The standard error of estimate measures the accuracy of our prediction.
A) (i), (ii), and (iii) are all correct statements.
B) (i) and (ii) are correct statements but not (iii).
C) (i) and (iii) are correct statements but not (ii).
D) (ii) and (iii) are correct statements but not (i).
E) (i), (ii), and (iii) are all false statements.
Unlock Deck
Unlock for access to all 173 flashcards in this deck.
Unlock Deck
k this deck
65
What is the range of values for a coefficient of correlation?
A) 0 to +1.0
B) -3 to +3 inclusive
C) -1.0 to +1.0 inclusive
D) Unlimited range
A) 0 to +1.0
B) -3 to +3 inclusive
C) -1.0 to +1.0 inclusive
D) Unlimited range
Unlock Deck
Unlock for access to all 173 flashcards in this deck.
Unlock Deck
k this deck
66
Use the scatter diagrams to verify which statements are correct:
Chart A
Chart B
Chart C
A) The variables in Chart A have a strong positive correlation.
B) The variables in Chart C have a strong positive correlation.
C) The variables in Chart B have a negative correlation.
D) Charts A & B have no obvious outliers.
Chart A
Chart B
Chart C
A) The variables in Chart A have a strong positive correlation.
B) The variables in Chart C have a strong positive correlation.
C) The variables in Chart B have a negative correlation.
D) Charts A & B have no obvious outliers.
Unlock Deck
Unlock for access to all 173 flashcards in this deck.
Unlock Deck
k this deck
67
i. A correlation coefficient of -1 or +1 indicates perfect correlation.
ii. A coefficient of correlation r close to 0 (say, 0.08) shows that the relationship between two
Variables is quite weak.
iii. Coefficients of -0.91 and +0.91 have equal strength.
A) (i), (ii), and (iii) are all correct statements.
B) (i) and (ii) are correct statements but not (iii).
C) (i) and (iii) are correct statements but not (ii).
D) (ii) and (iii) are correct statements but not (i).
E) (i), (ii), and (iii) are all false statements.
Unlock Deck
Unlock for access to all 173 flashcards in this deck.
Unlock Deck
k this deck
68
i. Perfect correlation means that the scatter diagram will appear as a straight line
ii. If the coefficient of correlation is 0.80, the coefficient of determination is 0.64.
iii. The coefficient of determination can assume values between 0% and 100%
A) (i), (ii), and (iii) are all correct statements.
B) (i) and (ii) are correct statements but not (iii).
C) (i) and (iii) are correct statements but not (ii).
D) (ii) and (iii) are correct statements but not (i).
E) (i), (ii), and (iii) are all false statements.
Unlock Deck
Unlock for access to all 173 flashcards in this deck.
Unlock Deck
k this deck
69
What does a coefficient of correlation of 0.70 infer?
A) Almost no correlation because 0.70 is close to 1.0.
B) 70% of the variation in one variable is explained by the other.
C) Coefficient of determination is 0.49.
D) Coefficient of nondetermination is 0.30.
A) Almost no correlation because 0.70 is close to 1.0.
B) 70% of the variation in one variable is explained by the other.
C) Coefficient of determination is 0.49.
D) Coefficient of nondetermination is 0.30.
Unlock Deck
Unlock for access to all 173 flashcards in this deck.
Unlock Deck
k this deck
70
i. Correlation analysis is a group of statistical techniques used to measure the strength of the
Relationship (correlation) between two variables.
ii. A correlation coefficient of -1 or +1 indicates perfect correlation.
iii. The strength of the correlation between two variables depends on the sign of the coefficient of
Correlation.
A) (i), (ii), and (iii) are all correct statements.
B) (i) and (ii) are correct statements but not (iii).
C) (i) and (iii) are correct statements but not (ii).
D) (ii) and (iii) are correct statements but not (i).
E) (i), (ii), and (iii) are all false statements.
Unlock Deck
Unlock for access to all 173 flashcards in this deck.
Unlock Deck
k this deck
71
Which of the following statements regarding the coefficient of correlation is true?
A) It ranges from -1.0 to +1.0 inclusive.
B) It measures the strength of the relationship between two variables.
C) A value of 0.00 indicates two variables are not related.
D) It ranges from -1.0 to +1.0 inclusive; 0.00 indicates the two variables are not related. It measures the strength of the relationship between two variables.
Unlock Deck
Unlock for access to all 173 flashcards in this deck.
Unlock Deck
k this deck
72
i. The purpose of correlation analysis is to find how strong the relationship is between two variables.
ii. A coefficient of correlation r close to 0 (say, 0.08) shows that the relationship between two
Variables is quite weak.
iii. The strength of the correlation between two variables depends on the sign of the coefficient of
Correlation.
A) (i), (ii), and (iii) are all correct statements.
B) (i) and (ii) are correct statements but not (iii).
C) (i) and (iii) are correct statements but not (ii).
D) (ii) and (iii) are correct statements but not (i).
E) (i), (ii), and (iii) are all false statements.
Unlock Deck
Unlock for access to all 173 flashcards in this deck.
Unlock Deck
k this deck
73
The partial MegaStat output below is regression analysis of the relationship between annual payroll
And number of wins in a season for 28 teams in professional sports. The purpose of the analysis is
To predict the number of wins when given an annual payroll in $millions. Although technically not a
Sample, the baseball data below will be treated as a convenience sample of all major league
Professional sports.
Refer to the printout above. Predict the number of wins for a team with PAYROLL = 25(million)
(nearest whole number)
A) 10
B) 69
C) 79
D) 74
E) 64 Multiple Choice Difficulty: Hard Learning
Unlock Deck
Unlock for access to all 173 flashcards in this deck.
Unlock Deck
k this deck
74
i. A coefficient of correlation r close to 0 (say, 0.08) shows that the relationship between two
Variables is quite weak.
ii. A coefficient of correlation of -0.96 indicates a very weak negative correlation.
iii. If the coefficient of correlation is 0.68, the coefficient of determination is 0.4624.
A) (i), (ii), and (iii) are all correct statements.
B) (i) and (ii) are correct statements but not (iii).
C) (i) and (iii) are correct statements but not (ii).
D) (ii) and (iii) are correct statements but not (i).
E) (i), (ii), and (iii) are all false statements.
Unlock Deck
Unlock for access to all 173 flashcards in this deck.
Unlock Deck
k this deck
75
i. The coefficient of determination is the proportion of the total variation in the dependent variable Y
That is explained or accounted for by its relationship with the independent variable X.
ii. The coefficient of determination is found by taking the square root of the coefficient of
Correlation.
iii. The standard error of estimate measures the accuracy of our prediction.
A) (i), (ii), and (iii) are all correct statements.
B) (i) and (ii) are correct statements but not (iii).
C) (i) and (iii) are correct statements but not (ii).
D) (ii) and (iii) are correct statements but not (i).
E) (i), (ii), and (iii) are all false statements.
Unlock Deck
Unlock for access to all 173 flashcards in this deck.
Unlock Deck
k this deck
76
i. A correlation coefficient of -1 or +1 indicates perfect correlation.
ii. The strength of the correlation between two variables depends on the sign of the coefficient of
Correlation.
iii. If the coefficient of correlation is -0.90, the coefficient of determination is -0.81.
A) (i), (ii), and (iii) are all correct statements.
B) (i) and (ii) are correct statements but not (iii).
C) (i) is a correct statement but not (ii) or (iii).
D) (ii) and (iii) are correct statements but not (i).
E) (i), (ii), and (iii) are all false statements.
Unlock Deck
Unlock for access to all 173 flashcards in this deck.
Unlock Deck
k this deck
77
i. A coefficient of correlation r close to 0 (say, 0.08) shows that the relationship between two
Variables is quite weak.
ii. If the coefficient of correlation is 0.68, the coefficient of determination is 0.4624.
iii. The standard error of estimate measures the accuracy of our prediction.
A) (i), (ii), and (iii) are all correct statements.
B) (i) and (ii) are correct statements but not (iii).
C) (i) and (iii) are correct statements but not (ii).
D) (ii) and (iii) are correct statements but not (i).
E) (i), (ii), and (iii) are all false statements.
Unlock Deck
Unlock for access to all 173 flashcards in this deck.
Unlock Deck
k this deck
78
i. The strength of the correlation between two variables depends on the sign of the coefficient of
Correlation.
ii. A coefficient of correlation r close to 0 (say, 0.08) shows that the relationship between two
Variables is quite weak.
iii. The coefficient of determination is found by taking the square root of the coefficient of
Correlation.
A) (i), (ii), and (iii) are all correct statements.
B) (i) and (ii) are correct statements but not (iii).
C) (i) and (iii) are correct statements but not (ii).
D) (ii) is a correct statement but not (i) or (iii).
E) (i), (ii), and (iii) are all false statements.
Correlation.
ii. A coefficient of correlation r close to 0 (say, 0.08) shows that the relationship between two
Variables is quite weak.
iii. The coefficient of determination is found by taking the square root of the coefficient of
Correlation.
A) (i), (ii), and (iii) are all correct statements.
B) (i) and (ii) are correct statements but not (iii).
C) (i) and (iii) are correct statements but not (ii).
D) (ii) is a correct statement but not (i) or (iii).
E) (i), (ii), and (iii) are all false statements.
Unlock Deck
Unlock for access to all 173 flashcards in this deck.
Unlock Deck
k this deck
79
i. The coefficient of determination can only be positive.
ii. If the coefficient of correlation is 0.68, the coefficient of determination is 0.4624.
iii. The standard error of estimate measures the accuracy of our prediction.
A) (i), (ii), and (iii) are all correct statements.
B) (i) and (ii) are correct statements but not (iii).
C) (i) and (iii) are correct statements but not (ii).
D) (ii) and (iii) are correct statements but not (i).
E) (i), (ii), and (iii) are all false statements.
Unlock Deck
Unlock for access to all 173 flashcards in this deck.
Unlock Deck
k this deck
80
The partial MegaStat output below is regression analysis of the relationship between annual payroll
And number of wins in a season for 28 teams in professional sports. The purpose of the analysis is
To predict the number of wins when given an annual payroll in $millions. Although technically not a
Sample, the baseball data below will be treated as a convenience sample of all major league
Professional sports.
Refer to the printout above. How many independent variables?
A) 1
B) 2
C) 9
D) 10
E) 11
Unlock Deck
Unlock for access to all 173 flashcards in this deck.
Unlock Deck
k this deck
Unlock Deck
Unlock for access to all 173 flashcards in this deck.


