Exam 12: Analysis of Variance
Exam 1: What Is Statistics79 Questions
Exam 2: Describing Data: Frequencydistributions and Graphic Presentation100 Questions
Exam 3: Describing Data: Numerical Measures214 Questions
Exam 4: Describing Data: Displaying and Exploring Pata138 Questions
Exam 5: A Sulvey of Probability Concepts121 Questions
Exam 6: Discrete Probability Distributions145 Questions
Exam 7: Continuous Probabilitydistributions79 Questions
Exam 8: Sampling Methods and the Central Umit Theorem134 Questions
Exam 9: Estimation and Confidence Intervals140 Questions
Exam 10: One-Sample Tests of Hypothesis111 Questions
Exam 11: Two Sample Tests of Hypothesis103 Questions
Exam 12: Analysis of Variance173 Questions
Exam 13: Linear Regression and Correlation132 Questions
Exam 14: Multiple Regression and Correlation Analysis126 Questions
Exam 15: Chi-Square Applications94 Questions
Exam 16: Decision Making and Payoff Tables in Investment Scenarios151 Questions
Select questions type
If the decision in the hypothesis test of the population correlation coefficient is to reject the null
Hypothesis, what can we conclude about the correlation in the population?
Free
(Multiple Choice)
4.9/5  (35)
(35)
Correct Answer: Verified
C
The partial megastat output below is regression analysis of the relationship between annual payroll
And number of wins in a season for 28 teams in professional sports. The purpose of the analysis is
To predict the number of wins when given an annual payroll in $millions. Although technically not a
Sample, the baseball data below will be treated as a convenience sample of all major league
Professional sports. 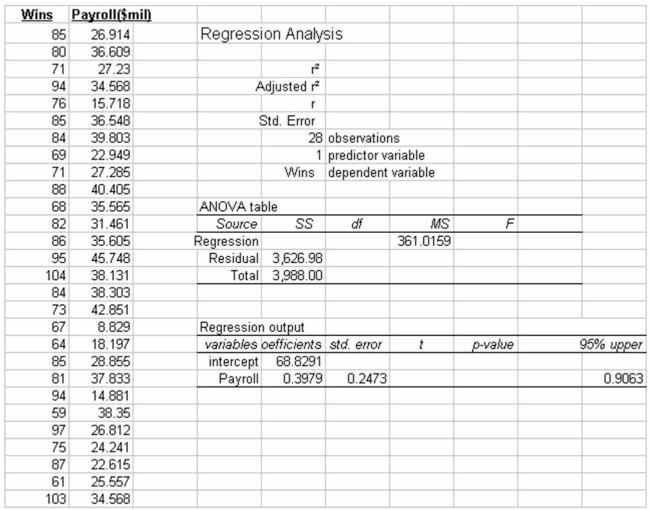 Refer to the printout above. The regression equation is:
Free
(Multiple Choice)
4.8/5 (41)
Correct Answer:Verified
B
Information was collected from employee records to determine whether there is an association
Between an employee's age and the number or workdays they miss. Excel results are summarized
Below: 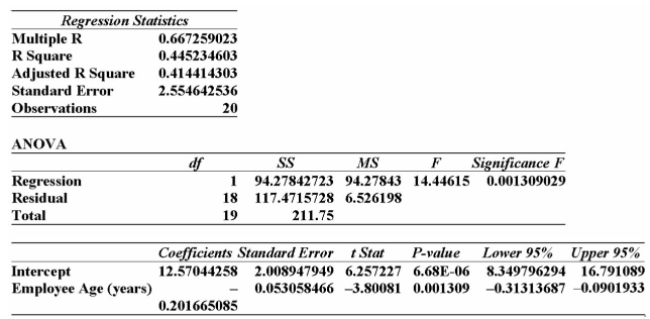 From this printout you determine:
Free
(Multiple Choice)
4.8/5 (38)
Correct Answer:Verified
D
i. The basic question in testing the significance of rho is to see if there is zero correlation in the
Population from which the sample was selected.
ii. An z test is used to test the significance of the coefficient of correlation.
iii. Perfect correlation means that the scatter diagram will appear as a straight line.
(Multiple Choice)
4.9/5 (39)
The partial MegaStat output below is regression analysis of the relationship between annual payroll
And number of wins in a season for 28 teams in professional sports. The purpose of the analysis is
To predict the number of wins when given an annual payroll in $millions. Although technically not a
Sample, the baseball data below will be treated as a convenience sample of all major league
Professional sports.
Refer to the printout above. Predict the number of wins for a team with a payroll of $36,000,000.
(Multiple Choice)
4.8/5 (36)
Information was collected from employee records to determine whether there is an association
Between an employee's age and the number or workdays they miss. Excel results are summarized
Below: 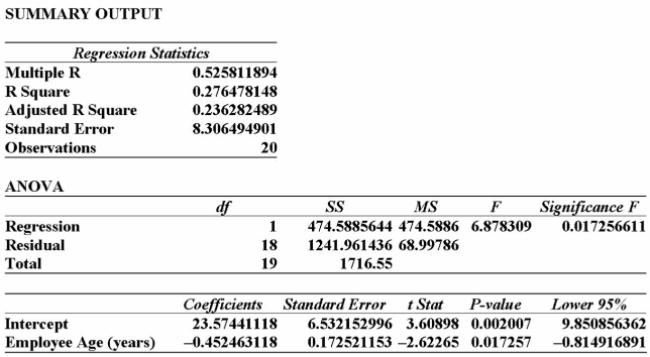 From this printout you determine:
(Multiple Choice)
4.9/5 (22)
Which of the following is true about the standard error of estimate?
(Multiple Choice)
4.9/5 (33)
When comparing the 95% confidence and prediction intervals for a given regression analysis,
(Multiple Choice)
4.9/5 (35)
i. In order to visualize the form of the regression equation, we can draw a scatter diagram.
ii. The least squares technique minimizes the sum of the squares of the vertical distances between
The actual Y values and the predicted values of Y.
iii. In regression analysis, the predicted value of Y' rarely agrees exactly with the actual Y value, i.e.,
We expect some prediction error.
(Multiple Choice)
4.8/5 (41)
i. A t test is used to test the significance of the coefficient of correlation.
ii. When testing the strength of the relationship between two variables, the alternate hypothesis is:
H0: ρ > 0.
iii. Perfect correlation means that the scatter diagram will appear as a straight line
(Multiple Choice)
4.8/5 (37)
i. The coefficient of correlation is a measure of the strength of relationship between two variables.
ii. The coefficient of determination can only be positive.
iii. The standard error of estimate measures the accuracy of our prediction.
(Multiple Choice)
4.8/5 (32)
Given the following five points: (-2,0), (-1,0), (0,1), (1,1), and (2,3).
What is the standard error of the estimate?
(Multiple Choice)
4.8/5 (41)
i. The technique used to measure the strength of the relationship between two sets of variables
Using the coefficient of correlation and the coefficient of determination is called regression analysis.
ii. In order to visualize the form of the regression equation, we can draw a scatter diagram.
iii. The equation for a straight line going through the plots on a scatter diagram is called a
Regression equation. It is alternately called an estimating equation and a predicting equation.
(Multiple Choice)
4.9/5 (42)
i. The technique used to measure the strength of the relationship between two sets of variables
Using the coefficient of correlation and the coefficient of determination is called regression analysis.
ii. In order to visualize the form of the regression equation, we can draw a scatter diagram.
iii. When a regression line has a zero slope, indicating a lack of a relationship, the line is horizontal
To the x-axis.
(Multiple Choice)
4.7/5 (36)
i. Perfect correlation means that the scatter diagram will appear as a straight line
ii. If the coefficient of correlation is 0.80, the coefficient of determination is 0.64.
iii. The coefficient of determination can assume values between 0% and 100%
(Multiple Choice)
4.8/5 (35)
The following table shows the number of workdays absent based on the length of employment in
Years. 
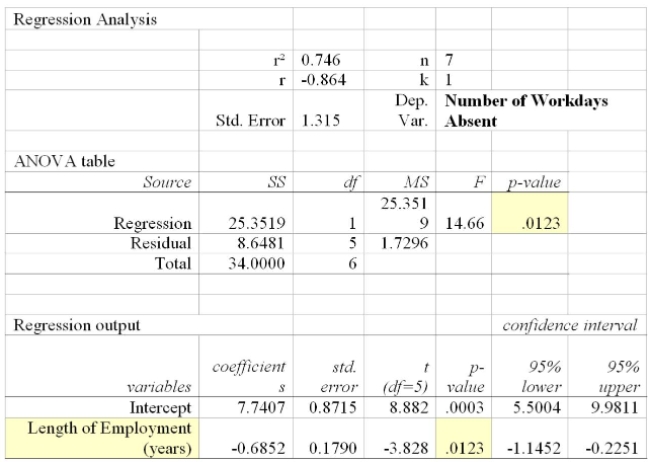 Determine the linear regression equation.
(Multiple Choice)
4.8/5 (28)
i. A correlation coefficient of -1 or +1 indicates perfect correlation.
ii. A coefficient of correlation r close to 0 (say, 0.08) shows that the relationship between two
Variables is quite weak.
iii. Coefficients of -0.91 and +0.91 have equal strength.
(Multiple Choice)
4.8/5 (33)
Information was collected from employee records to determine whether there is an association
Between an employee's age and the number or workdays they miss. Partial excel results are
Summarized below: 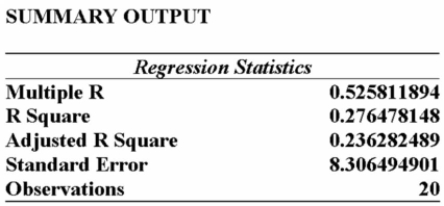 Given this information alone, would you decide to continue with the regression analysis?
(Multiple Choice)
5.0/5 (31)
A sales manager for an advertising agency believes there is a relationship between the number of
Contacts and the amount of the sales. To verify this believe, the following data was collected: 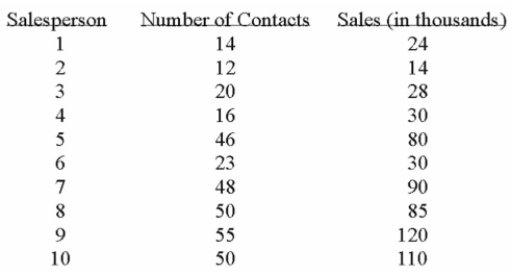
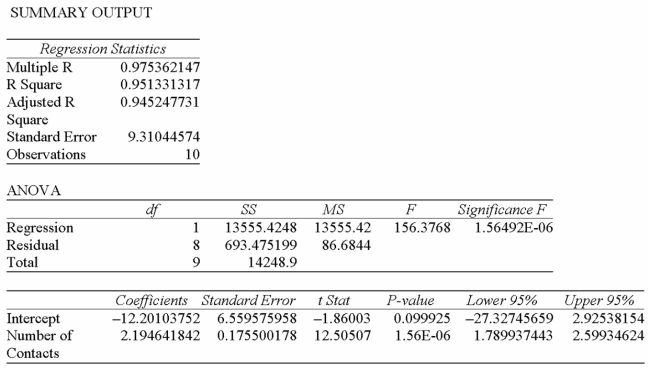 What is the independent variable?
(Multiple Choice)
4.8/5 (36)
Filters
- Essay(0)
- Multiple Choice(0)
- Short Answer(0)
- True False(0)
- Matching(0)