Deck 10: Inference From Small Samples
Full screen (f)
Question
In testing  vs.
vs.  the critical value is determined from the F-distribution table with an upper tail area equal to half the value of the level of significance.
vs. the critical value is determined from the F-distribution table with an upper tail area equal to half the value of the level of significance. Question
In testing  vs.
vs.  the null hypothesis will be rejected if the ratio
  is substantially longer than 1.0.
vs. the null hypothesis will be rejected if the ratio is substantially longer than 1.0. Question
In testing  vs.
vs.  the F-test statistic is calculated as F =
  .
.
vs. the F-test statistic is calculated as F = . Question
In testing  vs.
vs.  if
if  and
and  then the calculated value of the test statistic is F = 1.60.
vs. if and then the calculated value of the test statistic is F = 1.60. Question
Question
A two-tailed test for two population variances could have the null hypothesis to be written as  .
.
. Question
Question
The value of F that locates an area 0.01 in the upper tail of the F-distribution for  = 15 and
  = 10 is 3.80.
= 15 and = 10 is 3.80. Question
The F-distribution is used in testing  vs.
vs.  .
.
vs. . Question
Question
The test statistic employed to test  is
is  , which is F distributed with
 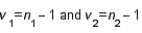 degrees of freedom, provided that the two populations are F distributed.
is , which is F distributed with degrees of freedom, provided that the two populations are F distributed. Question
Question
When comparing two population variances, we use the ratio  rather than the difference
  .
.
rather than the difference . Question
When the necessary conditions are met, a two-tail test is being conducted at  = 0.05 to test
  . The two sample variances are
 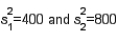 , and the sample sizes are
 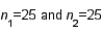 . The calculated value of the test statistic will be F = 2.
= 0.05 to test . The two sample variances are , and the sample sizes are . The calculated value of the test statistic will be F = 2. Question
When the necessary conditions are met, a two-tail test is being conducted at  = 0.05 to test
  . The two sample variances are
 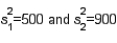 , and the sample sizes are
 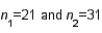 . The rejection region is F > 2.16 or F < 0.4347
= 0.05 to test . The two sample variances are , and the sample sizes are . The rejection region is F > 2.16 or F < 0.4347 Question
Question
The value of F with area 0.05 to its right for  = 6 and
  = 9 is 3.37.
= 6 and = 9 is 3.37. Question
In testing  vs.
vs.  the larger the sample sizes from the two populations, the smaller will be the chance of committing a Type I error.
vs. the larger the sample sizes from the two populations, the smaller will be the chance of committing a Type I error. Question
Question
Question
Question
If two random samples of 10 and 12 observations produced sample variances equal to 7.50 and 3.20, respectively, then the calculated value of the test statistic when testing  vs.
vs.  is equal to:
A) 7.50
B) 3.20
C) 10.70
D) 2.34
E) 7.82
vs. is equal to:A) 7.50
B) 3.20
C) 10.70
D) 2.34
E) 7.82
Question
In testing  vs.
vs.  , which of the following statements is true?
A) The larger sample variance must be used as the numerator of the F-test statistic.
B) The level of significance needs to be doubled before finding the critical value in the F-table.
C) The alternative hypothesis must contain the equality.
D) You are free to decide which of the two populations you want to call "Population 1."
E) The level of significance needs to be doubled before finding the critical value in the F-table and the alternative hypothesis must contain the equality.
vs. , which of the following statements is true?A) The larger sample variance must be used as the numerator of the F-test statistic.
B) The level of significance needs to be doubled before finding the critical value in the F-table.
C) The alternative hypothesis must contain the equality.
D) You are free to decide which of the two populations you want to call "Population 1."
E) The level of significance needs to be doubled before finding the critical value in the F-table and the alternative hypothesis must contain the equality.
Question
When testing for the difference between two population variances with sample sizes of  and
and  , the number of degrees of freedom is:
A) 8 and 10
B) 7 and 9
C) 2 and 18
D) 18 and 2
E) 9 and 11
and , the number of degrees of freedom is:A) 8 and 10
B) 7 and 9
C) 2 and 18
D) 18 and 2
E) 9 and 11
Question
When testing  vs.
vs.  two random samples of sizes 10 and 8, respectively, are used. The calculated value of the test statistic is found to be equal to 2.22. Which of the following statements is true?
A) H0 must be rejected at α = .05 .
B) H0 cannot be rejected at α = .05 .
C) There is sufficient evidence at α = .05 to conclude that a difference in the population variances exist.
D) H0 cannot be rejected at α = .10 .
E) None of these.
vs. two random samples of sizes 10 and 8, respectively, are used. The calculated value of the test statistic is found to be equal to 2.22. Which of the following statements is true?A) H0 must be rejected at α = .05 .
B) H0 cannot be rejected at α = .05 .
C) There is sufficient evidence at α = .05 to conclude that a difference in the population variances exist.
D) H0 cannot be rejected at α = .10 .
E) None of these.
Question
Question
The sampling distribution of the ratio of two sample variances  is said to be F distributed provided that:
A) the samples are independent
B) the populations are normal with equal variances
C) the samples are dependent and their sizes are large
D) the samples are independently drawn from two normal populations
E) none of these
is said to be F distributed provided that:A) the samples are independent
B) the populations are normal with equal variances
C) the samples are dependent and their sizes are large
D) the samples are independently drawn from two normal populations
E) none of these
Question
A stylist realizes that the quicker she can give a permanent, the happier the customer will be. She has made a slight adjustment to her traditional routine in hopes of reducing the time required. A random sample of 13 permanents from before and 16 after were timed. The results of the tests are listed below. Assume the two samples were taken from normal populations with equal variances. 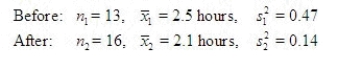 Do the sample variances present sufficient evidence to indicate that the population variance before is greater than the variance after? Test the appropriate hypotheses using a significance level of 0.05. Interpret your results.
Test Statistic = ______________
Reject Region: Reject H0 if F > ______________
Conclusion: ______________
There is ______________ to indicate that the population variance before is greater than the variance after.
Construct a 95% confidence interval (CI) for .
.
CI = ______________ Enter (n1, n2)
Find the approximate p-value for the test and interpret its value.
______________ Enter (n1, n2)
Do the sample variances present sufficient evidence to indicate that the population variance before is greater than the variance after? Test the appropriate hypotheses using a significance level of 0.05. Interpret your results.Test Statistic = ______________
Reject Region: Reject H0 if F > ______________
Conclusion: ______________
There is ______________ to indicate that the population variance before is greater than the variance after.
Construct a 95% confidence interval (CI) for
.CI = ______________ Enter (n1, n2)
Find the approximate p-value for the test and interpret its value.
______________ Enter (n1, n2)
Question
Which of the following distributions is used in testing  vs.
vs. 
A) Chi-square distribution
B) Normal distribution
C) F-distribution
D) t-distribution
E) Chi-square distribution and Normal distribution
vs. A) Chi-square distribution
B) Normal distribution
C) F-distribution
D) t-distribution
E) Chi-square distribution and Normal distribution
Question
Question
Question
Question
Two soft drink machines dispense liquids of 10 ounces, on the average. The question is whether the two machines are equally consistent (i.e., equally variable) in the dispensing of the liquid. To answer this question, a sample of size 10 was obtained from each machine and the sample standard deviations were computed to be  = 1.87 ounces and
  = 1.25 ounces. Perform the appropriate test for equality of variances using
  = 0.05.
Test Statistic = ______________
Reject Region: Reject H0 if F> ______________
Conclusion: ______________
One ______________ conclude that there is a significant difference in the variability of liquid dispensed between the two machines.
= 1.87 ounces and = 1.25 ounces. Perform the appropriate test for equality of variances using = 0.05.Test Statistic = ______________
Reject Region: Reject H0 if F> ______________
Conclusion: ______________
One ______________ conclude that there is a significant difference in the variability of liquid dispensed between the two machines.
Question
In constructing a 90% interval estimate for the ratio of two population variances,  , two independent samples of sizes 40 and 60 are drawn from the populations. If the sample variances are 515 and 920, then the lower confidence limit is:
A) 0.352
B) 0.341
C) 0.890
D) 0.918
E) 0.245
, two independent samples of sizes 40 and 60 are drawn from the populations. If the sample variances are 515 and 920, then the lower confidence limit is:A) 0.352
B) 0.341
C) 0.890
D) 0.918
E) 0.245
Question
Question
Question
The assumption(s) for  to have an F-distribution is (are):
A) random samples are drawn from each of two normal populations
B) the samples are independent
C) the variability of the measurements in the two populations is the same and can be measured by a common variance,
D) all of these are required assumptions
E) none of these
to have an F-distribution is (are):A) random samples are drawn from each of two normal populations
B) the samples are independent
C) the variability of the measurements in the two populations is the same and can be measured by a common variance,
D) all of these are required assumptions
E) none of these
Question
Question
Question
Question
The average total SAT scores (verbal plus math) were recorded for two groups of students: one group planning to major in engineering and one group planning to major in language/literature. 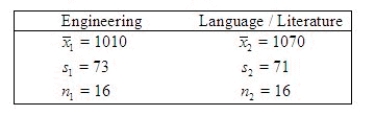 To use the two-sample t test with a pooled estimate of
  you must assume that the two population variances are equal. Test this assumption using the F test for equality of variances using
  = 0.05.
Test Statistic = ______________
Reject Region: Reject H0 if F > ______________
Conclusion: ______________
One ______________ conclude that the variances are different.
What is the approximate p-value for the test?
______________
To use the two-sample t test with a pooled estimate of you must assume that the two population variances are equal. Test this assumption using the F test for equality of variances using = 0.05.Test Statistic = ______________
Reject Region: Reject H0 if F > ______________
Conclusion: ______________
One ______________ conclude that the variances are different.
What is the approximate p-value for the test?
______________
Question
Question
Question
Question
Question
The test statistic used to test hypotheses about the population variance  is
is  , which is chi-squared distributed with n -1 degrees of freedom when the population is normally distributed with variance equal to
  .
.
is , which is chi-squared distributed with n -1 degrees of freedom when the population is normally distributed with variance equal to . Question
Question
Question
The area under a chi-squared curve with 10 degrees of freedom, which is captured between the critical values  is
is  .
.
is . Question
Independent random samples from two normal populations produced the variances listed here: 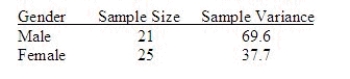 Do the data provide sufficient evidence to indicate that
  differs from
  ? Test using
  = .05.
Test Statistic = ______________
Reject Region: Reject H0 if F> ______________
Conclusion: ______________
One ______________ conclude that the variances are different.
Find the approximate p-value for the test and interpret its value.
______________ Enter (n1, n2)
Develop a 95% confidence interval for .
.
CI = ______________ Enter (n1, n2)
Do the data provide sufficient evidence to indicate that differs from ? Test using = .05.Test Statistic = ______________
Reject Region: Reject H0 if F> ______________
Conclusion: ______________
One ______________ conclude that the variances are different.
Find the approximate p-value for the test and interpret its value.
______________ Enter (n1, n2)
Develop a 95% confidence interval for
.CI = ______________ Enter (n1, n2)
Question
If you wish to test  vs.
vs.  at the .05 level of significance using a sample of 15 observations, the critical value to be used is 23.685.
vs. at the .05 level of significance using a sample of 15 observations, the critical value to be used is 23.685. Question
Question
A food processor wants to compare two preservatives for their effects on retarding spoilage. Suppose 16 cuts of fresh meat are treated with preservative A and 16 are treated with preservative B, and the number of hours until spoilage begins is recorded for each of the 32 cuts of meat. The results are summarized in the table below: 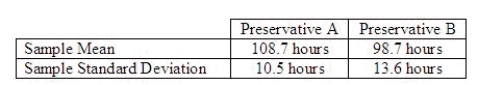 Calculate the value of the test statistic for testing the equality of the population variances, and write the proper conclusion for
  = 0.05.
Test statistic = ______________
Critical Value(s) = ______________
Conclusion: ______________
Interpretation: __________________________________________
Develop the 95% confidence interval estimate of the ratio of the two population variances.
______________
Calculate the value of the test statistic for testing the equality of the population variances, and write the proper conclusion for = 0.05.Test statistic = ______________
Critical Value(s) = ______________
Conclusion: ______________
Interpretation: __________________________________________
Develop the 95% confidence interval estimate of the ratio of the two population variances.
______________
Question
A statistician wants to test for the equality of means in two independent samples drawn from normal populations of people enrolled in a diet program. However, he will not perform the equal-variance t-test of the difference between the population means if the condition necessary for its use is not satisfied. The number of pound lost at the completion of the program data follow: 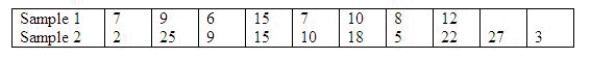 Can the statistician conclude at the 5% significance level that the required condition is not satisfied?
Test statistic = ______________
Critical Value(s) = ______________
Conclusion: ______________
Interpretation: __________________________________________
Estimate with 95% confidence the ratio of the two population variances.
______________
Can the statistician conclude at the 5% significance level that the required condition is not satisfied?Test statistic = ______________
Critical Value(s) = ______________
Conclusion: ______________
Interpretation: __________________________________________
Estimate with 95% confidence the ratio of the two population variances.
______________
Question
Question
Question
The chi-squared critical value  denotes the number on the measurement axis such that 10% of the area under the chi-squared curve with 6 degrees of freedom lies to the right of
  .
.
denotes the number on the measurement axis such that 10% of the area under the chi-squared curve with 6 degrees of freedom lies to the right of . Question
The printing time of a weekly magazine was studied using two different machines,  and
and  . Eight different magazines were randomly assigned to each of the two printing machines, and produced standard deviations
  = 2.08, and
  = 1.66 for machines
  and
and  , respectively. Assume the required assumptions are met and use
  = 0.05 to determine if the variances for the two machines are different.
Test Statistic = ______________
Reject Region: Reject H0 if F > ______________
Conclusion: ______________
There is ______________ to indicate a difference in the population variances.
and . Eight different magazines were randomly assigned to each of the two printing machines, and produced standard deviations = 2.08, and = 1.66 for machines and , respectively. Assume the required assumptions are met and use = 0.05 to determine if the variances for the two machines are different.Test Statistic = ______________
Reject Region: Reject H0 if F > ______________
Conclusion: ______________
There is ______________ to indicate a difference in the population variances.
Question
If you wish to test  vs.
vs.  at the .05 level of significance using a sample of 20 observations, the critical values to be used are
  32.852.
vs. at the .05 level of significance using a sample of 20 observations, the critical values to be used are 32.852. Question
Question
In testing  vs.
vs.  the following sample data were recorded: 5.0, 6.1, and 11.1. Then, the value of the test statistic is:
A) 10.570
B) 5.285
C) 7.400
D) 6.714
E) none of these
vs. the following sample data were recorded: 5.0, 6.1, and 11.1. Then, the value of the test statistic is:A) 10.570
B) 5.285
C) 7.400
D) 6.714
E) none of these
Question
Question
Question
Question
Question
If you are testing  vs.
vs.  using a sample of 15 observation and a significance level equal to .05, then the critical value of the test is:
A) 1.7613
B) 6.6450
C) 23.685
D) 4.867
E) 5.319
vs. using a sample of 15 observation and a significance level equal to .05, then the critical value of the test is:A) 1.7613
B) 6.6450
C) 23.685
D) 4.867
E) 5.319
Question
Question
In a hypothesis test for the population variance, the hypotheses are  vs.
vs.  . If the sample size is 15 and the test is being carried out at the 10% level of significance, the rejection region will be:
A) < 6.571 or> 23.685
B) < 7.790 or> 21.064
C) < 8.547 or> 22.307
D) < 7.261 or< 24.996
E) < 6.431 or> 21.653
vs. . If the sample size is 15 and the test is being carried out at the 10% level of significance, the rejection region will be:A) < 6.571 or> 23.685
B) < 7.790 or> 21.064
C) < 8.547 or> 22.307
D) < 7.261 or< 24.996
E) < 6.431 or> 21.653
Question
Question
Question
The statistic  is chi-squared distributed with n-1 degrees of freedom only if:
A) the population is normally distributed with variance equal to
B) the sample is normally distributed with variance equal to
C) the sample has a Student t distribution with degrees of freedom equal to n-1
D) all of these
E) none of these
is chi-squared distributed with n-1 degrees of freedom only if:A) the population is normally distributed with variance equal to
B) the sample is normally distributed with variance equal to
C) the sample has a Student t distribution with degrees of freedom equal to n-1
D) all of these
E) none of these
Question
A car salesperson tries to convince customers buying a new Honda Accord that the gas mileage varies by only  2 miles per gallon when driving in town and on the highway. The customer found, for 14 randomly chosen tanks of gas, the gas mileage to vary by
  2.8 miles per gallon. Do the customer's results contradict the salesperson's claim? Test the relevant hypotheses at the 0.05 level of significance. Assume the sample comes from a normal population.
Test Statistic = ______________
Reject Region: Reject H0 if > ______________
Conclusion: ______________
Interpretation: ________________________________________________________
2 miles per gallon when driving in town and on the highway. The customer found, for 14 randomly chosen tanks of gas, the gas mileage to vary by 2.8 miles per gallon. Do the customer's results contradict the salesperson's claim? Test the relevant hypotheses at the 0.05 level of significance. Assume the sample comes from a normal population.Test Statistic = ______________
Reject Region: Reject H0 if
> ______________Conclusion: ______________
Interpretation: ________________________________________________________
Question
A city bus driver claims that the route from the Canyon Crest Town Center to the University of California, Riverside never varies more than 1.3 minutes. A random sample of 18 trips yielded a variance of 1.26 minutes2. It is of interest to determine if the sample data present sufficient evidence to reject the driver's claim. Calculate the value of the test statistic. What is the appropriate conclusion at the 0.05 level of significance?
Test Statistic = ______________
Reject Region: Reject H0 if > ______________
Conclusion: ______________
One ______________ conclude that the route varies by more than 1.3 minutes.
Test Statistic = ______________
Reject Region: Reject H0 if
> ______________Conclusion: ______________
One ______________ conclude that the route varies by more than 1.3 minutes.
Question
Question
Question
Question
Question
Which of the following statements is true with regard to a hypothesis test for a population variance  ?
?
A) The null hypothesis is stated in terms of.
B) The chi-square distribution is used to determine the critical value.
C) The critical value increases as the sample size increases for a given level of significance.
D) All of these.
E) None of these.
?A) The null hypothesis is stated in terms of.
B) The chi-square distribution is used to determine the critical value.
C) The critical value increases as the sample size increases for a given level of significance.
D) All of these.
E) None of these.
Question
The sampling distribution of the quantity  is:
is:
A) an F distribution
B) a chi-square distribution
C) a normal distribution
D) a t-distribution
E) none of these
is:A) an F distribution
B) a chi-square distribution
C) a normal distribution
D) a t-distribution
E) none of these
Question
In testing  vs.
vs.  the following sample data were recorded: 11.5, 6.5, and 5.4. Then, the p-value of the test is:
A) between .05 and .10
B) between .10 and .20
C) less than .05
D) greater than .20
E) less than .10
vs. the following sample data were recorded: 11.5, 6.5, and 5.4. Then, the p-value of the test is:A) between .05 and .10
B) between .10 and .20
C) less than .05
D) greater than .20
E) less than .10

Unlock Deck
Sign up to unlock the cards in this deck!
Unlock Deck
Unlock Deck
1/261
Play
Full screen (f)
Deck 10: Inference From Small Samples
1
In testing vs. the critical value is determined from the F-distribution table with an upper tail area equal to half the value of the level of significance.
vs. the critical value is determined from the F-distribution table with an upper tail area equal to half the value of the level of significance.True
2
In testing vs. the null hypothesis will be rejected if the ratio is substantially longer than 1.0.
vs. the null hypothesis will be rejected if the ratio is substantially longer than 1.0.True
3
In testing vs. the F-test statistic is calculated as F = .
vs. the F-test statistic is calculated as F = .False
4
In testing vs. if and then the calculated value of the test statistic is F = 1.60.
vs. if and then the calculated value of the test statistic is F = 1.60. Unlock Deck
Unlock for access to all 261 flashcards in this deck.
Unlock Deck
k this deck
5
If two population variances have been tested and found to be equal, then it is reasonable to conclude that the two random samples selected from the two populations have equal variances.
Unlock Deck
Unlock for access to all 261 flashcards in this deck.
Unlock Deck
k this deck
6
A two-tailed test for two population variances could have the null hypothesis to be written as .
. Unlock Deck
Unlock for access to all 261 flashcards in this deck.
Unlock Deck
k this deck
7
In testing for the equality of two population variances, when the populations are normally distributed, the 5% level of significance has been used. To determine the rejection region, it will be necessary to refer to the F table corresponding to an upper-tail area of 0.05.
Unlock Deck
Unlock for access to all 261 flashcards in this deck.
Unlock Deck
k this deck
8
The value of F that locates an area 0.01 in the upper tail of the F-distribution for = 15 and = 10 is 3.80.
= 15 and = 10 is 3.80. Unlock Deck
Unlock for access to all 261 flashcards in this deck.
Unlock Deck
k this deck
9
The F-distribution is used in testing vs. .
vs. . Unlock Deck
Unlock for access to all 261 flashcards in this deck.
Unlock Deck
k this deck
10
We can use either the z-test or the t-test to determine whether two population variances are equal.
Unlock Deck
Unlock for access to all 261 flashcards in this deck.
Unlock Deck
k this deck
11
The test statistic employed to test is , which is F distributed with degrees of freedom, provided that the two populations are F distributed.
is , which is F distributed with degrees of freedom, provided that the two populations are F distributed. Unlock Deck
Unlock for access to all 261 flashcards in this deck.
Unlock Deck
k this deck
12
We can use either the z-test or the t-test to determine whether two population variances are equal.
Unlock Deck
Unlock for access to all 261 flashcards in this deck.
Unlock Deck
k this deck
13
When comparing two population variances, we use the ratio rather than the difference .
rather than the difference . Unlock Deck
Unlock for access to all 261 flashcards in this deck.
Unlock Deck
k this deck
14
When the necessary conditions are met, a two-tail test is being conducted at = 0.05 to test . The two sample variances are , and the sample sizes are . The calculated value of the test statistic will be F = 2.
= 0.05 to test . The two sample variances are , and the sample sizes are . The calculated value of the test statistic will be F = 2. Unlock Deck
Unlock for access to all 261 flashcards in this deck.
Unlock Deck
k this deck
15
When the necessary conditions are met, a two-tail test is being conducted at = 0.05 to test . The two sample variances are , and the sample sizes are . The rejection region is F > 2.16 or F < 0.4347
= 0.05 to test . The two sample variances are , and the sample sizes are . The rejection region is F > 2.16 or F < 0.4347 Unlock Deck
Unlock for access to all 261 flashcards in this deck.
Unlock Deck
k this deck
16
In testing the equality of two population variances, when the populations are normally distributed, the 5% level of significance has been used. To determine the rejection region, you will refer to the F table corresponding to an upper-tail area of 0.025.
Unlock Deck
Unlock for access to all 261 flashcards in this deck.
Unlock Deck
k this deck
17
The value of F with area 0.05 to its right for = 6 and = 9 is 3.37.
= 6 and = 9 is 3.37. Unlock Deck
Unlock for access to all 261 flashcards in this deck.
Unlock Deck
k this deck
18
In testing vs. the larger the sample sizes from the two populations, the smaller will be the chance of committing a Type I error.
vs. the larger the sample sizes from the two populations, the smaller will be the chance of committing a Type I error. Unlock Deck
Unlock for access to all 261 flashcards in this deck.
Unlock Deck
k this deck
19
In a one-tailed test of the equality of two population variances, the F-test statistic is calculated by placing the larger sample variance in the numerator.
Unlock Deck
Unlock for access to all 261 flashcards in this deck.
Unlock Deck
k this deck
20
The F-test used for testing the difference in two population variances is always a one-tailed test.
Unlock Deck
Unlock for access to all 261 flashcards in this deck.
Unlock Deck
k this deck
21
The test for the equality of two population variances assumes that each of the two populations is normally distributed.
Unlock Deck
Unlock for access to all 261 flashcards in this deck.
Unlock Deck
k this deck
22
If two random samples of 10 and 12 observations produced sample variances equal to 7.50 and 3.20, respectively, then the calculated value of the test statistic when testing vs. is equal to:
A) 7.50
B) 3.20
C) 10.70
D) 2.34
E) 7.82
vs. is equal to:A) 7.50
B) 3.20
C) 10.70
D) 2.34
E) 7.82
Unlock Deck
Unlock for access to all 261 flashcards in this deck.
Unlock Deck
k this deck
23
In testing vs. , which of the following statements is true?
A) The larger sample variance must be used as the numerator of the F-test statistic.
B) The level of significance needs to be doubled before finding the critical value in the F-table.
C) The alternative hypothesis must contain the equality.
D) You are free to decide which of the two populations you want to call "Population 1."
E) The level of significance needs to be doubled before finding the critical value in the F-table and the alternative hypothesis must contain the equality.
vs. , which of the following statements is true?A) The larger sample variance must be used as the numerator of the F-test statistic.
B) The level of significance needs to be doubled before finding the critical value in the F-table.
C) The alternative hypothesis must contain the equality.
D) You are free to decide which of the two populations you want to call "Population 1."
E) The level of significance needs to be doubled before finding the critical value in the F-table and the alternative hypothesis must contain the equality.
Unlock Deck
Unlock for access to all 261 flashcards in this deck.
Unlock Deck
k this deck
24
When testing for the difference between two population variances with sample sizes of and , the number of degrees of freedom is:
A) 8 and 10
B) 7 and 9
C) 2 and 18
D) 18 and 2
E) 9 and 11
and , the number of degrees of freedom is:A) 8 and 10
B) 7 and 9
C) 2 and 18
D) 18 and 2
E) 9 and 11
Unlock Deck
Unlock for access to all 261 flashcards in this deck.
Unlock Deck
k this deck
25
When testing vs. two random samples of sizes 10 and 8, respectively, are used. The calculated value of the test statistic is found to be equal to 2.22. Which of the following statements is true?
A) H0 must be rejected at α = .05 .
B) H0 cannot be rejected at α = .05 .
C) There is sufficient evidence at α = .05 to conclude that a difference in the population variances exist.
D) H0 cannot be rejected at α = .10 .
E) None of these.
vs. two random samples of sizes 10 and 8, respectively, are used. The calculated value of the test statistic is found to be equal to 2.22. Which of the following statements is true?A) H0 must be rejected at α = .05 .
B) H0 cannot be rejected at α = .05 .
C) There is sufficient evidence at α = .05 to conclude that a difference in the population variances exist.
D) H0 cannot be rejected at α = .10 .
E) None of these.
Unlock Deck
Unlock for access to all 261 flashcards in this deck.
Unlock Deck
k this deck
26
The F-distribution is symmetric.
Unlock Deck
Unlock for access to all 261 flashcards in this deck.
Unlock Deck
k this deck
27
The sampling distribution of the ratio of two sample variances is said to be F distributed provided that:
A) the samples are independent
B) the populations are normal with equal variances
C) the samples are dependent and their sizes are large
D) the samples are independently drawn from two normal populations
E) none of these
is said to be F distributed provided that:A) the samples are independent
B) the populations are normal with equal variances
C) the samples are dependent and their sizes are large
D) the samples are independently drawn from two normal populations
E) none of these
Unlock Deck
Unlock for access to all 261 flashcards in this deck.
Unlock Deck
k this deck
28
A stylist realizes that the quicker she can give a permanent, the happier the customer will be. She has made a slight adjustment to her traditional routine in hopes of reducing the time required. A random sample of 13 permanents from before and 16 after were timed. The results of the tests are listed below. Assume the two samples were taken from normal populations with equal variances. Do the sample variances present sufficient evidence to indicate that the population variance before is greater than the variance after? Test the appropriate hypotheses using a significance level of 0.05. Interpret your results.
Test Statistic = ______________
Reject Region: Reject H0 if F > ______________
Conclusion: ______________
There is ______________ to indicate that the population variance before is greater than the variance after.
Construct a 95% confidence interval (CI) for .
CI = ______________ Enter (n1, n2)
Find the approximate p-value for the test and interpret its value.
______________ Enter (n1, n2)
Do the sample variances present sufficient evidence to indicate that the population variance before is greater than the variance after? Test the appropriate hypotheses using a significance level of 0.05. Interpret your results.Test Statistic = ______________
Reject Region: Reject H0 if F > ______________
Conclusion: ______________
There is ______________ to indicate that the population variance before is greater than the variance after.
Construct a 95% confidence interval (CI) for
.CI = ______________ Enter (n1, n2)
Find the approximate p-value for the test and interpret its value.
______________ Enter (n1, n2)
Unlock Deck
Unlock for access to all 261 flashcards in this deck.
Unlock Deck
k this deck
29
Which of the following distributions is used in testing vs.
A) Chi-square distribution
B) Normal distribution
C) F-distribution
D) t-distribution
E) Chi-square distribution and Normal distribution
vs. A) Chi-square distribution
B) Normal distribution
C) F-distribution
D) t-distribution
E) Chi-square distribution and Normal distribution
Unlock Deck
Unlock for access to all 261 flashcards in this deck.
Unlock Deck
k this deck
30
The sampling distribution of the ratio of two independent sample variances selected randomly from normal populations with equal variances is:
A) a normal distribution
B) a t distribution
C) an F distribution
D) a binomial distribution
E) a chi-square distribution
A) a normal distribution
B) a t distribution
C) an F distribution
D) a binomial distribution
E) a chi-square distribution
Unlock Deck
Unlock for access to all 261 flashcards in this deck.
Unlock Deck
k this deck
31
Which of the following statements is false for an F-distribution?
A) Variables that are F distributed range from 0 to.
B) Exact shape of the distribution is determined by two numbers of degrees of freedom.
C) Degrees of freedom for the denominator are always smaller than the degrees of freedom for the numerator.
D) Degrees of freedom for the numerator can be larger, smaller, or equal to the degrees of freedom for the denominator.
E) Degrees of freedom for the denominator are always smaller than the degrees of freedom for the numerator and degrees of freedom for the numerator can be larger, smaller, or equal to the degrees of freedom for the denominator.
Unlock Deck
Unlock for access to all 261 flashcards in this deck.
Unlock Deck
k this deck
32
Which of the following is not a property of the F distribution?
A) F-distributions are nonsymmetrical.
B) F-distributions have (n - 1) degrees of freedom.
C) F can assume only positive values.
D) There are many F-distributions and each has a different shape.
E) F-distributions are nonsymmetrical and F can assume only positive values.
A) F-distributions are nonsymmetrical.
B) F-distributions have (n - 1) degrees of freedom.
C) F can assume only positive values.
D) There are many F-distributions and each has a different shape.
E) F-distributions are nonsymmetrical and F can assume only positive values.
Unlock Deck
Unlock for access to all 261 flashcards in this deck.
Unlock Deck
k this deck
33
Two soft drink machines dispense liquids of 10 ounces, on the average. The question is whether the two machines are equally consistent (i.e., equally variable) in the dispensing of the liquid. To answer this question, a sample of size 10 was obtained from each machine and the sample standard deviations were computed to be = 1.87 ounces and = 1.25 ounces. Perform the appropriate test for equality of variances using = 0.05.
Test Statistic = ______________
Reject Region: Reject H0 if F> ______________
Conclusion: ______________
One ______________ conclude that there is a significant difference in the variability of liquid dispensed between the two machines.
= 1.87 ounces and = 1.25 ounces. Perform the appropriate test for equality of variances using = 0.05.Test Statistic = ______________
Reject Region: Reject H0 if F> ______________
Conclusion: ______________
One ______________ conclude that there is a significant difference in the variability of liquid dispensed between the two machines.
Unlock Deck
Unlock for access to all 261 flashcards in this deck.
Unlock Deck
k this deck
34
In constructing a 90% interval estimate for the ratio of two population variances, , two independent samples of sizes 40 and 60 are drawn from the populations. If the sample variances are 515 and 920, then the lower confidence limit is:
A) 0.352
B) 0.341
C) 0.890
D) 0.918
E) 0.245
, two independent samples of sizes 40 and 60 are drawn from the populations. If the sample variances are 515 and 920, then the lower confidence limit is:A) 0.352
B) 0.341
C) 0.890
D) 0.918
E) 0.245
Unlock Deck
Unlock for access to all 261 flashcards in this deck.
Unlock Deck
k this deck
35
The test for the equality of two population variances is based on the:
A) difference between the two sample variances
B) ratio of the two sample variances
C) difference between the two population variances
D) difference between the two sample variances divided by the difference between the two population variances
E) difference between the two population variances divided by the two sample variances
Unlock Deck
Unlock for access to all 261 flashcards in this deck.
Unlock Deck
k this deck
36
The F-distribution is the sampling distribution of the ratio of:
A) two normal population variances
B) two normal population means
C) two sample variances provided that the samples are independently drawn from two normal populations with equal variances
D) two sample variances provided that the sample sizes are large
E) none of these
A) two normal population variances
B) two normal population means
C) two sample variances provided that the samples are independently drawn from two normal populations with equal variances
D) two sample variances provided that the sample sizes are large
E) none of these
Unlock Deck
Unlock for access to all 261 flashcards in this deck.
Unlock Deck
k this deck
37
The assumption(s) for to have an F-distribution is (are):
A) random samples are drawn from each of two normal populations
B) the samples are independent
C) the variability of the measurements in the two populations is the same and can be measured by a common variance,
D) all of these are required assumptions
E) none of these
to have an F-distribution is (are):A) random samples are drawn from each of two normal populations
B) the samples are independent
C) the variability of the measurements in the two populations is the same and can be measured by a common variance,
D) all of these are required assumptions
E) none of these
Unlock Deck
Unlock for access to all 261 flashcards in this deck.
Unlock Deck
k this deck
38
In testing for the equality of two population variances, when the populations are normally distributed, the 10% level of significance has been used. To determine the rejection region, it will be necessary to refer to the F table corresponding to an upper-tail area of:
A) 0.90
B) 0.05
C) 0.20
D) 0.10
E) 0.85
A) 0.90
B) 0.05
C) 0.20
D) 0.10
E) 0.85
Unlock Deck
Unlock for access to all 261 flashcards in this deck.
Unlock Deck
k this deck
39
The statistical distribution used for testing the difference between two population variances is the:
A) Student t-distribution
B) standard normal distribution
C) binomial distribution
D) F-distribution
E) chi-square distribution
A) Student t-distribution
B) standard normal distribution
C) binomial distribution
D) F-distribution
E) chi-square distribution
Unlock Deck
Unlock for access to all 261 flashcards in this deck.
Unlock Deck
k this deck
40
For an F-distribution, the number of degrees of freedom for the denominator:
A) must be larger than the number of degrees of freedom for the numerator
B) must be equal to the number of degrees of freedom for the numerator
C) must be smaller than the number of degrees of freedom for the numerator
D) can be larger, smaller, or equal to the number of degrees of freedom for the numerator
E) none of these
Unlock Deck
Unlock for access to all 261 flashcards in this deck.
Unlock Deck
k this deck
41
The average total SAT scores (verbal plus math) were recorded for two groups of students: one group planning to major in engineering and one group planning to major in language/literature. To use the two-sample t test with a pooled estimate of you must assume that the two population variances are equal. Test this assumption using the F test for equality of variances using = 0.05.
Test Statistic = ______________
Reject Region: Reject H0 if F > ______________
Conclusion: ______________
One ______________ conclude that the variances are different.
What is the approximate p-value for the test?
______________
To use the two-sample t test with a pooled estimate of you must assume that the two population variances are equal. Test this assumption using the F test for equality of variances using = 0.05.Test Statistic = ______________
Reject Region: Reject H0 if F > ______________
Conclusion: ______________
One ______________ conclude that the variances are different.
What is the approximate p-value for the test?
______________
Unlock Deck
Unlock for access to all 261 flashcards in this deck.
Unlock Deck
k this deck
42
An experimenter is concerned that variability of responses using two different experimental procedures may not be the same. He randomly selects two samples of 16 and 14 responses from two normal populations and gets the statistics: s12 = 55, and s12 = 118, respectively. Do the sample variances provide enough evidence at the 10% significance level to infer that the two population variances differ?
Test statistic = ______________
Critical Value(s) = ______________
Conclusion: ______________
Interpretation: __________________________________________
Estimate with 90% confidence the ratio of the two population variances.
______________
Test statistic = ______________
Critical Value(s) = ______________
Conclusion: ______________
Interpretation: __________________________________________
Estimate with 90% confidence the ratio of the two population variances.
______________
Unlock Deck
Unlock for access to all 261 flashcards in this deck.
Unlock Deck
k this deck
43
The 90th percentile of a chi-squared distribution with 15 degrees of freedom is equal to 22.3072.
Unlock Deck
Unlock for access to all 261 flashcards in this deck.
Unlock Deck
k this deck
44
The chi-squared distribution is:
A) symmetric around zero
B) positively skewed
C) negatively skewed
D) mound-shaped
E) positively skewed and mound-shaped
A) symmetric around zero
B) positively skewed
C) negatively skewed
D) mound-shaped
E) positively skewed and mound-shaped
Unlock Deck
Unlock for access to all 261 flashcards in this deck.
Unlock Deck
k this deck
45
The chi-square distribution is skewed to the left (negatively skewed), but as degrees of freedom increase, it approaches the shape of the binomial distribution.
Unlock Deck
Unlock for access to all 261 flashcards in this deck.
Unlock Deck
k this deck
46
The test statistic used to test hypotheses about the population variance is , which is chi-squared distributed with n -1 degrees of freedom when the population is normally distributed with variance equal to .
is , which is chi-squared distributed with n -1 degrees of freedom when the population is normally distributed with variance equal to . Unlock Deck
Unlock for access to all 261 flashcards in this deck.
Unlock Deck
k this deck
47
The t-distribution with n - 1 degrees of freedom is used when testing a null hypothesis for a population variance.
Unlock Deck
Unlock for access to all 261 flashcards in this deck.
Unlock Deck
k this deck
48
For a given level of significance, increasing the sample size will tend to increase the chi-square critical value used in testing the null hypothesis about a population variance.
Unlock Deck
Unlock for access to all 261 flashcards in this deck.
Unlock Deck
k this deck
49
The area under a chi-squared curve with 10 degrees of freedom, which is captured between the critical values is .
is . Unlock Deck
Unlock for access to all 261 flashcards in this deck.
Unlock Deck
k this deck
50
Independent random samples from two normal populations produced the variances listed here: Do the data provide sufficient evidence to indicate that differs from ? Test using = .05.
Test Statistic = ______________
Reject Region: Reject H0 if F> ______________
Conclusion: ______________
One ______________ conclude that the variances are different.
Find the approximate p-value for the test and interpret its value.
______________ Enter (n1, n2)
Develop a 95% confidence interval for .
CI = ______________ Enter (n1, n2)
Do the data provide sufficient evidence to indicate that differs from ? Test using = .05.Test Statistic = ______________
Reject Region: Reject H0 if F> ______________
Conclusion: ______________
One ______________ conclude that the variances are different.
Find the approximate p-value for the test and interpret its value.
______________ Enter (n1, n2)
Develop a 95% confidence interval for
.CI = ______________ Enter (n1, n2)
Unlock Deck
Unlock for access to all 261 flashcards in this deck.
Unlock Deck
k this deck
51
If you wish to test vs. at the .05 level of significance using a sample of 15 observations, the critical value to be used is 23.685.
vs. at the .05 level of significance using a sample of 15 observations, the critical value to be used is 23.685. Unlock Deck
Unlock for access to all 261 flashcards in this deck.
Unlock Deck
k this deck
52
The area to the right of a chi-squared variable is 0.025. For 5 degrees of freedom, the critical value is 11.143.
Unlock Deck
Unlock for access to all 261 flashcards in this deck.
Unlock Deck
k this deck
53
A food processor wants to compare two preservatives for their effects on retarding spoilage. Suppose 16 cuts of fresh meat are treated with preservative A and 16 are treated with preservative B, and the number of hours until spoilage begins is recorded for each of the 32 cuts of meat. The results are summarized in the table below: Calculate the value of the test statistic for testing the equality of the population variances, and write the proper conclusion for = 0.05.
Test statistic = ______________
Critical Value(s) = ______________
Conclusion: ______________
Interpretation: __________________________________________
Develop the 95% confidence interval estimate of the ratio of the two population variances.
______________
Calculate the value of the test statistic for testing the equality of the population variances, and write the proper conclusion for = 0.05.Test statistic = ______________
Critical Value(s) = ______________
Conclusion: ______________
Interpretation: __________________________________________
Develop the 95% confidence interval estimate of the ratio of the two population variances.
______________
Unlock Deck
Unlock for access to all 261 flashcards in this deck.
Unlock Deck
k this deck
54
A statistician wants to test for the equality of means in two independent samples drawn from normal populations of people enrolled in a diet program. However, he will not perform the equal-variance t-test of the difference between the population means if the condition necessary for its use is not satisfied. The number of pound lost at the completion of the program data follow: Can the statistician conclude at the 5% significance level that the required condition is not satisfied?
Test statistic = ______________
Critical Value(s) = ______________
Conclusion: ______________
Interpretation: __________________________________________
Estimate with 95% confidence the ratio of the two population variances.
______________
Can the statistician conclude at the 5% significance level that the required condition is not satisfied?Test statistic = ______________
Critical Value(s) = ______________
Conclusion: ______________
Interpretation: __________________________________________
Estimate with 95% confidence the ratio of the two population variances.
______________
Unlock Deck
Unlock for access to all 261 flashcards in this deck.
Unlock Deck
k this deck
55
A right-tailed area in the chi-squared distribution equals 0.05. For 8 degrees of freedom the critical value equals 13.362.
Unlock Deck
Unlock for access to all 261 flashcards in this deck.
Unlock Deck
k this deck
56
The 5th percentile of a chi-squared distribution with 10 degrees of freedom is equal to 4.3903.
Unlock Deck
Unlock for access to all 261 flashcards in this deck.
Unlock Deck
k this deck
57
The chi-squared critical value denotes the number on the measurement axis such that 10% of the area under the chi-squared curve with 6 degrees of freedom lies to the right of .
denotes the number on the measurement axis such that 10% of the area under the chi-squared curve with 6 degrees of freedom lies to the right of . Unlock Deck
Unlock for access to all 261 flashcards in this deck.
Unlock Deck
k this deck
58
The printing time of a weekly magazine was studied using two different machines, and . Eight different magazines were randomly assigned to each of the two printing machines, and produced standard deviations = 2.08, and = 1.66 for machines and , respectively. Assume the required assumptions are met and use = 0.05 to determine if the variances for the two machines are different.
Test Statistic = ______________
Reject Region: Reject H0 if F > ______________
Conclusion: ______________
There is ______________ to indicate a difference in the population variances.
and . Eight different magazines were randomly assigned to each of the two printing machines, and produced standard deviations = 2.08, and = 1.66 for machines and , respectively. Assume the required assumptions are met and use = 0.05 to determine if the variances for the two machines are different.Test Statistic = ______________
Reject Region: Reject H0 if F > ______________
Conclusion: ______________
There is ______________ to indicate a difference in the population variances.
Unlock Deck
Unlock for access to all 261 flashcards in this deck.
Unlock Deck
k this deck
59
If you wish to test vs. at the .05 level of significance using a sample of 20 observations, the critical values to be used are 32.852.
vs. at the .05 level of significance using a sample of 20 observations, the critical values to be used are 32.852. Unlock Deck
Unlock for access to all 261 flashcards in this deck.
Unlock Deck
k this deck
60
The chi-square distribution can be used in constructing confidence intervals and carrying out hypothesis tests regarding the value of a population variance.
Unlock Deck
Unlock for access to all 261 flashcards in this deck.
Unlock Deck
k this deck
61
In testing vs. the following sample data were recorded: 5.0, 6.1, and 11.1. Then, the value of the test statistic is:
A) 10.570
B) 5.285
C) 7.400
D) 6.714
E) none of these
vs. the following sample data were recorded: 5.0, 6.1, and 11.1. Then, the value of the test statistic is:A) 10.570
B) 5.285
C) 7.400
D) 6.714
E) none of these
Unlock Deck
Unlock for access to all 261 flashcards in this deck.
Unlock Deck
k this deck
62
If a hypothesis test is to be conducted regarding a population variance, then the critical value of the test will be obtained using the:
A) normal distribution
B) t-distribution with n - 1 degrees of freedom
C) chi-square distribution with n - 1 degrees of freedom
D) binomial distribution
E) t-distribution with n + 1 degrees of freedom
A) normal distribution
B) t-distribution with n - 1 degrees of freedom
C) chi-square distribution with n - 1 degrees of freedom
D) binomial distribution
E) t-distribution with n + 1 degrees of freedom
Unlock Deck
Unlock for access to all 261 flashcards in this deck.
Unlock Deck
k this deck
63
A pasta company would like to know the variability in the shelf life of their product. A random sample of 20 packages of pasta yielded a standard deviation of 5 days. Estimate the population variance using a 90% confidence interval. Assume the distribution is normal.
______________ Enter (n1, n2)
______________ Enter (n1, n2)
Unlock Deck
Unlock for access to all 261 flashcards in this deck.
Unlock Deck
k this deck
64
A random sample of 20 observations is selected from a normally distributed population. The sample variance is 12. In the 95% confidence interval for the population variance, the upper limit will be:
A) 6.940
B) 7.564
C) 22.536
D) 25.599
E) 27.392
A) 6.940
B) 7.564
C) 22.536
D) 25.599
E) 27.392
Unlock Deck
Unlock for access to all 261 flashcards in this deck.
Unlock Deck
k this deck
65
A random sample of size 20 taken from a normally distributed population resulted in a sample variance of 32. The lower limit of a 90% confidence interval for the population variance would be:
A) 52.185
B) 20.375
C) 20.170
D) 54.931
E) 29.655
A) 52.185
B) 20.375
C) 20.170
D) 54.931
E) 29.655
Unlock Deck
Unlock for access to all 261 flashcards in this deck.
Unlock Deck
k this deck
66
If you are testing vs. using a sample of 15 observation and a significance level equal to .05, then the critical value of the test is:
A) 1.7613
B) 6.6450
C) 23.685
D) 4.867
E) 5.319
vs. using a sample of 15 observation and a significance level equal to .05, then the critical value of the test is:A) 1.7613
B) 6.6450
C) 23.685
D) 4.867
E) 5.319
Unlock Deck
Unlock for access to all 261 flashcards in this deck.
Unlock Deck
k this deck
67
A random sample of 25 observations is selected from a normally distributed population. The sample variance is 10. In the 95% confidence interval for the population variance, the upper limit will be:
A) 17.110
B) 6.097
C) 17.331
D) 19.353
E) 11.842
A) 17.110
B) 6.097
C) 17.331
D) 19.353
E) 11.842
Unlock Deck
Unlock for access to all 261 flashcards in this deck.
Unlock Deck
k this deck
68
In a hypothesis test for the population variance, the hypotheses are vs. . If the sample size is 15 and the test is being carried out at the 10% level of significance, the rejection region will be:
A) < 6.571 or> 23.685
B) < 7.790 or> 21.064
C) < 8.547 or> 22.307
D) < 7.261 or< 24.996
E) < 6.431 or> 21.653
vs. . If the sample size is 15 and the test is being carried out at the 10% level of significance, the rejection region will be:A) < 6.571 or> 23.685
B) < 7.790 or> 21.064
C) < 8.547 or> 22.307
D) < 7.261 or< 24.996
E) < 6.431 or> 21.653
Unlock Deck
Unlock for access to all 261 flashcards in this deck.
Unlock Deck
k this deck
69
The sampling distribution used to make inferences about a single population variance is:
A) a normal distribution
B) a t distribution
C) an F distribution
D) a chi-square distribution
E) none of these
A) a normal distribution
B) a t distribution
C) an F distribution
D) a chi-square distribution
E) none of these
Unlock Deck
Unlock for access to all 261 flashcards in this deck.
Unlock Deck
k this deck
70
The variability in a scientist's measuring equipment was observed for a random sample of 26 test runs from a normal distribution. The sample yielded a variance of 33. Estimate the population variance using a 95% confidence interval.
______________ Enter (n1, n2)
______________ Enter (n1, n2)
Unlock Deck
Unlock for access to all 261 flashcards in this deck.
Unlock Deck
k this deck
71
The statistic is chi-squared distributed with n-1 degrees of freedom only if:
A) the population is normally distributed with variance equal to
B) the sample is normally distributed with variance equal to
C) the sample has a Student t distribution with degrees of freedom equal to n-1
D) all of these
E) none of these
is chi-squared distributed with n-1 degrees of freedom only if:A) the population is normally distributed with variance equal to
B) the sample is normally distributed with variance equal to
C) the sample has a Student t distribution with degrees of freedom equal to n-1
D) all of these
E) none of these
Unlock Deck
Unlock for access to all 261 flashcards in this deck.
Unlock Deck
k this deck
72
A car salesperson tries to convince customers buying a new Honda Accord that the gas mileage varies by only 2 miles per gallon when driving in town and on the highway. The customer found, for 14 randomly chosen tanks of gas, the gas mileage to vary by 2.8 miles per gallon. Do the customer's results contradict the salesperson's claim? Test the relevant hypotheses at the 0.05 level of significance. Assume the sample comes from a normal population.
Test Statistic = ______________
Reject Region: Reject H0 if > ______________
Conclusion: ______________
Interpretation: ________________________________________________________
2 miles per gallon when driving in town and on the highway. The customer found, for 14 randomly chosen tanks of gas, the gas mileage to vary by 2.8 miles per gallon. Do the customer's results contradict the salesperson's claim? Test the relevant hypotheses at the 0.05 level of significance. Assume the sample comes from a normal population.Test Statistic = ______________
Reject Region: Reject H0 if
> ______________Conclusion: ______________
Interpretation: ________________________________________________________
Unlock Deck
Unlock for access to all 261 flashcards in this deck.
Unlock Deck
k this deck
73
A city bus driver claims that the route from the Canyon Crest Town Center to the University of California, Riverside never varies more than 1.3 minutes. A random sample of 18 trips yielded a variance of 1.26 minutes2. It is of interest to determine if the sample data present sufficient evidence to reject the driver's claim. Calculate the value of the test statistic. What is the appropriate conclusion at the 0.05 level of significance?
Test Statistic = ______________
Reject Region: Reject H0 if > ______________
Conclusion: ______________
One ______________ conclude that the route varies by more than 1.3 minutes.
Test Statistic = ______________
Reject Region: Reject H0 if
> ______________Conclusion: ______________
One ______________ conclude that the route varies by more than 1.3 minutes.
Unlock Deck
Unlock for access to all 261 flashcards in this deck.
Unlock Deck
k this deck
74
A random sample of size 25 taken from a normally distributed population resulted in a sample standard deviation of a 0.93054. The lower and upper limits of a 99% confidence interval for the population variance would be:
A) 9.886 and 45.559
B) 3.144 and 6.750
C) 0.678 and 1.449
D) 0.456 and 2.102
E) 1.493 and 6.430
A) 9.886 and 45.559
B) 3.144 and 6.750
C) 0.678 and 1.449
D) 0.456 and 2.102
E) 1.493 and 6.430
Unlock Deck
Unlock for access to all 261 flashcards in this deck.
Unlock Deck
k this deck
75
The shape of the chi-squared distribution depends on:
A) the population variance
B) the number of its degrees of freedom
C) the population mean
D) all of these
E) none of these
A) the population variance
B) the number of its degrees of freedom
C) the population mean
D) all of these
E) none of these
Unlock Deck
Unlock for access to all 261 flashcards in this deck.
Unlock Deck
k this deck
76
The chi-squared distribution is:
A) symmetrical about 0
B) positively skewed ranging between 0 and
C) symmetrical around
D) negatively skewed ranging between -and 0
E) mound-shaped
A) symmetrical about 0
B) positively skewed ranging between 0 and
C) symmetrical around
D) negatively skewed ranging between -and 0
E) mound-shaped
Unlock Deck
Unlock for access to all 261 flashcards in this deck.
Unlock Deck
k this deck
77
Like that of the Student t-distribution, the shape of the chi-squared distribution depends on:
A) the population size
B) the number of its degrees of freedom
C) the population standard deviation
D) whether the population is unimodal or bimodal
E) none of these
A) the population size
B) the number of its degrees of freedom
C) the population standard deviation
D) whether the population is unimodal or bimodal
E) none of these
Unlock Deck
Unlock for access to all 261 flashcards in this deck.
Unlock Deck
k this deck
78
Which of the following statements is true with regard to a hypothesis test for a population variance ?
A) The null hypothesis is stated in terms of.
B) The chi-square distribution is used to determine the critical value.
C) The critical value increases as the sample size increases for a given level of significance.
D) All of these.
E) None of these.
?A) The null hypothesis is stated in terms of.
B) The chi-square distribution is used to determine the critical value.
C) The critical value increases as the sample size increases for a given level of significance.
D) All of these.
E) None of these.
Unlock Deck
Unlock for access to all 261 flashcards in this deck.
Unlock Deck
k this deck
79
The sampling distribution of the quantity is:
A) an F distribution
B) a chi-square distribution
C) a normal distribution
D) a t-distribution
E) none of these
is:A) an F distribution
B) a chi-square distribution
C) a normal distribution
D) a t-distribution
E) none of these
Unlock Deck
Unlock for access to all 261 flashcards in this deck.
Unlock Deck
k this deck
80
In testing vs. the following sample data were recorded: 11.5, 6.5, and 5.4. Then, the p-value of the test is:
A) between .05 and .10
B) between .10 and .20
C) less than .05
D) greater than .20
E) less than .10
vs. the following sample data were recorded: 11.5, 6.5, and 5.4. Then, the p-value of the test is:A) between .05 and .10
B) between .10 and .20
C) less than .05
D) greater than .20
E) less than .10
Unlock Deck
Unlock for access to all 261 flashcards in this deck.
Unlock Deck
k this deck
Unlock Deck
Unlock for access to all 261 flashcards in this deck.


