Exam 10: Inference From Small Samples
Exam 1: Describing Data With Graphs94 Questions
Exam 2: Describing Data With Numerical Measures186 Questions
Exam 3: Describing Bivariate Data35 Questions
Exam 4: Probability and Probability Distributions136 Questions
Exam 5: Several Useful Discrete Distributions129 Questions
Exam 6: The Normal Probability Distribution196 Questions
Exam 7: Sampling Distributions162 Questions
Exam 8: Large-Sample Estimation173 Questions
Exam 9: Large-Sample Tests of Hypotheses210 Questions
Exam 10: Inference From Small Samples261 Questions
Exam 11: The Analysis of Variance156 Questions
Exam 12: Linear Regression and Correlation165 Questions
Exam 13: Multiple Regression Analysis178 Questions
Exam 14: Analysis of Categorical Data136 Questions
Exam 15: Nonparametric Statistics198 Questions
Select questions type
A random sample of 15 hourly wages for waitresses (including tips) was drawn from a normal population. The sample mean and sample standard deviation were computed as  = $14.9 and s = $6.75. Can we infer at the 5% significance level that the population mean is greater than 12?
Test statistic = ______________
Critical Value(s) = ______________
Conclusion: ______________
Interpretation: ______________
Can we infer at the 5% significance level that the population mean is greater than 12, assuming that you know the population standard deviation is equal to 6.75?
Test statistic = ______________
Critical Value(s) = ______________
Conclusion: ______________
Interpretation: ______________
= $14.9 and s = $6.75. Can we infer at the 5% significance level that the population mean is greater than 12?
Test statistic = ______________
Critical Value(s) = ______________
Conclusion: ______________
Interpretation: ______________
Can we infer at the 5% significance level that the population mean is greater than 12, assuming that you know the population standard deviation is equal to 6.75?
Test statistic = ______________
Critical Value(s) = ______________
Conclusion: ______________
Interpretation: ______________
Free
(Short Answer)
4.8/5  (38)
(38)
Correct Answer: Verified
1.664; 1.761; Do not reject H0; No, we CANNOT make this inference; 1.664; 1.645; Reject H0; Yes, we can make this inference
In a paired-difference experiment, two samples of size n are being used. The number of degrees of freedom associated with the paired-difference test is n - 1.
Free
(True/False)
4.8/5 (32)
Correct Answer:Verified
True
A precision instrument is guaranteed to read accurately to within 2 units. A sample of four instrument readings on the same object yielded the measurements 360, 358, 358, and 362. Test the null hypothesis that  = 0.7 against the alternative
  > 0.7. Use
  = 0.05.
Test statistic = ______________
Critical Value(s) = ______________
Conclusion: ______________
Interpretation: ____________________________
Find a 90% confidence interval for the population variance.
______________
= 0.05.
Test statistic = ______________
Critical Value(s) = ______________
Conclusion: ______________
Interpretation: ____________________________
Find a 90% confidence interval for the population variance.
______________
Free
(Short Answer)
4.9/5 (38)
Correct Answer:Verified
22.449; 7.81; Reject H0; The variance is greater than 0.49; (1.408, 31.264)
In a study to compare average snowfall in two different cities, measurements were taken in each of the cities for 10 randomly selected years. Snowfall, in inches, for the two cities are listed below. 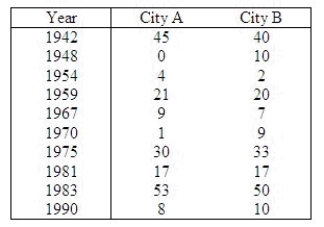 Assume the two population distributions are normal. Use the data to determine if there is a significant difference in average snowfall in the two cities. Use a significance level of
  = 0.05.
Use the Data Analysis software if you prefer.
Test Statistic = ______________
Reject Region: Reject H0 if |t| > ______________
Conclusion: ______________
The sample data support that ______________ in the snowfalls.
= 0.05.
Use the Data Analysis software if you prefer.
Test Statistic = ______________
Reject Region: Reject H0 if |t| > ______________
Conclusion: ______________
The sample data support that ______________ in the snowfalls.
(Short Answer)
4.8/5 (32)
A consumer was interested in determining whether there is a significant difference in the price charged for tools by two hardware stores. The consumer selected five tools and recorded the price for each tool in each store. The following data was recorded: 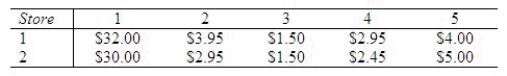 Are the samples independent? Justify your answer.
Perform the appropriate test of hypothesis to determine whether there is a significant difference, on the average, in the price of tools between the two stores. Use
Are the samples independent? Justify your answer.
Perform the appropriate test of hypothesis to determine whether there is a significant difference, on the average, in the price of tools between the two stores. Use  = 0.05.
Use the Data Analysis software if you prefer.
Test Statistic = __________________________________________
Reject Region: Reject H0 if |t| > ______________
Conclusion: ______________
One ______________ conclude that there is a significant difference in the average price of tools between the two stores.
= 0.05.
Use the Data Analysis software if you prefer.
Test Statistic = __________________________________________
Reject Region: Reject H0 if |t| > ______________
Conclusion: ______________
One ______________ conclude that there is a significant difference in the average price of tools between the two stores.
(Short Answer)
4.7/5 (31)
A random sample of size 20 taken from a normally distributed population resulted in a sample variance of 32. The lower limit of a 90% confidence interval for the population variance would be:
(Multiple Choice)
4.8/5 (31)
The t-distribution is used to construct confidence interval for the population mean  when the population is unknown and the sample size is small.
(True/False)
4.8/5 (29)
The mean playing times (in hours) for 5 different co-ed volleyball games for two different teams are listed below. 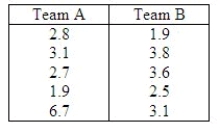 Is there sufficient evidence to conclude the mean playing time for the two teams differ? Assume the population distributions are normal and
  . Use a 0.05 significance level.
Test Statistic = ______________
Reject Region: Reject H0 if |t| > ______________
Conclusion: ______________
One ______________ conclude that there is sufficient evidence to claim the two teams have different playing times.
. Use a 0.05 significance level.
Test Statistic = ______________
Reject Region: Reject H0 if |t| > ______________
Conclusion: ______________
One ______________ conclude that there is sufficient evidence to claim the two teams have different playing times.
(Short Answer)
4.8/5 (38)
The test for the equality of two population variances is based on the:
(Multiple Choice)
4.8/5 (36)
In constructing a 90% interval estimate for the ratio of two population variances,  , two independent samples of sizes 40 and 60 are drawn from the populations. If the sample variances are 515 and 920, then the lower confidence limit is:
(Multiple Choice)
4.7/5 (37)
The average life of a certain type and brand of battery is 75 weeks. The average life of each of 9 randomly selected batteries is listed below.
74.5, 75.0, 72.3, 76.0, 75.2, 75.1, 75.3, 74.9, 74.8
a. Assume the battery life distribution is normal. It is of interest to know if the sample data suggest the average life is smaller than 75 weeks.
b. Compute the test statistic for the hypotheses in part (a).
Test statistic = ______________
c. Compute the approximate p-value associated with the test statistic in (b).
P-value = ______________
Conclusion: ______________
The sample data ______________ support the alternative hypothesis at the
 = 0.05 level.
(Short Answer)
4.8/5 (38)
A random sample of 20 observations is selected from a normally distributed population. The sample variance is 12. In the 95% confidence interval for the population variance, the upper limit will be:
(Multiple Choice)
4.8/5 (44)
A major department store chain is interested in estimating the average amount its credit card customers spent on their first visit to the chain's new store in the mall. Fifteen credit card accounts were randomly sampled and analyzed with the following results:  = $50.50 and
  = 400. Assuming the distribution of the amount spent on their first visit is approximately normal, what is the shape of the sampling distribution of the sample mean that will be used to create the desired confidence interval for
  ?
?
(Multiple Choice)
4.9/5 (43)
When we test for differences between the means of two independent populations, we can only use a two-tailed test.
(True/False)
4.8/5 (37)
Set up the rejection regions for the following testing conditions. Assume the assumptions of normality and equal variances are satisfied.  ; n1 = 10, n2 = 12, and
  = 0.05.
______________
= 0.05.
______________  ; n1 = 4, n2 = 8, and
  = 0.01.
______________
= 0.01.
______________  ; n1 = 15, n2 = 15, and
  = 0.05.
______________
= 0.05.
______________
(Short Answer)
4.8/5 (36)
Under which of the following circumstances is it impossible to construct a confidence interval for the population mean?
(Multiple Choice)
4.9/5 (26)
The matched pairs experiment always produce a larger test statistic than the independent samples experiment.
(True/False)
4.8/5 (29)
Which of the following is not true about the Student's t distribution?
(Multiple Choice)
4.8/5 (35)
Statisticians have shown that the mathematical process that derived the Student t distribution is robust, which means that if the sampled population is nonnormal, the t-test of the population mean  is still valid, provided that the population is not extremely nonnormal.
(True/False)
4.8/5 (29)
Researchers determined that 60 Kleenex tissues is the average number of tissues used during a cold. Suppose a random sample of 100 Kleenex users yielded the following data on the number of tissues used during a cold:  = 52 and s = 22. Suppose the alternative we wanted to test was
  . The correct rejection region for
  = 0.05 is
(Multiple Choice)
4.8/5 (31)
Filters
- Essay(0)
- Multiple Choice(0)
- Short Answer(0)
- True False(0)
- Matching(0)