Deck 5: Measures of Variability
Full screen (f)
Question
Question
Question
Question
Question
Question
Question
Question
Question
Question
Question
Question
Question
Question
Question
Question
Question
Question
Question
Question
Question
Question
The equation
 is used to calculate the
A) median.
B) hinge location.
C) outer fence.
D) inner fences.
is used to calculate theA) median.
B) hinge location.
C) outer fence.
D) inner fences.
Question
Question
Question
Question
Question
Question
Question
Question
Question
Question
Question
Question
Question
Question
Question
Question
Question
Question
Question
Question
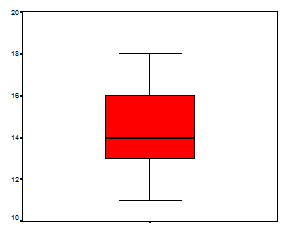
Answer the next two questions based on the following box-plot.

The median of this distribution is 16.
The median of this distribution is 16.
Question
Question
Question
Question
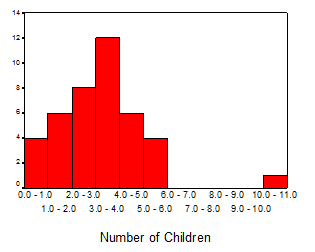
A sample of 20 families reported how many children they have. Answer the following questions based on the summary table below.

a) What is the range?
b. What is the variance?
c. What is the standard deviation?
a) What is the range?
b. What is the variance?
c. What is the standard deviation?
Question
Question
Question
Question
Answer the following questions based on this distribution of exam scores.
a. What is the median?
b. Are there outliers?
c. Does the distribution seem skewed? If so, is it positively, or negatively skewed?
a. What is the median?
b. Are there outliers?
c. Does the distribution seem skewed? If so, is it positively, or negatively skewed?
Question
Question
Question
Question
Question
Question
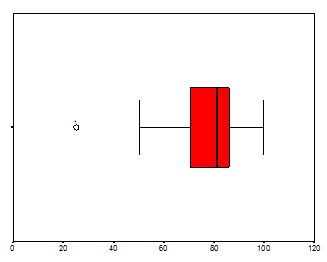
Answer the next two questions based on the following box-plot.
There no outliers.
There no outliers.
Question
Question
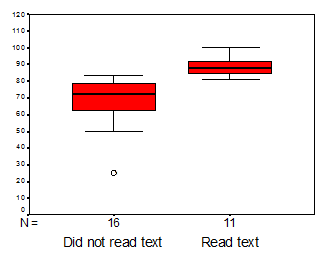
Compare the distribution of exam scores for students who did and did not read the textbook prior to taking the exam. Discuss measures of variability and of central tendency.
Question
Based on the same data, calculate:
a. The median location
b. The median
c. The hinge location
d. The upper hinge
e. The lower hinge
f. H spread
g. Lower fence
h. Upper fence
i. Lower adjacent value
j. Upper adjacent value
Question
Question
Given the following distribution, which would be the least useful measure of central tendency? Explain your answer.
Question

Unlock Deck
Sign up to unlock the cards in this deck!
Unlock Deck
Unlock Deck
1/62
Play
Full screen (f)
Deck 5: Measures of Variability
1
The vertical line in the center of a box plot
A) represents the sample mean.
B) represents the sample median.
C) serves to anchor the box.
D) can represent anything you want it to.
A) represents the sample mean.
B) represents the sample median.
C) serves to anchor the box.
D) can represent anything you want it to.
represents the sample median.
2
The difference between s and σ is that σ is
A) the value of the standard deviation in a sample.
B) the long range average of the variance over repeated sampling.
C) the biased estimate of s.
D) the value of the standard deviation in a population.
A) the value of the standard deviation in a sample.
B) the long range average of the variance over repeated sampling.
C) the biased estimate of s.
D) the value of the standard deviation in a population.
the value of the standard deviation in a population.
3
If the whiskers on a boxplot are much longer on the right than on the left, we would suspect that the distribution is
A) positively skewed.
B) negatively skewed.
C) symmetric.
D) distorted.
A) positively skewed.
B) negatively skewed.
C) symmetric.
D) distorted.
positively skewed.
4
People in the stock market refer to a measure called the "standard deviation," although it is calculated somewhat differently from the one discussed here. It is a good guess that this measure refers to
A) the riskiness of the stock.
B) the value of the stock.
C) how much the stock price is likely to fluctuate.
D) how much money you are likely to earn from buying that stock.
A) the riskiness of the stock.
B) the value of the stock.
C) how much the stock price is likely to fluctuate.
D) how much money you are likely to earn from buying that stock.
Unlock Deck
Unlock for access to all 62 flashcards in this deck.
Unlock Deck
k this deck
5
If we multiply a set of data by a constant, such as converting feet to inches, we will
A) leave the mean and variance unaffected.
B) multiply the mean and the standard deviation by the constant.
C) multiply the mean by the constant but leave the standard deviation unchanged.
D) leave the mean unchanged but alter the standard deviation.
A) leave the mean and variance unaffected.
B) multiply the mean and the standard deviation by the constant.
C) multiply the mean by the constant but leave the standard deviation unchanged.
D) leave the mean unchanged but alter the standard deviation.
Unlock Deck
Unlock for access to all 62 flashcards in this deck.
Unlock Deck
k this deck
6
What do we mean by an unbiased statistic?
A) a statistic that equals the sample mean
B) a statistic whose average is very stable from sample to sample
C) a statistic used to measure racial diversity
D) a statistic whose long range average is equal to the parameter it estimates
A) a statistic that equals the sample mean
B) a statistic whose average is very stable from sample to sample
C) a statistic used to measure racial diversity
D) a statistic whose long range average is equal to the parameter it estimates
Unlock Deck
Unlock for access to all 62 flashcards in this deck.
Unlock Deck
k this deck
7
When calculating the standard deviation we divide by N -1 rather than N because the result is
A) smaller.
B) less biased.
C) easier to interpret.
D) equal to the population mean.
A) smaller.
B) less biased.
C) easier to interpret.
D) equal to the population mean.
Unlock Deck
Unlock for access to all 62 flashcards in this deck.
Unlock Deck
k this deck
8
We generally like the standard deviation when we are trying to describe a sample of data because
A) it is larger than the variance.
B) it allows for more intuitive interpretation with respect to the data than does the variance.
C) it is less biased than the variance.
D) all of the above
A) it is larger than the variance.
B) it allows for more intuitive interpretation with respect to the data than does the variance.
C) it is less biased than the variance.
D) all of the above
Unlock Deck
Unlock for access to all 62 flashcards in this deck.
Unlock Deck
k this deck
9
The variance can best be thought of as the
A) average of the squared deviations from the mean.
B) average of the absolute deviations from the mean.
C) average of the deviations from the median.
D) square of the mean.
A) average of the squared deviations from the mean.
B) average of the absolute deviations from the mean.
C) average of the deviations from the median.
D) square of the mean.
Unlock Deck
Unlock for access to all 62 flashcards in this deck.
Unlock Deck
k this deck
10
A trimmed sample is one that
A) has been distorted by lopping off the highest scores.
B) is strongly influenced by outliers.
C) is unrepresentative of what it purports to measure.
D) has been truncated equally at the two extremes.
A) has been distorted by lopping off the highest scores.
B) is strongly influenced by outliers.
C) is unrepresentative of what it purports to measure.
D) has been truncated equally at the two extremes.
Unlock Deck
Unlock for access to all 62 flashcards in this deck.
Unlock Deck
k this deck
11
Data points that lie outside the whiskers in a boxplot are often referred to as
A) incorrect values.
B) outliers.
C) representative values.
D) deviates.
A) incorrect values.
B) outliers.
C) representative values.
D) deviates.
Unlock Deck
Unlock for access to all 62 flashcards in this deck.
Unlock Deck
k this deck
12
Which of the following is NOT a measure of variability?
A) the density
B) the range
C) the standard deviation
D) the interquartile range
A) the density
B) the range
C) the standard deviation
D) the interquartile range
Unlock Deck
Unlock for access to all 62 flashcards in this deck.
Unlock Deck
k this deck
13
Data points at the extremes of the distribution have
A) little effect on the variance.
B) more effect on the variance than scores at the center of the distribution.
C) are undoubtedly incorrect.
D) distort the usefulness of the median.
A) little effect on the variance.
B) more effect on the variance than scores at the center of the distribution.
C) are undoubtedly incorrect.
D) distort the usefulness of the median.
Unlock Deck
Unlock for access to all 62 flashcards in this deck.
Unlock Deck
k this deck
14
Dispersion refers to
A) the degree to which data cluster toward one end of the scale.
B) the centrality of the distribution.
C) the degree to which individual data points are distributed around the mean.
D) all of the above
A) the degree to which data cluster toward one end of the scale.
B) the centrality of the distribution.
C) the degree to which individual data points are distributed around the mean.
D) all of the above
Unlock Deck
Unlock for access to all 62 flashcards in this deck.
Unlock Deck
k this deck
15
Which of the following sets of data is likely to have the smallest standard deviation?
A) the distribution of SAT scores for students from your high school
B) the distribution of heights of students in an elementary school
C) the grade point averages of students from your high school's honors biology class
D) the amount that you and your friends pay for college tuition
A) the distribution of SAT scores for students from your high school
B) the distribution of heights of students in an elementary school
C) the grade point averages of students from your high school's honors biology class
D) the amount that you and your friends pay for college tuition
Unlock Deck
Unlock for access to all 62 flashcards in this deck.
Unlock Deck
k this deck
16
The whiskers in a boxplot
A) always enclose all of the data points.
B) always run from the smaller inner fence to the larger inner fence.
C) encompass the H-spread only.
D) contain all data points outside the box except the outliers.
A) always enclose all of the data points.
B) always run from the smaller inner fence to the larger inner fence.
C) encompass the H-spread only.
D) contain all data points outside the box except the outliers.
Unlock Deck
Unlock for access to all 62 flashcards in this deck.
Unlock Deck
k this deck
17
In a boxplot the width of the box encompasses
A) all of the observed values.
B) all but the most extreme values.
C) approximately 50% of the observed values.
D) the center-most 10% of the values.
A) all of the observed values.
B) all but the most extreme values.
C) approximately 50% of the observed values.
D) the center-most 10% of the values.
Unlock Deck
Unlock for access to all 62 flashcards in this deck.
Unlock Deck
k this deck
18
The population variance is
A) an estimate of the sample variance.
B) calculated exactly like the sample variance.
C) a biased estimate.
D) usually an unknown that we try to estimate.
A) an estimate of the sample variance.
B) calculated exactly like the sample variance.
C) a biased estimate.
D) usually an unknown that we try to estimate.
Unlock Deck
Unlock for access to all 62 flashcards in this deck.
Unlock Deck
k this deck
19
If we eliminate the top and bottom 25% of the data and take the range of what remains we have the
A) range.
B) adjusted range.
C) interquartile range.
D) quartile variance.
A) range.
B) adjusted range.
C) interquartile range.
D) quartile variance.
Unlock Deck
Unlock for access to all 62 flashcards in this deck.
Unlock Deck
k this deck
20
An outlier
A) can be an extreme score.
B) can be an error that snuck into the data.
C) will never have a large influence on many measures of variability.
D) both a and b
A) can be an extreme score.
B) can be an error that snuck into the data.
C) will never have a large influence on many measures of variability.
D) both a and b
Unlock Deck
Unlock for access to all 62 flashcards in this deck.
Unlock Deck
k this deck
21
The problem with measuring dispersion by merely averaging all the deviations between each score and the overall mean is that
A) positive and negative deviations will balance out.
B) squared values make intuitive interpretation difficult.
C) dividing by (N-1) gives a biased statistic.
D) There are no problems with measuring dispersion this way.
A) positive and negative deviations will balance out.
B) squared values make intuitive interpretation difficult.
C) dividing by (N-1) gives a biased statistic.
D) There are no problems with measuring dispersion this way.
Unlock Deck
Unlock for access to all 62 flashcards in this deck.
Unlock Deck
k this deck
22
The equation
is used to calculate the
A) median.
B) hinge location.
C) outer fence.
D) inner fences.
is used to calculate theA) median.
B) hinge location.
C) outer fence.
D) inner fences.
Unlock Deck
Unlock for access to all 62 flashcards in this deck.
Unlock Deck
k this deck
23
The range is
A) the difference between the inner fences.
B) the H-spread.
C) not influenced very much by outliers.
D) the difference between the highest and lowest score.
A) the difference between the inner fences.
B) the H-spread.
C) not influenced very much by outliers.
D) the difference between the highest and lowest score.
Unlock Deck
Unlock for access to all 62 flashcards in this deck.
Unlock Deck
k this deck
24
The university counseling center has treated a large number of students for depression. They find that the standard deviation of depression scores for their pool of students is substantially higher after treatment than before treatment. The most likely explanation is
A) some students improved more than others.
B) some students improved substantially while others actually got worse.
C) depression therapy at the counseling center affects different students differently.
D) all of the above
A) some students improved more than others.
B) some students improved substantially while others actually got worse.
C) depression therapy at the counseling center affects different students differently.
D) all of the above
Unlock Deck
Unlock for access to all 62 flashcards in this deck.
Unlock Deck
k this deck
25
A "hinge" is another word for
A) the median.
B) a quartile.
C) the range.
D) boundary.
A) the median.
B) a quartile.
C) the range.
D) boundary.
Unlock Deck
Unlock for access to all 62 flashcards in this deck.
Unlock Deck
k this deck
26
A boxplot is better than a statistic such as the mean when your purpose is
A) to describe the central tendency of a population.
B) to describe the variability of a population.
C) to understand what a distribution of data looks like.
D) It is only worthwhile if you care only about medians.
A) to describe the central tendency of a population.
B) to describe the variability of a population.
C) to understand what a distribution of data looks like.
D) It is only worthwhile if you care only about medians.
Unlock Deck
Unlock for access to all 62 flashcards in this deck.
Unlock Deck
k this deck
27
The disadvantage of using an interquartile range is that
A) it discards too much of the data.
B) it removes outliers only extremely high in value.
C) the positive and negative deviations balance out.
D) it is disproportionately influenced by outliers.
A) it discards too much of the data.
B) it removes outliers only extremely high in value.
C) the positive and negative deviations balance out.
D) it is disproportionately influenced by outliers.
Unlock Deck
Unlock for access to all 62 flashcards in this deck.
Unlock Deck
k this deck
28
Given the numbers 1, 2, and 3, the standard deviation is
A) 0
B) 1
C) 0.667
D) the square of the variance
A) 0
B) 1
C) 0.667
D) the square of the variance
Unlock Deck
Unlock for access to all 62 flashcards in this deck.
Unlock Deck
k this deck
29
If the average adult male in the United States is 5' 9" tall, and the standard deviation for height is 2", approximately how many adult males would you expect to be between 5' 7" and 5'11" tall?
A) 50% of them
B) 66.7% of them
C) 75% of them
D) 90% of them
A) 50% of them
B) 66.7% of them
C) 75% of them
D) 90% of them
Unlock Deck
Unlock for access to all 62 flashcards in this deck.
Unlock Deck
k this deck
30
If I continue to draw observations from a population and recalculate the mean each time I add an observation, the mean will approach _______ as the sample size increases.
A) its expected value
B) the true population mean
C) the median of the population if the population is symmetric
D) all of the above
A) its expected value
B) the true population mean
C) the median of the population if the population is symmetric
D) all of the above
Unlock Deck
Unlock for access to all 62 flashcards in this deck.
Unlock Deck
k this deck
31
As you increase the number of observations in a sample from 50 to 500, you are most likely to
A) leave the mean and standard deviation approximately unchanged.
B) increase the variability as the sample size increases.
C) decrease the variability as the sample size increases.
D) make the shape of the distribution more skewed.
A) leave the mean and standard deviation approximately unchanged.
B) increase the variability as the sample size increases.
C) decrease the variability as the sample size increases.
D) make the shape of the distribution more skewed.
Unlock Deck
Unlock for access to all 62 flashcards in this deck.
Unlock Deck
k this deck
32
Which of the following is NOT a method of describing data that reduces the role of outliers on the measurement of a data set's variability?
A) interquartile range
B) boxplot
C) range
D) trimmed statistics
A) interquartile range
B) boxplot
C) range
D) trimmed statistics
Unlock Deck
Unlock for access to all 62 flashcards in this deck.
Unlock Deck
k this deck
33
The US Census Bureau collected data on family composition and found that samples from different parts of the country gave very different results for the mean number of family members living in households. If all of the data were combined to one data set,
A) the standard deviation of number of family members would probably be very small.
B) the standard deviation of number of family members would probably be relatively high.
C) the interquartile range would be small.
D) the median would equal the mean.
A) the standard deviation of number of family members would probably be very small.
B) the standard deviation of number of family members would probably be relatively high.
C) the interquartile range would be small.
D) the median would equal the mean.
Unlock Deck
Unlock for access to all 62 flashcards in this deck.
Unlock Deck
k this deck
34
Errors that can lead to outliers can occur in
A) measurement.
B) data recording.
C) data entry.
D) all of the above
A) measurement.
B) data recording.
C) data entry.
D) all of the above
Unlock Deck
Unlock for access to all 62 flashcards in this deck.
Unlock Deck
k this deck
35
You would obtain a negative value for the variance if
A) all observations were at the mean.
B) the distribution is very negatively skewed.
C) the distribution if positively skewed.
D) you would never obtain a negative variance.
A) all observations were at the mean.
B) the distribution is very negatively skewed.
C) the distribution if positively skewed.
D) you would never obtain a negative variance.
Unlock Deck
Unlock for access to all 62 flashcards in this deck.
Unlock Deck
k this deck
36
If we know that a set of test scores has a mean of 75 and a standard deviation of 8, we would conclude that
A) the average deviation from the mean is about 8 points.
B) the average person will have a score of 75 + 8 = 83.
C) more people are above 75 than below it.
D) You can't tell anything about how scores lie relative to the mean.
A) the average deviation from the mean is about 8 points.
B) the average person will have a score of 75 + 8 = 83.
C) more people are above 75 than below it.
D) You can't tell anything about how scores lie relative to the mean.
Unlock Deck
Unlock for access to all 62 flashcards in this deck.
Unlock Deck
k this deck
37
We normally compute the variance using N - 1 in the denominator because
A) it is easier that way.
B) it leads to an unbiased estimate of the sample variance.
C) it leads to an unbiased estimate of the population variance.
D) it overestimates that population variance.
A) it is easier that way.
B) it leads to an unbiased estimate of the sample variance.
C) it leads to an unbiased estimate of the population variance.
D) it overestimates that population variance.
Unlock Deck
Unlock for access to all 62 flashcards in this deck.
Unlock Deck
k this deck
38
The standard deviation for the numbers 8, 9, and 10 is
A) -3.0
B) 0.0
C) .67
D) 1.0
A) -3.0
B) 0.0
C) .67
D) 1.0
Unlock Deck
Unlock for access to all 62 flashcards in this deck.
Unlock Deck
k this deck
39
A data set of intelligence scores was collected from high school seniors. The IQ scores ranged from 82 to 113. Which of the following is probably NOT a reasonable estimate of the standard deviation?
A) 6.2
B) 4.7
C) 35.4
D) All of the above are reasonable estimates.
A) 6.2
B) 4.7
C) 35.4
D) All of the above are reasonable estimates.
Unlock Deck
Unlock for access to all 62 flashcards in this deck.
Unlock Deck
k this deck
40
The interquartile range
A) is the 50th percentile score in a data set.
B) contains as few as 25% of scores or as many as 75% of scores in a data set
C) contains the middle 50% of scores in a data set.
D) is the same as the range.
A) is the 50th percentile score in a data set.
B) contains as few as 25% of scores or as many as 75% of scores in a data set
C) contains the middle 50% of scores in a data set.
D) is the same as the range.
Unlock Deck
Unlock for access to all 62 flashcards in this deck.
Unlock Deck
k this deck
41
The variance of a sample is typically a larger value than the standard deviation.
Unlock Deck
Unlock for access to all 62 flashcards in this deck.
Unlock Deck
k this deck
42
Answer the next two questions based on the following box-plot.
The median of this distribution is 16.
The median of this distribution is 16.
Unlock Deck
Unlock for access to all 62 flashcards in this deck.
Unlock Deck
k this deck
43
Trimmed statistics are calculated based on the entire sample.
Unlock Deck
Unlock for access to all 62 flashcards in this deck.
Unlock Deck
k this deck
44
Measures of variability refer to the dispersion of data around the mean or the center.
Unlock Deck
Unlock for access to all 62 flashcards in this deck.
Unlock Deck
k this deck
45
Of all of the measures of variability, the standard deviation is most susceptible to distortion due to outliers.
Unlock Deck
Unlock for access to all 62 flashcards in this deck.
Unlock Deck
k this deck
46
A sample of 20 families reported how many children they have. Answer the following questions based on the summary table below.
a) What is the range?
b. What is the variance?
c. What is the standard deviation?
a) What is the range?
b. What is the variance?
c. What is the standard deviation?
Unlock Deck
Unlock for access to all 62 flashcards in this deck.
Unlock Deck
k this deck
47
Answer the following questions based on this set of numbers:
1 2 2 3 3 3 4 5
a. What is the range?
b. What is the variance?
c. What is the standard deviation?
1 2 2 3 3 3 4 5
a. What is the range?
b. What is the variance?
c. What is the standard deviation?
Unlock Deck
Unlock for access to all 62 flashcards in this deck.
Unlock Deck
k this deck
48
The sample variance is a biased statistic.
Unlock Deck
Unlock for access to all 62 flashcards in this deck.
Unlock Deck
k this deck
49
Create a box plot for the above data.
Unlock Deck
Unlock for access to all 62 flashcards in this deck.
Unlock Deck
k this deck
50
Answer the following questions based on this distribution of exam scores.
a. What is the median?
b. Are there outliers?
c. Does the distribution seem skewed? If so, is it positively, or negatively skewed?
a. What is the median?
b. Are there outliers?
c. Does the distribution seem skewed? If so, is it positively, or negatively skewed?
Unlock Deck
Unlock for access to all 62 flashcards in this deck.
Unlock Deck
k this deck
51
The population variance is
A) an estimate of the sample variance.
B) usually an unknown that we try to estimate.
C) calculated exactly like the sample variance.
D) a biased estimate.
A) an estimate of the sample variance.
B) usually an unknown that we try to estimate.
C) calculated exactly like the sample variance.
D) a biased estimate.
Unlock Deck
Unlock for access to all 62 flashcards in this deck.
Unlock Deck
k this deck
52
The interquartile range is the range of the middle 25% of values.
Unlock Deck
Unlock for access to all 62 flashcards in this deck.
Unlock Deck
k this deck
53
What happens to the standard deviation when a constant is added to each score? Use the following set of data, and a constant of 2 to illustrate your answer.
1 2 3 4
1 2 3 4
Unlock Deck
Unlock for access to all 62 flashcards in this deck.
Unlock Deck
k this deck
54
The median is a measure of variability.
Unlock Deck
Unlock for access to all 62 flashcards in this deck.
Unlock Deck
k this deck
55
The difference between the lowest to the highest score in a distribution is the range.
Unlock Deck
Unlock for access to all 62 flashcards in this deck.
Unlock Deck
k this deck
56
Answer the next two questions based on the following box-plot.
There no outliers.
There no outliers.
Unlock Deck
Unlock for access to all 62 flashcards in this deck.
Unlock Deck
k this deck
57
Data points at the extremes of the distribution have
A) little effect on the variance.
B) distort the usefulness of the median.
C) more effect on the variance than scores at the center of the distribution.
D) are undoubtedly incorrect.
A) little effect on the variance.
B) distort the usefulness of the median.
C) more effect on the variance than scores at the center of the distribution.
D) are undoubtedly incorrect.
Unlock Deck
Unlock for access to all 62 flashcards in this deck.
Unlock Deck
k this deck
58
Compare the distribution of exam scores for students who did and did not read the textbook prior to taking the exam. Discuss measures of variability and of central tendency.
Unlock Deck
Unlock for access to all 62 flashcards in this deck.
Unlock Deck
k this deck
59
Based on the same data, calculate:
a. The median location
b. The median
c. The hinge location
d. The upper hinge
e. The lower hinge
f. H spread
g. Lower fence
h. Upper fence
i. Lower adjacent value
j. Upper adjacent value
Unlock Deck
Unlock for access to all 62 flashcards in this deck.
Unlock Deck
k this deck
60
Create two sets of scores with equal ranges, but different variances.
Unlock Deck
Unlock for access to all 62 flashcards in this deck.
Unlock Deck
k this deck
61
Given the following distribution, which would be the least useful measure of central tendency? Explain your answer.
Unlock Deck
Unlock for access to all 62 flashcards in this deck.
Unlock Deck
k this deck
62
Construct two small sets of data that have the same mean, but a different standard deviation.
Unlock Deck
Unlock for access to all 62 flashcards in this deck.
Unlock Deck
k this deck
Unlock Deck
Unlock for access to all 62 flashcards in this deck.


