Exam 5: Measures of Variability
Exam 1: Introduction61 Questions
Exam 2: Basic Concepts58 Questions
Exam 3: Displaying Data57 Questions
Exam 4: Measures of Central Tendency55 Questions
Exam 5: Measures of Variability62 Questions
Exam 6: The Normal Distribution59 Questions
Exam 7: Basic Concepts of Probability61 Questions
Exam 8: Sampling Distributions and Hypothesis Testing69 Questions
Exam 9: Correlation71 Questions
Exam 10: Regression66 Questions
Exam 11: Multiple Regression58 Questions
Exam 12: Hypothesis Tests Applied to Means: One Sample67 Questions
Exam 13: Hypothesis Tests Applied to Means: Two Related Samples59 Questions
Exam 14: Hypothesis Tests Applied to Means: Two Independent Samples63 Questions
Exam 15: Power70 Questions
Exam 16: One-Way Analysis of Variance85 Questions
Exam 17: Factorial Analysis of Variance74 Questions
Exam 18: Repeated-Measures Analysis of Variance62 Questions
Exam 19: Chi-Square56 Questions
Exam 20: Nonparametric and Resampling Statistical Tests45 Questions
Exam 21: Meta-Analysis57 Questions
Select questions type
Given the numbers 1, 2, and 3, the standard deviation is
Free
(Multiple Choice)
4.9/5  (39)
(39)
Correct Answer: Verified
B
A boxplot is better than a statistic such as the mean when your purpose is
Free
(Multiple Choice)
4.8/5 (38)
Correct Answer:Verified
C
When calculating the standard deviation we divide by N -1 rather than N because the result is
(Multiple Choice)
4.8/5 (39)
Which of the following is NOT a method of describing data that reduces the role of outliers on the measurement of a data set's variability?
(Multiple Choice)
4.8/5 (38)
Measures of variability refer to the dispersion of data around the mean or the center.
(True/False)
4.9/5 (31)
The problem with measuring dispersion by merely averaging all the deviations between each score and the overall mean is that
(Multiple Choice)
4.7/5 (42)
People in the stock market refer to a measure called the "standard deviation," although it is calculated somewhat differently from the one discussed here. It is a good guess that this measure refers to
(Multiple Choice)
4.9/5 (30)
Answer the next two questions based on the following box-plot.
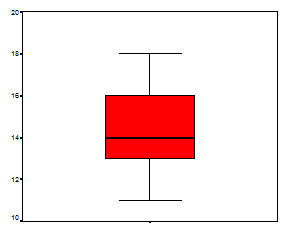 The median of this distribution is 16.
(True/False)
4.9/5 (30)
Which of the following sets of data is likely to have the smallest standard deviation?
(Multiple Choice)
4.9/5 (29)
Compare the distribution of exam scores for students who did and did not read the textbook prior to taking the exam. Discuss measures of variability and of central tendency.
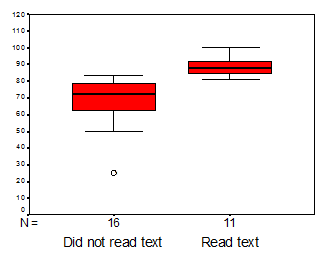
(Essay)
4.8/5 (32)
Given the following distribution, which would be the least useful measure of central tendency? Explain your answer.
(Essay)
4.7/5 (30)
 -Based on the same data, calculate:
a. The median location
b. The median
c. The hinge location
d. The upper hinge
e. The lower hinge
f. H spread
g. Lower fence
h. Upper fence
i. Lower adjacent value
j. Upper adjacent value
-Based on the same data, calculate:
a. The median location
b. The median
c. The hinge location
d. The upper hinge
e. The lower hinge
f. H spread
g. Lower fence
h. Upper fence
i. Lower adjacent value
j. Upper adjacent value
(Essay)
4.7/5 (26)
If we multiply a set of data by a constant, such as converting feet to inches, we will
(Multiple Choice)
4.8/5 (26)
If the average adult male in the United States is 5' 9" tall, and the standard deviation for height is 2", approximately how many adult males would you expect to be between 5' 7" and 5'11" tall?
(Multiple Choice)
4.9/5 (38)
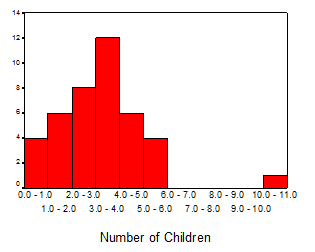
A sample of 20 families reported how many children they have. Answer the following questions based on the summary table below.
a) What is the range?
b. What is the variance?
c. What is the standard deviation?
(Short Answer)
4.8/5 (40)
Filters
- Essay(0)
- Multiple Choice(0)
- Short Answer(0)
- True False(0)
- Matching(0)