Deck 16: Statistical Analyses
Full screen (f)
Question
Question
Question
Question
Question
Question
Question
Given the following computer printout from a factor analysis, which of the following statements is TRUE? 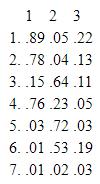
A)There are seven factors.
B)There are seven variables.
C)Factor #7 could be eliminated from the analysis.
D)Variable #2 is most important for factor #2.
E)Variable #3 tells us nothing.
A)There are seven factors.
B)There are seven variables.
C)Factor #7 could be eliminated from the analysis.
D)Variable #2 is most important for factor #2.
E)Variable #3 tells us nothing.
Question
Question
Question
Question
Question
Question
Question
Question
Question
Question
Question
Question
Question
Question
Question
Question
Question
Question
Question
Question
Question
Question
An appropriate measure of association for the data presented below is: 
A)gamma.
B)lambda.
C)chi square.
D)Pearson's product moment correlation.
E)alpha.
A)gamma.
B)lambda.
C)chi square.
D)Pearson's product moment correlation.
E)alpha.
Question
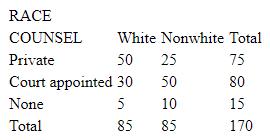
How many degrees of freedom exist in the following table? 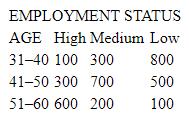
A)9
B)8
C)3
D)4
E)1
A)9
B)8
C)3
D)4
E)1
Question
Question
Question
Question
Question
Question
Question
Question
Question
Question
Given the following table:
a. Calculate and interpret an appropriate measure of association.
b. Calculate and interpret chi square at the .05 level of significance.
a. Calculate and interpret an appropriate measure of association.
b. Calculate and interpret chi square at the .05 level of significance.

Unlock Deck
Sign up to unlock the cards in this deck!
Unlock Deck
Unlock Deck
1/40
Play
Full screen (f)
Deck 16: Statistical Analyses
1
Inferential statistics are used to:
A)make inferences to only the sample used.
B)make inferences to the population the sample was taken from.
C)infer more empirically the underlying meaning of concepts.
D)infer which assumptions can be violated when doing multivariate analysis.
E)make inferences to the validity of the analytic results.
B
2
Which of the following is an INAPPROPRIATE unit of analysis in Geographic Information Systems?
A)countries
B)states
C)fire departments
D)census tracts
E)cities
A)countries
B)states
C)fire departments
D)census tracts
E)cities
C
3
Professor Triker is interested in examining the occupational mobility of women in the United States. Triker believes that people's first job affects their second job and that job in turn affects their third job, and so on. To analyze the data Triker should use:
A)factor analysis.
B)time-series analysis.
C)two-way analysis of variance.
D)smallest-space analysis.
E)curvilinear regression analysis.
A)factor analysis.
B)time-series analysis.
C)two-way analysis of variance.
D)smallest-space analysis.
E)curvilinear regression analysis.
B
4
Samuel wanted to calculate a measure of association for her two variables of age and education, both of which were coded in three ordinal categories. Which one of the following would be best?
A)lambda
B)omega
C)gamma
D)alpha
E)delta
A)lambda
B)omega
C)gamma
D)alpha
E)delta
Unlock Deck
Unlock for access to all 40 flashcards in this deck.
Unlock Deck
k this deck
5
If an association is statistically significant, it is an important relationship.
Unlock Deck
Unlock for access to all 40 flashcards in this deck.
Unlock Deck
k this deck
6
In path analysis, the statistic measuring the strength of a relationship between pairs of variables with the effect of other variables held constant is called:
A)a path coefficient.
B)a partial epsilon.
C)a coefficient of alienation.
D)residual variance.
E)a variance coefficient.
A)a path coefficient.
B)a partial epsilon.
C)a coefficient of alienation.
D)residual variance.
E)a variance coefficient.
Unlock Deck
Unlock for access to all 40 flashcards in this deck.
Unlock Deck
k this deck
7
Given the following computer printout from a factor analysis, which of the following statements is TRUE?
A)There are seven factors.
B)There are seven variables.
C)Factor #7 could be eliminated from the analysis.
D)Variable #2 is most important for factor #2.
E)Variable #3 tells us nothing.
A)There are seven factors.
B)There are seven variables.
C)Factor #7 could be eliminated from the analysis.
D)Variable #2 is most important for factor #2.
E)Variable #3 tells us nothing.
Unlock Deck
Unlock for access to all 40 flashcards in this deck.
Unlock Deck
k this deck
8
The proportionate reduction in error is related to the strength of the relationship between two variables.
Unlock Deck
Unlock for access to all 40 flashcards in this deck.
Unlock Deck
k this deck
9
The appropriate measure of association for two nominal-level variables is:
A)lambda.
B)omega.
C)gamma.
D)alpha.
E)PRE.
A)lambda.
B)omega.
C)gamma.
D)alpha.
E)PRE.
Unlock Deck
Unlock for access to all 40 flashcards in this deck.
Unlock Deck
k this deck
10
In a 2×3 table how many cells do we need to fill in before the remainder of the table is determined by the marginal frequencies?
A)2
B)3
C)4
D)5
E)6
A)2
B)3
C)4
D)5
E)6
Unlock Deck
Unlock for access to all 40 flashcards in this deck.
Unlock Deck
k this deck
11
Helene has two ratio-level variables in her study and wants to calculate a measure of association. Which one of the following would be best?
A)Patterson's D
B)Shirley's F
C)Pearson's r
D)Farley's s
E)Gamma's r
A)Patterson's D
B)Shirley's F
C)Pearson's r
D)Farley's s
E)Gamma's r
Unlock Deck
Unlock for access to all 40 flashcards in this deck.
Unlock Deck
k this deck
12
Faced with data that do not support an assumption of independence between two variables in a population, a researcher should:
A)immediately reject the assumption of independence.
B)attribute this discrepancy to an unrepresentative sample or reject the assumption of independence.
C)retest the data in order to confirm these initial findings.
D)immediately assume that the sample was unrepresentative of the population.
E)ignore the findings as incorrect and start again.
Unlock Deck
Unlock for access to all 40 flashcards in this deck.
Unlock Deck
k this deck
13
A disadvantage of factor analysis is that it does not permit hypotheses to be disconfirmed.
Unlock Deck
Unlock for access to all 40 flashcards in this deck.
Unlock Deck
k this deck
14
A .05 level of significance means that:
A)there is only a 5% chance that the statistic's value could be obtained as a result of sampling error.
B)one is 50% certain that the sample value is representative of the population.
C)there is only a 5% chance that the variables tested are not independent.
D)the results can be accepted because the sampling error is only 5%.
E)the level of confidence is only 5%.
Unlock Deck
Unlock for access to all 40 flashcards in this deck.
Unlock Deck
k this deck
15
Which of the following techniques would be MOST useful in analyzing the relationship between sex (male, female), political party preference (Democrat, Republican, Other), religious affiliation (believe in a higher order, unsure about a higher order, do not believe in a higher order), and support for gun control (yes, no, don't know)?
A)log-linear models
B)one-way ANOVA
C)partial regression
D)chi square
E)multiple regression
A)log-linear models
B)one-way ANOVA
C)partial regression
D)chi square
E)multiple regression
Unlock Deck
Unlock for access to all 40 flashcards in this deck.
Unlock Deck
k this deck
16
At the univariate level, descriptive statistics are used for:
A)measures of association.
B)multivariate analyses.
C)data expansion.
D)data reduction.
E)determining causality.
A)measures of association.
B)multivariate analyses.
C)data expansion.
D)data reduction.
E)determining causality.
Unlock Deck
Unlock for access to all 40 flashcards in this deck.
Unlock Deck
k this deck
17
Basically, path analysis attempts to:
A)study a relationship between two variables with a third variable held constant.
B)examine a nonlinear relationship between two variables.
C)describe relationships among variables by developing causal models.
D)determine the irreducible factors underlying a series of variables.
E)represent relationships as distances between points.
Unlock Deck
Unlock for access to all 40 flashcards in this deck.
Unlock Deck
k this deck
18
Which of the following hypotheses assumes that there is no relationship between two variables?
A)research
B)null
C)alternate
D)secondary
E)substantive
A)research
B)null
C)alternate
D)secondary
E)substantive
Unlock Deck
Unlock for access to all 40 flashcards in this deck.
Unlock Deck
k this deck
19
Which of the following statements is FALSE about the logic of ANOVA?
A)The cases under study are combined into groups representing an independent variable.
B)The extent to which groups differ from one another is analyzed in terms of some dependent variable.
C)The extent to which the groups differ is compared with the standard random distribution.
D)Only one explanatory variable can be used in an ANOVA analysis.
E)More than one explanatory variable can be used in an ANOVA analysis.
Unlock Deck
Unlock for access to all 40 flashcards in this deck.
Unlock Deck
k this deck
20
The formulas for some measures of association can result in coefficients with either positive or negative signs. Under which of the following circumstances can those signs be meaningfully interpreted?
A)Whenever the data are expressed as frequencies
B)When the data are measured at the nominal level
C)When the data are measured at the ordinal level
D)Whenever the data have a modal category
E)Whenever the data are expressed as percentages
A)Whenever the data are expressed as frequencies
B)When the data are measured at the nominal level
C)When the data are measured at the ordinal level
D)Whenever the data have a modal category
E)Whenever the data are expressed as percentages
Unlock Deck
Unlock for access to all 40 flashcards in this deck.
Unlock Deck
k this deck
21
Inferential statistics are used primarily for describing samples.
Unlock Deck
Unlock for access to all 40 flashcards in this deck.
Unlock Deck
k this deck
22
Both lambda and Pearson's product-moment correlation are based on guessing the mean.
Unlock Deck
Unlock for access to all 40 flashcards in this deck.
Unlock Deck
k this deck
23
A gamma value of .7 indicates a stronger relationship than a gamma value of -7.
Unlock Deck
Unlock for access to all 40 flashcards in this deck.
Unlock Deck
k this deck
24
Which of the following is NOT an assumption underlying the use of inferential statistics?
A)sample must be drawn from the population about which inferences are to be made
B)nonprobability sampling
C)100% completion rate
D)sampling with replacement
E)simple random sampling
A)sample must be drawn from the population about which inferences are to be made
B)nonprobability sampling
C)100% completion rate
D)sampling with replacement
E)simple random sampling
Unlock Deck
Unlock for access to all 40 flashcards in this deck.
Unlock Deck
k this deck
25
Illustrate the logic of path analysis by constructing and interpreting a path diagram that traces the relationships among three or more variables.
Unlock Deck
Unlock for access to all 40 flashcards in this deck.
Unlock Deck
k this deck
26
Regression analysis is an integral part of inferential statistics. Using real-life examples, explain when it would be appropriate to use each of the following types of regression analysis: a)linear regression b)multiple regression c)partial regression d)curvilinear regression
Unlock Deck
Unlock for access to all 40 flashcards in this deck.
Unlock Deck
k this deck
27
Jeff thinks that market sales are influenced by the preceding year's unemployment rate. Jeff should use a ____ for his analysis.
A)discriminant analysis
B)path analysis
C)factor analysis
D)time-lagged regression analysis
E)regression analysis
A)discriminant analysis
B)path analysis
C)factor analysis
D)time-lagged regression analysis
E)regression analysis
Unlock Deck
Unlock for access to all 40 flashcards in this deck.
Unlock Deck
k this deck
28
A path diagram allows you to determine the effect of one variable upon another both directly and indirectly through an intervening variable.
Unlock Deck
Unlock for access to all 40 flashcards in this deck.
Unlock Deck
k this deck
29
An appropriate measure of association for the data presented below is:
A)gamma.
B)lambda.
C)chi square.
D)Pearson's product moment correlation.
E)alpha.
A)gamma.
B)lambda.
C)chi square.
D)Pearson's product moment correlation.
E)alpha.
Unlock Deck
Unlock for access to all 40 flashcards in this deck.
Unlock Deck
k this deck
30
How many degrees of freedom exist in the following table?
A)9
B)8
C)3
D)4
E)1
A)9
B)8
C)3
D)4
E)1
Unlock Deck
Unlock for access to all 40 flashcards in this deck.
Unlock Deck
k this deck
31
Raj wanted to examine the strength of the relationship between political affiliation (Democrat, Republican, Independent, Other, None)and religious beliefs (Protestant, Catholic, Jewish, Muslim, Other, None). Which measure of association should he use to present this relationship?
A)lambda
B)gamma
C)chi square
D)Pearson's product moment correlation
E)omega
A)lambda
B)gamma
C)chi square
D)Pearson's product moment correlation
E)omega
Unlock Deck
Unlock for access to all 40 flashcards in this deck.
Unlock Deck
k this deck
32
Which of the following statistics can be used to determine whether or not there is a statistically significant relationship between two variables in a contingency table?
A)gamma
B)chi square
C)lambda
D)Pearson's product moment correlation coefficient
E)ANOVA
A)gamma
B)chi square
C)lambda
D)Pearson's product moment correlation coefficient
E)ANOVA
Unlock Deck
Unlock for access to all 40 flashcards in this deck.
Unlock Deck
k this deck
33
Explain the assumptions underlying the use of tests of significance. Why is there a controversy over the use of these tests?
Unlock Deck
Unlock for access to all 40 flashcards in this deck.
Unlock Deck
k this deck
34
Chi square is based upon a comparison of observed frequencies with the frequencies that would be expected if there was no relationship between the variables.
Unlock Deck
Unlock for access to all 40 flashcards in this deck.
Unlock Deck
k this deck
35
A gamma value of 3.3 indicates:
A)an extremely strong relationship.
B)an error in calculations.
C)a moderately weak relationship.
D)an extremely weak relationship.
E)no relationship at all.
A)an extremely strong relationship.
B)an error in calculations.
C)a moderately weak relationship.
D)an extremely weak relationship.
E)no relationship at all.
Unlock Deck
Unlock for access to all 40 flashcards in this deck.
Unlock Deck
k this deck
36
You should allow the computer to generate the path model.
Unlock Deck
Unlock for access to all 40 flashcards in this deck.
Unlock Deck
k this deck
37
Using simple random sampling, 100 males were drawn from a population and asked their age. The mean age for these men was 22. The standard error for the sample was 5. We are 68% confident that the population parameter is:
A)22.
B)between 19.5 and 24.5.
C)between 17 and 27.
D)between 12 and 32.
E)between 10 and 30.
A)22.
B)between 19.5 and 24.5.
C)between 17 and 27.
D)between 12 and 32.
E)between 10 and 30.
Unlock Deck
Unlock for access to all 40 flashcards in this deck.
Unlock Deck
k this deck
38
You are interested in studying the causes of juvenile delinquency. Construct a path diagram, using theoretical constructs to indicate causal relationships with three or more independent variables. Interpret your diagram.
Unlock Deck
Unlock for access to all 40 flashcards in this deck.
Unlock Deck
k this deck
39
In factor analysis the researcher must specify the number of factors and which variables to load on the factor to allow the computer to generate factor loadings.
Unlock Deck
Unlock for access to all 40 flashcards in this deck.
Unlock Deck
k this deck
40
Given the following table:
a. Calculate and interpret an appropriate measure of association.
b. Calculate and interpret chi square at the .05 level of significance.
a. Calculate and interpret an appropriate measure of association.
b. Calculate and interpret chi square at the .05 level of significance.
Unlock Deck
Unlock for access to all 40 flashcards in this deck.
Unlock Deck
k this deck
Unlock Deck
Unlock for access to all 40 flashcards in this deck.


