Deck 2: Nonlinear Functions and Models
Full screen (f)
Question
Suppose the amount of carbon dioxide (in pounds per 15,000 miles)released by a typical sport utility vehicle (SUV)depends on its fuel efficiency according to the formula 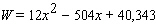 where x is a fuel efficiency of an SUV in miles per gallon. According to the model, what is the fuel efficiency of an SUV that has the least carbon dioxide pollution?
A)10 miles per gallon
B)24 miles per gallon
C)6 miles per gallon
D)11 miles per gallon
E)21 miles per gallon
where x is a fuel efficiency of an SUV in miles per gallon. According to the model, what is the fuel efficiency of an SUV that has the least carbon dioxide pollution?A)10 miles per gallon
B)24 miles per gallon
C)6 miles per gallon
D)11 miles per gallon
E)21 miles per gallon
Question
Choose the logistic function that best approximates the curve. 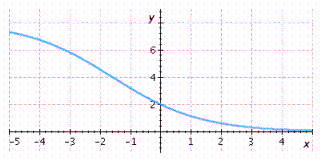
A)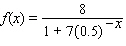
B)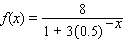
C)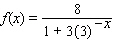
__________
A)
B)
C)
__________
Question
Encouraged by the popularity of your Dungeons and Dragons website, www.mudbeast.net, you have decided to charge users who log on to the site. When you charged a $1.50 access fee, your web counter showed a demand of 160 "hits" per month. After you lowered the price to $1.00, activity increased to 410 hits per month. Obtain the monthly revenue R as a function of the access fee x .
A)
B)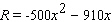
C)
D)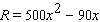
E)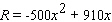
A)
B)
C)
D)
E)
Question
For the following demand equation, find the largest possible revenue. 
A)500
B)250,000
C)375,000
D)125,000
E)250
A)500
B)250,000
C)375,000
D)125,000
E)250
Question
Choose the logistic function that best approximates the curve. 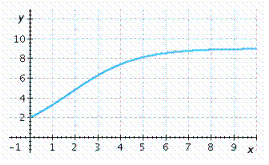
A)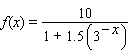
B)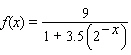
C)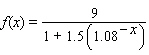
__________
A)
B)
C)
__________
Question
The Better Baby Buggy Co. has just come out with a new model, the Turbo. The market research department predicts that the demand equation for Turbos is given by  where q is the number of buggies it can sell in one month if the price is $ x per buggy. At what price should it sell the buggies to get the largest revenue? Round the result to the nearest dollar.
A)
B)
C)
D)
E)
where q is the number of buggies it can sell in one month if the price is $ x per buggy. At what price should it sell the buggies to get the largest revenue? Round the result to the nearest dollar.A)
B)
C)
D)
E)
Question
Match between columns


Question
For the following demand equation, express the total revenue R as a function of the price p per item. 
A)
B)
C)
D)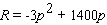
E)
A)
B)
C)
D)
E)
Question
Question
The market research department of the Better Baby Buggy Co. predicts that the demand equation for its buggies is given by  where q is the number of buggies it can sell in a month if the price is $ x per buggy. What is the largest monthly revenue?
A)
B)
C)
D)
E)
where q is the number of buggies it can sell in a month if the price is $ x per buggy. What is the largest monthly revenue?A)
B)
C)
D)
E)
Question
For the following demand equation, find the largest possible revenue.  $ __________
$ __________ Question
The following chart shows the value of trade between two countries for the period 1994-2004 (  represents 1994).
 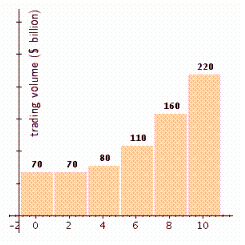 Which of the following models best approximates the data given? (Try to answer this without actually computing values.)
A)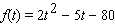
B)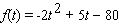
C)
D)
E)
represents 1994). Which of the following models best approximates the data given? (Try to answer this without actually computing values.)A)
B)
C)
D)
E)
Question
For the following demand equation, find the largest possible revenue. 
A)
B)
C)
D)
E)
A)
B)
C)
D)
E)
Question
You are the sales manager for Montevideo Productions, Inc., and you are planning to review the prices you charge clients for television advertisement development. You currently charge each client an hourly development fee of $2,000. With this pricing structure, the demand, measured by the number of contracts Montevideo signs per month, is 25 contracts. This is down 10 contracts from the figure last year, when your company charged only $1,000. Construct a linear demand equation giving the number of contracts q as a function of the hourly fee p Montevideo Productions, Inc., charges for development.
A)
B)
C)
D)
E)
A)
B)
C)
D)
E)
Question
The fuel efficiency (in miles per gallon)of a sport utility vehicle (SUV)depends on its weight according to the formula 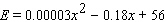 where x is the weight of an SUV in pounds. According to the model, what is the weight of the least fuel-efficient SUV?
A)6,000 pounds
B)3,000 pounds
C)3,100 pounds
D)2,000 pounds
E)326 pounds
where x is the weight of an SUV in pounds. According to the model, what is the weight of the least fuel-efficient SUV?A)6,000 pounds
B)3,000 pounds
C)3,100 pounds
D)2,000 pounds
E)326 pounds
Question
Find the y -intercept(s)of the graph of the quadratic function. 
A)
B)
C)
D) ,
, 
E) ,
, 
A)
B)
C)
D)
, E)
, Question
Question
Pack-Em-In Real Estate is building a new housing development. The more houses it builds, the less people will be willing to pay, due to the crowding and smaller lot sizes. In fact, if the company builds 60 houses in this particular development, it can sell them for $180,000 each, but if it builds 70 houses, it will be able to get only $170,000 each. What is the largest possible revenue the company can get?
A)
B)
C)
D)
E)
A)
B)
C)
D)
E)
Question
You have just opened a new nightclub, Russ's Techno Pitstop, but you are unsure how much to charge for the cover charge (entrance fee). One week you charged $7 cover per guest and averaged 339 guests per night. The next week you charged $16 per guest and averaged 222 guests per night. Find the linear demand equation showing the number of guests q per night as a function of the cover charge p .
A)
B)
C)
D)
E)
A)
B)
C)
D)
E)
Question
Find the vertex of the graph of the quadratic function. 
A)
B)
C)
D)
E)
A)
B)
C)
D)
E)
Question
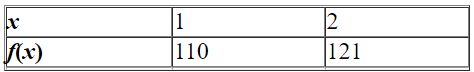
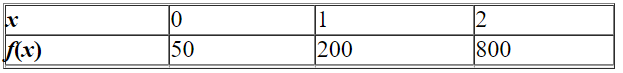
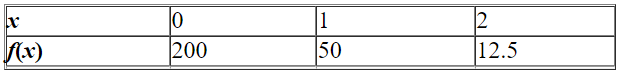
The given table corresponds to the function  .
. 
. Question
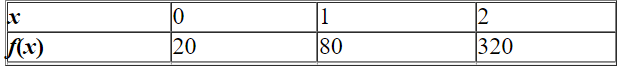
Model the data using an exponential function  .
. 
. Question
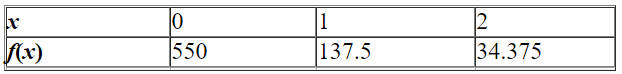
Model the data using an exponential function  .
.  Select the correct answer.
A)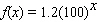
B)
C)
D)
E)
. Select the correct answer.A)
B)
C)
D)
E)
Question
Find an equation for exponential function that passes through the pair of points  and
and  .
.  (
(  )
)
A)
B)
C)
D)
E)
and . ( )A)
B)
C)
D)
E)
Question
Which of the following three functions will be largest for large values of x ? Select the correct answer.
A)
B)
C)
D)
E)
A)
B)
C)
D)
E)
Question
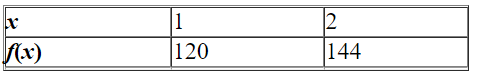
The given table corresponds to the function  .
. 
. Question
The given table corresponds to the function  .
. 
. Question
Model the data using an exponential function  .
. 
. Question
Given the graph of the functions  and
and  . Identify which graph corresponds to
  .
. 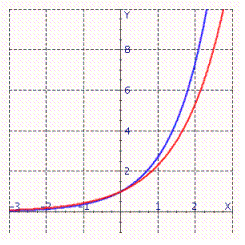 Select the correct answer.
A)Red
B)Blue
and . Identify which graph corresponds to . Select the correct answer.A)Red
B)Blue
Question
Question
Find the equation for the exponential function that passes through the pair of points  and
and  .
.  (
(  )A = __________ b = __________
and . ( )A = __________ b = __________ Question
Which of the following three functions will be smallest for large values of x ? Select the correct answer.
A)
B)
C)
D)
E)
A)
B)
C)
D)
E)
Question
Graph the function.  Select the correct answer.
A)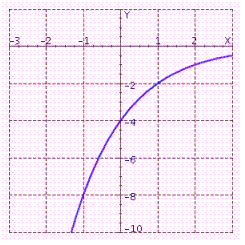
B)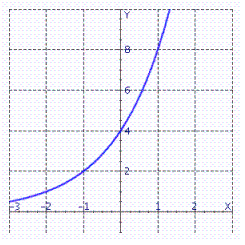
C)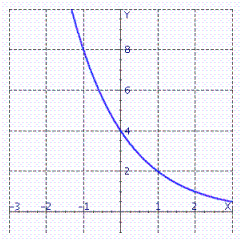
D)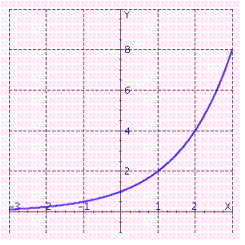
Select the correct answer.A)
B)
C)
D)
Question
Given the graph of the functions  and
and  . Determine the color of the graph that corresponds to
  .
. 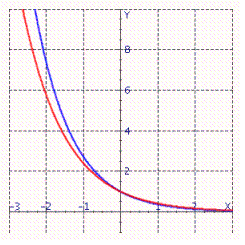 Select the correct answer.
A)Blue
B)Red
and . Determine the color of the graph that corresponds to . Select the correct answer.A)Blue
B)Red
Question
Model the data using an exponential function  .
. 
. Question
Question
Model the data using an exponential function  .
.  Select the correct answer.
A)
B)
C)
D)
E)
. Select the correct answer.A)
B)
C)
D)
E)
Question
Model the data using an exponential function  .
.  Select the correct answer.
A)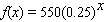
B)
C)
D)
E)
. Select the correct answer.A)
B)
C)
D)
E)
Question
Question
Question
Question
Question
The given table corresponds to the function 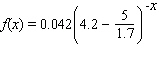 .
. 
. Question
Use logarithms to solve the equation. (Round answers to four decimal places.) 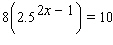
A)
B)
C)
D)
E)
A)
B)
C)
D)
E)
Question
Use logarithms to solve the equation. (Round answers to four decimal places.) 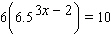 x = __________
x = __________ Question
Graph the function. 
A)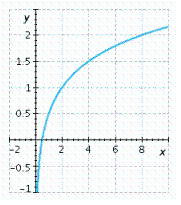
B)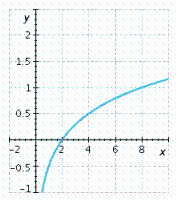
C)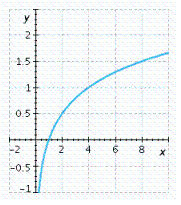
D)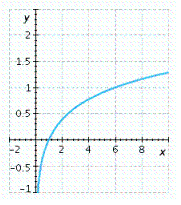
E)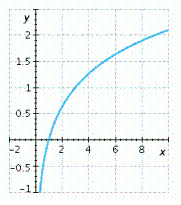
A)
B)
C)
D)
E)
Question
Question
The given table corresponds to the function  .
. 
. Question
Question
Graph the function. 
A)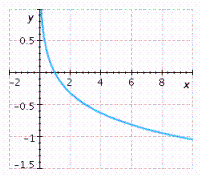
B)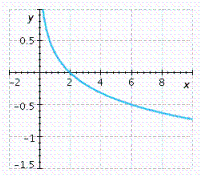
C)
D)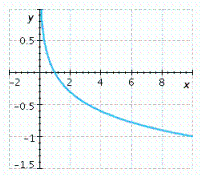
E)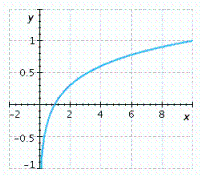
A)
B)
C)
D)
E)
Question
Question
Question
Find the associated exponential decay model.  when
when  ; Half-life
A)
B)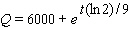
C)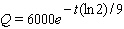
D)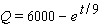
E)
when ; Half-life A)
B)
C)
D)
E)
Question
Find the associated doubling time. 
A)
B)
C)
D)
E)
A)
B)
C)
D)
E)
Question
Question
The given table corresponds to the function  .
. 
. Question
Convert the exponential function to the form indicated. Round all coefficients to four significant digits. 
A)
B)
C)
D)
E)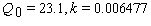
A)
B)
C)
D)
E)
Question
The amount of carbon-14 remaining in a sample that weighs A is given by  where t is time in years. If tests on a fossilized skull reveal that 99.97% of the carbon-14 has decayed, how old is the skull? Select the correct answer rounded to the nearest integer.
A)2,629 years old
B)23,234 years old
C)0 years old
D)1,985 years old
E)28,978 years old
where t is time in years. If tests on a fossilized skull reveal that 99.97% of the carbon-14 has decayed, how old is the skull? Select the correct answer rounded to the nearest integer.A)2,629 years old
B)23,234 years old
C)0 years old
D)1,985 years old
E)28,978 years old
Question
Convert the exponential function to the form indicated. Round all coefficients to four significant digits. 
A)
B)
C)
D)
E)
A)
B)
C)
D)
E)
Question
Use logarithms to solve the equation. (Round answers to four decimal places.) 
A)
B)
C)
D)
E)
A)
B)
C)
D)
E)
Question
Question
The table is filled correctly. Exponential form Logarithmic form 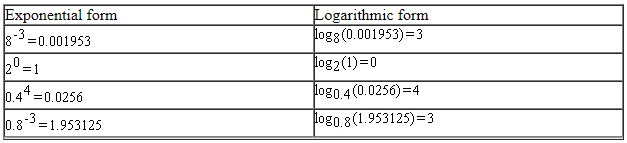
Question
Question
Find the logistic function  with the given properties.
  ,
,  has limiting value
  , and for small values of
  ,
,  is approximately exponential and doubles with every increase of 1 in
  .
.
A)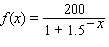
B)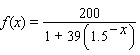
C)
D)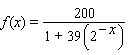
E)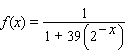
with the given properties. , has limiting value , and for small values of , is approximately exponential and doubles with every increase of 1 in .A)
B)
C)
D)
E)
Question
Find the associated exponential decay model.  when
when  ; Half-life =
when ; Half-life = Question
Choose the logistic function that best approximates the curve. 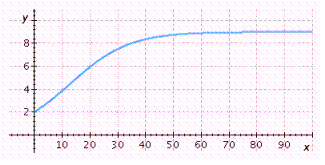
A)
B)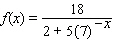
C)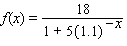
D)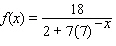
E)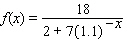
A)
B)
C)
D)
E)
Question
Find the logistic function  with the given properties.
  has limiting value 8 and passes through (0, 2)and (1, 6).
A)
B)
C)
D)
E)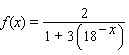
with the given properties. has limiting value 8 and passes through (0, 2)and (1, 6).A)
B)
C)
D)
E)
Question
Find N , A , and b for the function given. 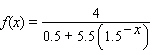
A)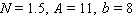
B)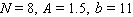
C)
D)
E)
A)
B)
C)
D)
E)
Question
Find N , A , and b for the function. 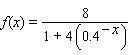
A)
B)
C)
D)
E)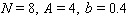
A)
B)
C)
D)
E)
Question
The chart shows the number of research articles in the prominent journal Physics Review that were written by researchers in Europe during 1983-2003 (  represents 1983).
 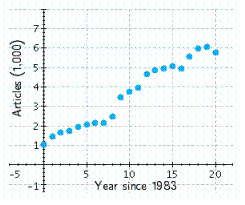 Which of the following logistic functions best models the data? (
  is the number of years since 1983.)Try to determine the correct model without actually computing data points.
A)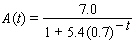
B)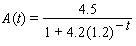
C)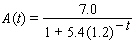
D)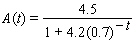
E)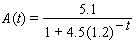
represents 1983). Which of the following logistic functions best models the data? ( is the number of years since 1983.)Try to determine the correct model without actually computing data points.A)
B)
C)
D)
E)
Question
The table below is filled correctly. Exponential form Logarithmic form 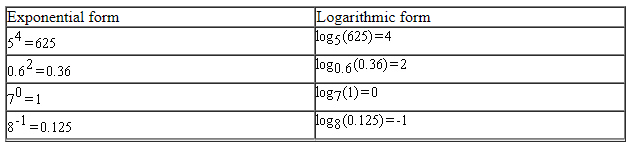
Question
Choose the logistic function that best approximates the given curve. 
A)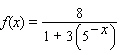
B)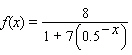
C)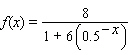
D)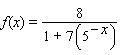
E)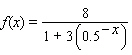
A)
B)
C)
D)
E)
Question
Question
The table below is filled correctly. Exponential form Logarithmic form 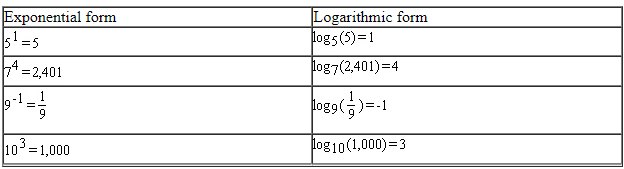
Question
The following graph shows the actual percentage of U.S. households with a computer as a function of household income (the data points)and a logistic model of these data (the curve). The logistic model is 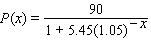 where
where  is the household income in thousands of dollars. For low incomes, the logistic model is approximately exponential. Which exponential model best approximates
  for small
  ? Round the coefficients to the nearest hundredth.
A)
B)
C)
D)
E)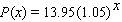
where is the household income in thousands of dollars. For low incomes, the logistic model is approximately exponential. Which exponential model best approximates for small ? Round the coefficients to the nearest hundredth. A)
B)
C)
D)
E)
Question
Find the logistic function  with the given properties.
  has limiting value 16 and passes through (0, 8)and (1, 14).
A)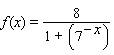
B)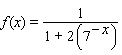
C)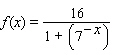
D)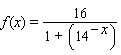
E)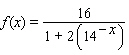
with the given properties. has limiting value 16 and passes through (0, 8)and (1, 14).A)
B)
C)
D)
E)
Question
The graph shows the actual percentage of U.S. households with a computer as a function of household income (the data points)and a logistic model of these data (the curve). The logistic model is 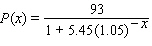 where
where  is the household income in thousands of dollars. According to the model, what percentage of extremely wealthy households had computers?
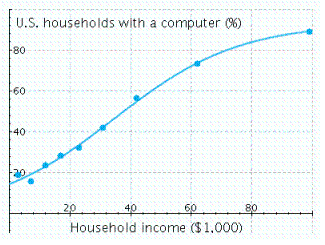
A) is close to
  .
.
B) is close to
  .
.
C) is close to
  .
.
D) is close to
  .
.
E) is close to
  .
.
where is the household income in thousands of dollars. According to the model, what percentage of extremely wealthy households had computers? A)
is close to .B)
is close to .C)
is close to .D)
is close to .E)
is close to . Question
Choose the logistic function that best approximates the given curve. 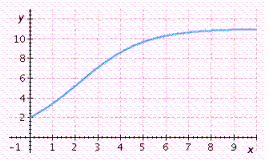
A)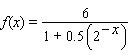
B)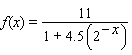
C)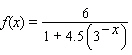
D)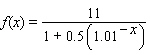
E)
A)
B)
C)
D)
E)
Question
Convert the exponential function to the form indicated. Round all coefficients to four significant digits. 
 = __________ k = __________
= __________ k = __________ Question
Find the logistic function  with the given properties.
  ,
,  has limiting value
  , and for small values of
  ,
,  is approximately exponential and grows by 50% with every increase of 1 in
  .
.
A)
B)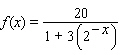
C)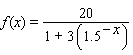
D)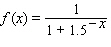
E)
with the given properties. , has limiting value , and for small values of , is approximately exponential and grows by 50% with every increase of 1 in .A)
B)
C)
D)
E)

Unlock Deck
Sign up to unlock the cards in this deck!
Unlock Deck
Unlock Deck
1/88
Play
Full screen (f)
Deck 2: Nonlinear Functions and Models
1
Suppose the amount of carbon dioxide (in pounds per 15,000 miles)released by a typical sport utility vehicle (SUV)depends on its fuel efficiency according to the formula where x is a fuel efficiency of an SUV in miles per gallon. According to the model, what is the fuel efficiency of an SUV that has the least carbon dioxide pollution?
A)10 miles per gallon
B)24 miles per gallon
C)6 miles per gallon
D)11 miles per gallon
E)21 miles per gallon
where x is a fuel efficiency of an SUV in miles per gallon. According to the model, what is the fuel efficiency of an SUV that has the least carbon dioxide pollution?A)10 miles per gallon
B)24 miles per gallon
C)6 miles per gallon
D)11 miles per gallon
E)21 miles per gallon
21 miles per gallon
2
Choose the logistic function that best approximates the curve.
A)
B)
C)
__________
A)
B)
C)
__________
3
Encouraged by the popularity of your Dungeons and Dragons website, www.mudbeast.net, you have decided to charge users who log on to the site. When you charged a $1.50 access fee, your web counter showed a demand of 160 "hits" per month. After you lowered the price to $1.00, activity increased to 410 hits per month. Obtain the monthly revenue R as a function of the access fee x .
A)
B)
C)
D)
E)
A)
B)
C)
D)
E)
4
For the following demand equation, find the largest possible revenue.
A)500
B)250,000
C)375,000
D)125,000
E)250
A)500
B)250,000
C)375,000
D)125,000
E)250
Unlock Deck
Unlock for access to all 88 flashcards in this deck.
Unlock Deck
k this deck
5
Choose the logistic function that best approximates the curve.
A)
B)
C)
__________
A)
B)
C)
__________
Unlock Deck
Unlock for access to all 88 flashcards in this deck.
Unlock Deck
k this deck
6
The Better Baby Buggy Co. has just come out with a new model, the Turbo. The market research department predicts that the demand equation for Turbos is given by where q is the number of buggies it can sell in one month if the price is $ x per buggy. At what price should it sell the buggies to get the largest revenue? Round the result to the nearest dollar.
A)
B)
C)
D)
E)
where q is the number of buggies it can sell in one month if the price is $ x per buggy. At what price should it sell the buggies to get the largest revenue? Round the result to the nearest dollar.A)
B)
C)
D)
E)
Unlock Deck
Unlock for access to all 88 flashcards in this deck.
Unlock Deck
k this deck
7
Match between columns
Unlock Deck
Unlock for access to all 88 flashcards in this deck.
Unlock Deck
k this deck
8
For the following demand equation, express the total revenue R as a function of the price p per item.
A)
B)
C)
D)
E)
A)
B)
C)
D)
E)
Unlock Deck
Unlock for access to all 88 flashcards in this deck.
Unlock Deck
k this deck
9
Pack-Em-In Real Estate is building a new housing development. The more houses it builds, the less people will be willing to pay, due to the crowding and smaller lot sizes. In fact, if the company builds 50 houses in this particular development, it can sell them for $200,000 each, but if it builds 70 houses, it will be able to get only $180,000 each. What is the largest possible revenue the company can get? $ __________
Unlock Deck
Unlock for access to all 88 flashcards in this deck.
Unlock Deck
k this deck
10
The market research department of the Better Baby Buggy Co. predicts that the demand equation for its buggies is given by where q is the number of buggies it can sell in a month if the price is $ x per buggy. What is the largest monthly revenue?
A)
B)
C)
D)
E)
where q is the number of buggies it can sell in a month if the price is $ x per buggy. What is the largest monthly revenue?A)
B)
C)
D)
E)
Unlock Deck
Unlock for access to all 88 flashcards in this deck.
Unlock Deck
k this deck
11
For the following demand equation, find the largest possible revenue. $ __________
$ __________ Unlock Deck
Unlock for access to all 88 flashcards in this deck.
Unlock Deck
k this deck
12
The following chart shows the value of trade between two countries for the period 1994-2004 ( represents 1994). Which of the following models best approximates the data given? (Try to answer this without actually computing values.)
A)
B)
C)
D)
E)
represents 1994). Which of the following models best approximates the data given? (Try to answer this without actually computing values.)A)
B)
C)
D)
E)
Unlock Deck
Unlock for access to all 88 flashcards in this deck.
Unlock Deck
k this deck
13
For the following demand equation, find the largest possible revenue.
A)
B)
C)
D)
E)
A)
B)
C)
D)
E)
Unlock Deck
Unlock for access to all 88 flashcards in this deck.
Unlock Deck
k this deck
14
You are the sales manager for Montevideo Productions, Inc., and you are planning to review the prices you charge clients for television advertisement development. You currently charge each client an hourly development fee of $2,000. With this pricing structure, the demand, measured by the number of contracts Montevideo signs per month, is 25 contracts. This is down 10 contracts from the figure last year, when your company charged only $1,000. Construct a linear demand equation giving the number of contracts q as a function of the hourly fee p Montevideo Productions, Inc., charges for development.
A)
B)
C)
D)
E)
A)
B)
C)
D)
E)
Unlock Deck
Unlock for access to all 88 flashcards in this deck.
Unlock Deck
k this deck
15
The fuel efficiency (in miles per gallon)of a sport utility vehicle (SUV)depends on its weight according to the formula where x is the weight of an SUV in pounds. According to the model, what is the weight of the least fuel-efficient SUV?
A)6,000 pounds
B)3,000 pounds
C)3,100 pounds
D)2,000 pounds
E)326 pounds
where x is the weight of an SUV in pounds. According to the model, what is the weight of the least fuel-efficient SUV?A)6,000 pounds
B)3,000 pounds
C)3,100 pounds
D)2,000 pounds
E)326 pounds
Unlock Deck
Unlock for access to all 88 flashcards in this deck.
Unlock Deck
k this deck
16
Find the y -intercept(s)of the graph of the quadratic function.
A)
B)
C)
D) ,
E) ,
A)
B)
C)
D)
, E)
, Unlock Deck
Unlock for access to all 88 flashcards in this deck.
Unlock Deck
k this deck
17
The two fraternities Sigma Alpha Mu and Ep Sig plan to raise money jointly to benefit homeless people on Long Island. They will sell Starship Troopers T-shirts in the Student Center, but they are not sure how much to charge. Sigma Alpha Mu treasurer Solo recalls that they once sold 200 shirts in a week at $8 each, but Ep Sig treasurer Justino claims that, based on past experience, they can sell 500 per week if they charge $4 each. The university administration charges the fraternities $300 per week for use of the Student Center. What is the largest possible weekly profit, rounded to the nearest dollar?
A)$1,833
B)$533
C)$2,133
D)$800
E)$4,267
A)$1,833
B)$533
C)$2,133
D)$800
E)$4,267
Unlock Deck
Unlock for access to all 88 flashcards in this deck.
Unlock Deck
k this deck
18
Pack-Em-In Real Estate is building a new housing development. The more houses it builds, the less people will be willing to pay, due to the crowding and smaller lot sizes. In fact, if the company builds 60 houses in this particular development, it can sell them for $180,000 each, but if it builds 70 houses, it will be able to get only $170,000 each. What is the largest possible revenue the company can get?
A)
B)
C)
D)
E)
A)
B)
C)
D)
E)
Unlock Deck
Unlock for access to all 88 flashcards in this deck.
Unlock Deck
k this deck
19
You have just opened a new nightclub, Russ's Techno Pitstop, but you are unsure how much to charge for the cover charge (entrance fee). One week you charged $7 cover per guest and averaged 339 guests per night. The next week you charged $16 per guest and averaged 222 guests per night. Find the linear demand equation showing the number of guests q per night as a function of the cover charge p .
A)
B)
C)
D)
E)
A)
B)
C)
D)
E)
Unlock Deck
Unlock for access to all 88 flashcards in this deck.
Unlock Deck
k this deck
20
Find the vertex of the graph of the quadratic function.
A)
B)
C)
D)
E)
A)
B)
C)
D)
E)
Unlock Deck
Unlock for access to all 88 flashcards in this deck.
Unlock Deck
k this deck
21
The given table corresponds to the function .
. Unlock Deck
Unlock for access to all 88 flashcards in this deck.
Unlock Deck
k this deck
22
Model the data using an exponential function .
. Unlock Deck
Unlock for access to all 88 flashcards in this deck.
Unlock Deck
k this deck
23
Model the data using an exponential function . Select the correct answer.
A)
B)
C)
D)
E)
. Select the correct answer.A)
B)
C)
D)
E)
Unlock Deck
Unlock for access to all 88 flashcards in this deck.
Unlock Deck
k this deck
24
Find an equation for exponential function that passes through the pair of points and . ( )
A)
B)
C)
D)
E)
and . ( )A)
B)
C)
D)
E)
Unlock Deck
Unlock for access to all 88 flashcards in this deck.
Unlock Deck
k this deck
25
Which of the following three functions will be largest for large values of x ? Select the correct answer.
A)
B)
C)
D)
E)
A)
B)
C)
D)
E)
Unlock Deck
Unlock for access to all 88 flashcards in this deck.
Unlock Deck
k this deck
26
The given table corresponds to the function .
. Unlock Deck
Unlock for access to all 88 flashcards in this deck.
Unlock Deck
k this deck
27
The given table corresponds to the function .
. Unlock Deck
Unlock for access to all 88 flashcards in this deck.
Unlock Deck
k this deck
28
Model the data using an exponential function .
. Unlock Deck
Unlock for access to all 88 flashcards in this deck.
Unlock Deck
k this deck
29
Given the graph of the functions and . Identify which graph corresponds to . Select the correct answer.
A)Red
B)Blue
and . Identify which graph corresponds to . Select the correct answer.A)Red
B)Blue
Unlock Deck
Unlock for access to all 88 flashcards in this deck.
Unlock Deck
k this deck
30
Soon after taking an aspirin, a patient has absorbed 330 mg of the drug. If the amount of aspirin in the bloodstream decays exponentially with half being removed every 3 hours, find the amount of aspirin in the bloodstream after 7 hours. Select the correct answer.
A)654.8
B)6548
C)128.13
D)25.42
E)65.48
A)654.8
B)6548
C)128.13
D)25.42
E)65.48
Unlock Deck
Unlock for access to all 88 flashcards in this deck.
Unlock Deck
k this deck
31
Find the equation for the exponential function that passes through the pair of points and . ( )A = __________ b = __________
and . ( )A = __________ b = __________ Unlock Deck
Unlock for access to all 88 flashcards in this deck.
Unlock Deck
k this deck
32
Which of the following three functions will be smallest for large values of x ? Select the correct answer.
A)
B)
C)
D)
E)
A)
B)
C)
D)
E)
Unlock Deck
Unlock for access to all 88 flashcards in this deck.
Unlock Deck
k this deck
33
Graph the function. Select the correct answer.
A)
B)
C)
D)
Select the correct answer.A)
B)
C)
D)
Unlock Deck
Unlock for access to all 88 flashcards in this deck.
Unlock Deck
k this deck
34
Given the graph of the functions and . Determine the color of the graph that corresponds to . Select the correct answer.
A)Blue
B)Red
and . Determine the color of the graph that corresponds to . Select the correct answer.A)Blue
B)Red
Unlock Deck
Unlock for access to all 88 flashcards in this deck.
Unlock Deck
k this deck
35
Model the data using an exponential function .
. Unlock Deck
Unlock for access to all 88 flashcards in this deck.
Unlock Deck
k this deck
36
Rock Solid Bank & Trust is offering a CD that pays 5% compounded continuously. How much interest would a $5,000 deposit earn over 15 years? (Round your answer to the nearest dollar.)Select the correct answer.
A)$5,585
B)$15,585
C)$10,395
D)$10,569
E)$10,585
A)$5,585
B)$15,585
C)$10,395
D)$10,569
E)$10,585
Unlock Deck
Unlock for access to all 88 flashcards in this deck.
Unlock Deck
k this deck
37
Model the data using an exponential function . Select the correct answer.
A)
B)
C)
D)
E)
. Select the correct answer.A)
B)
C)
D)
E)
Unlock Deck
Unlock for access to all 88 flashcards in this deck.
Unlock Deck
k this deck
38
Model the data using an exponential function . Select the correct answer.
A)
B)
C)
D)
E)
. Select the correct answer.A)
B)
C)
D)
E)
Unlock Deck
Unlock for access to all 88 flashcards in this deck.
Unlock Deck
k this deck
39
The U.S. population was 180 million in 1960 and 240 million in 1990. Assuming exponential population growth, what will the population be in the year 2020? Round your answer to the nearest million. __________ million
Unlock Deck
Unlock for access to all 88 flashcards in this deck.
Unlock Deck
k this deck
40
The U.S. population was 180 million in 1965 and 240 million in 1995. Assuming exponential population growth, what will the population be in the year 2010? Select the correct answer.
A)270 million
B)539 million
C)250 million
D)277 million
E)1,078 million
A)270 million
B)539 million
C)250 million
D)277 million
E)1,078 million
Unlock Deck
Unlock for access to all 88 flashcards in this deck.
Unlock Deck
k this deck
41
Soon after taking an aspirin, a patient has absorbed 350 mg of the drug. If the amount of aspirin in the bloodstream decays exponentially, with half being removed every 2 hours, find the time it will take for the amount of aspirin in the bloodstream to decrease to 290 mg. Select the answer rounded to three decimal places.
A)1.843 hours
B)5.529 hours
C)0.921 hours
D)4.607 hours
E)3.686 hours
A)1.843 hours
B)5.529 hours
C)0.921 hours
D)4.607 hours
E)3.686 hours
Unlock Deck
Unlock for access to all 88 flashcards in this deck.
Unlock Deck
k this deck
42
Plutonium-239 is used as a fuel for some nuclear reactors and also as the fissionable material in atomic bombs. It has a half-life of 24,400 years. How long will it take 14 grams of plutonium-239 to decay to 1 grams? Select the correct answer rounded to the nearest integer.
A)23,250 years
B)93,000 years
C)92,900 years
D)185,800 years
E)46,500 years
A)23,250 years
B)93,000 years
C)92,900 years
D)185,800 years
E)46,500 years
Unlock Deck
Unlock for access to all 88 flashcards in this deck.
Unlock Deck
k this deck
43
The given table corresponds to the function .
. Unlock Deck
Unlock for access to all 88 flashcards in this deck.
Unlock Deck
k this deck
44
Use logarithms to solve the equation. (Round answers to four decimal places.)
A)
B)
C)
D)
E)
A)
B)
C)
D)
E)
Unlock Deck
Unlock for access to all 88 flashcards in this deck.
Unlock Deck
k this deck
45
Use logarithms to solve the equation. (Round answers to four decimal places.) x = __________
x = __________ Unlock Deck
Unlock for access to all 88 flashcards in this deck.
Unlock Deck
k this deck
46
Graph the function.
A)
B)
C)
D)
E)
A)
B)
C)
D)
E)
Unlock Deck
Unlock for access to all 88 flashcards in this deck.
Unlock Deck
k this deck
47
How long will it take an investment to triple if it is continuously compounded at 15% per year? Select the correct answer rounded to the nearest year.
A)4 years
B)13 years
C)7 years
D)15 years
E)8 years
A)4 years
B)13 years
C)7 years
D)15 years
E)8 years
Unlock Deck
Unlock for access to all 88 flashcards in this deck.
Unlock Deck
k this deck
48
The given table corresponds to the function .
. Unlock Deck
Unlock for access to all 88 flashcards in this deck.
Unlock Deck
k this deck
49
You are trying to determine the half-life of a new radioactive element you have isolated. You start with 3 grams, and 4 days later you determine that it has decayed down to 0.1 gram. What is the half-life? Round your answer to three decimal places. Select the answer rounded to three decimal places.
A)0.815 days
B)1.630 days
C)0.408 days
D)2.446 days
E)1.223 days
A)0.815 days
B)1.630 days
C)0.408 days
D)2.446 days
E)1.223 days
Unlock Deck
Unlock for access to all 88 flashcards in this deck.
Unlock Deck
k this deck
50
Graph the function.
A)
B)
C)
D)
E)
A)
B)
C)
D)
E)
Unlock Deck
Unlock for access to all 88 flashcards in this deck.
Unlock Deck
k this deck
51
How long, to the nearest year, will it take an investment in Japan to double its value if the interest is compounded every six months? Please round the answer to the nearest year. Country U.S. Japan Canada Korea Australia Yield 5.3% 1.5% 5.2% 5.4% 6.0%
A)47 years
B)46 years
C)42 years
D)51 years
E)43 years
A)47 years
B)46 years
C)42 years
D)51 years
E)43 years
Unlock Deck
Unlock for access to all 88 flashcards in this deck.
Unlock Deck
k this deck
52
The table lists interest rates on long-term investments (based on 10-year government bonds)in several countries in 2004-2005. Assuming that you invest $11,000 in Japan, how long (to the nearest year)must you wait before your investment is worth $17,000 if the interest is compounded annually? Country U.S. Japan Canada Yield 5.3% 1.5% 5.2%
A)29 years
B)24 years
C)25 years
D)32 years
E)30 years
A)29 years
B)24 years
C)25 years
D)32 years
E)30 years
Unlock Deck
Unlock for access to all 88 flashcards in this deck.
Unlock Deck
k this deck
53
Find the associated exponential decay model. when ; Half-life
A)
B)
C)
D)
E)
when ; Half-life A)
B)
C)
D)
E)
Unlock Deck
Unlock for access to all 88 flashcards in this deck.
Unlock Deck
k this deck
54
Find the associated doubling time.
A)
B)
C)
D)
E)
A)
B)
C)
D)
E)
Unlock Deck
Unlock for access to all 88 flashcards in this deck.
Unlock Deck
k this deck
55
How long, to the nearest year, will it take an investment to triple if it is continuously compounded at 20% per year? Round the answers to the nearest year. __________ years
Unlock Deck
Unlock for access to all 88 flashcards in this deck.
Unlock Deck
k this deck
56
The given table corresponds to the function .
. Unlock Deck
Unlock for access to all 88 flashcards in this deck.
Unlock Deck
k this deck
57
Convert the exponential function to the form indicated. Round all coefficients to four significant digits.
A)
B)
C)
D)
E)
A)
B)
C)
D)
E)
Unlock Deck
Unlock for access to all 88 flashcards in this deck.
Unlock Deck
k this deck
58
The amount of carbon-14 remaining in a sample that weighs A is given by where t is time in years. If tests on a fossilized skull reveal that 99.97% of the carbon-14 has decayed, how old is the skull? Select the correct answer rounded to the nearest integer.
A)2,629 years old
B)23,234 years old
C)0 years old
D)1,985 years old
E)28,978 years old
where t is time in years. If tests on a fossilized skull reveal that 99.97% of the carbon-14 has decayed, how old is the skull? Select the correct answer rounded to the nearest integer.A)2,629 years old
B)23,234 years old
C)0 years old
D)1,985 years old
E)28,978 years old
Unlock Deck
Unlock for access to all 88 flashcards in this deck.
Unlock Deck
k this deck
59
Convert the exponential function to the form indicated. Round all coefficients to four significant digits.
A)
B)
C)
D)
E)
A)
B)
C)
D)
E)
Unlock Deck
Unlock for access to all 88 flashcards in this deck.
Unlock Deck
k this deck
60
Use logarithms to solve the equation. (Round answers to four decimal places.)
A)
B)
C)
D)
E)
A)
B)
C)
D)
E)
Unlock Deck
Unlock for access to all 88 flashcards in this deck.
Unlock Deck
k this deck
61
The table lists interest rates on long-term investments (based on 10-year government bonds)in several countries in 2004-2005. Assuming that you invest $13,000 in Japan, how long (to the nearest year)must you wait before your investment is worth $19,000 if the interest is compounded annually? Country U.S. Japan Canada Yield 5.3% 1.5% 5.2% __________ year(s)
Unlock Deck
Unlock for access to all 88 flashcards in this deck.
Unlock Deck
k this deck
62
The table is filled correctly. Exponential form Logarithmic form
Unlock Deck
Unlock for access to all 88 flashcards in this deck.
Unlock Deck
k this deck
63
Plutonium-239 is used as a fuel for some nuclear reactors and also as the fissionable material in atomic bombs. It has a half-life of 24400 years. How long will it take 20 grams of plutonium-239 to decay to 3 grams? Round your answer to the nearest year. __________ years
Unlock Deck
Unlock for access to all 88 flashcards in this deck.
Unlock Deck
k this deck
64
Find the logistic function with the given properties. , has limiting value , and for small values of , is approximately exponential and doubles with every increase of 1 in .
A)
B)
C)
D)
E)
with the given properties. , has limiting value , and for small values of , is approximately exponential and doubles with every increase of 1 in .A)
B)
C)
D)
E)
Unlock Deck
Unlock for access to all 88 flashcards in this deck.
Unlock Deck
k this deck
65
Find the associated exponential decay model. when ; Half-life =
when ; Half-life = Unlock Deck
Unlock for access to all 88 flashcards in this deck.
Unlock Deck
k this deck
66
Choose the logistic function that best approximates the curve.
A)
B)
C)
D)
E)
A)
B)
C)
D)
E)
Unlock Deck
Unlock for access to all 88 flashcards in this deck.
Unlock Deck
k this deck
67
Find the logistic function with the given properties. has limiting value 8 and passes through (0, 2)and (1, 6).
A)
B)
C)
D)
E)
with the given properties. has limiting value 8 and passes through (0, 2)and (1, 6).A)
B)
C)
D)
E)
Unlock Deck
Unlock for access to all 88 flashcards in this deck.
Unlock Deck
k this deck
68
Find N , A , and b for the function given.
A)
B)
C)
D)
E)
A)
B)
C)
D)
E)
Unlock Deck
Unlock for access to all 88 flashcards in this deck.
Unlock Deck
k this deck
69
Find N , A , and b for the function.
A)
B)
C)
D)
E)
A)
B)
C)
D)
E)
Unlock Deck
Unlock for access to all 88 flashcards in this deck.
Unlock Deck
k this deck
70
The chart shows the number of research articles in the prominent journal Physics Review that were written by researchers in Europe during 1983-2003 ( represents 1983). Which of the following logistic functions best models the data? ( is the number of years since 1983.)Try to determine the correct model without actually computing data points.
A)
B)
C)
D)
E)
represents 1983). Which of the following logistic functions best models the data? ( is the number of years since 1983.)Try to determine the correct model without actually computing data points.A)
B)
C)
D)
E)
Unlock Deck
Unlock for access to all 88 flashcards in this deck.
Unlock Deck
k this deck
71
The table below is filled correctly. Exponential form Logarithmic form
Unlock Deck
Unlock for access to all 88 flashcards in this deck.
Unlock Deck
k this deck
72
Choose the logistic function that best approximates the given curve.
A)
B)
C)
D)
E)
A)
B)
C)
D)
E)
Unlock Deck
Unlock for access to all 88 flashcards in this deck.
Unlock Deck
k this deck
73
How long, to the nearest year, will it take an investment in Canada to double its value if the interest is compounded every six months? Please round the answer to the nearest year. Country U.S. Japan Canada Korea Australia Yield 5.3% 1.5% 5.2% 5.4% 6.0% t = __________ year(s)
Unlock Deck
Unlock for access to all 88 flashcards in this deck.
Unlock Deck
k this deck
74
The table below is filled correctly. Exponential form Logarithmic form
Unlock Deck
Unlock for access to all 88 flashcards in this deck.
Unlock Deck
k this deck
75
The following graph shows the actual percentage of U.S. households with a computer as a function of household income (the data points)and a logistic model of these data (the curve). The logistic model is where is the household income in thousands of dollars. For low incomes, the logistic model is approximately exponential. Which exponential model best approximates for small ? Round the coefficients to the nearest hundredth.
A)
B)
C)
D)
E)
where is the household income in thousands of dollars. For low incomes, the logistic model is approximately exponential. Which exponential model best approximates for small ? Round the coefficients to the nearest hundredth. A)
B)
C)
D)
E)
Unlock Deck
Unlock for access to all 88 flashcards in this deck.
Unlock Deck
k this deck
76
Find the logistic function with the given properties. has limiting value 16 and passes through (0, 8)and (1, 14).
A)
B)
C)
D)
E)
with the given properties. has limiting value 16 and passes through (0, 8)and (1, 14).A)
B)
C)
D)
E)
Unlock Deck
Unlock for access to all 88 flashcards in this deck.
Unlock Deck
k this deck
77
The graph shows the actual percentage of U.S. households with a computer as a function of household income (the data points)and a logistic model of these data (the curve). The logistic model is where is the household income in thousands of dollars. According to the model, what percentage of extremely wealthy households had computers?
A) is close to .
B) is close to .
C) is close to .
D) is close to .
E) is close to .
where is the household income in thousands of dollars. According to the model, what percentage of extremely wealthy households had computers? A)
is close to .B)
is close to .C)
is close to .D)
is close to .E)
is close to . Unlock Deck
Unlock for access to all 88 flashcards in this deck.
Unlock Deck
k this deck
78
Choose the logistic function that best approximates the given curve.
A)
B)
C)
D)
E)
A)
B)
C)
D)
E)
Unlock Deck
Unlock for access to all 88 flashcards in this deck.
Unlock Deck
k this deck
79
Convert the exponential function to the form indicated. Round all coefficients to four significant digits. = __________ k = __________
= __________ k = __________ Unlock Deck
Unlock for access to all 88 flashcards in this deck.
Unlock Deck
k this deck
80
Find the logistic function with the given properties. , has limiting value , and for small values of , is approximately exponential and grows by 50% with every increase of 1 in .
A)
B)
C)
D)
E)
with the given properties. , has limiting value , and for small values of , is approximately exponential and grows by 50% with every increase of 1 in .A)
B)
C)
D)
E)
Unlock Deck
Unlock for access to all 88 flashcards in this deck.
Unlock Deck
k this deck
Unlock Deck
Unlock for access to all 88 flashcards in this deck.


