Exam 2: Nonlinear Functions and Models
Exam 1: Functions and Linear Models100 Questions
Exam 2: Nonlinear Functions and Models88 Questions
Exam 3: Introduction to the Derivative140 Questions
Exam 4: Techniques of Differentiation With Applications106 Questions
Exam 5: Further Applications of the Derivative85 Questions
Exam 6: The Integral71 Questions
Exam 7: Further Integration Techniques and Applications of the Integral117 Questions
Exam 8: Functions of Several Variables133 Questions
Exam 9: Trigonometric Models66 Questions
Select questions type
The fuel efficiency (in miles per gallon)of a sport utility vehicle (SUV)depends on its weight according to the formula 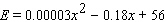 where x is the weight of an SUV in pounds. According to the model, what is the weight of the least fuel-efficient SUV?
Free
(Multiple Choice)
4.8/5  (30)
(30)
Correct Answer: Verified
B
How long will it take an investment to triple if it is continuously compounded at 15% per year? Select the correct answer rounded to the nearest year.
Free
(Multiple Choice)
4.8/5 (38)
Correct Answer:Verified
C
The table lists interest rates on long-term investments (based on 10-year government bonds)in several countries in 2004-2005. Assuming that you invest $13,000 in Japan, how long (to the nearest year)must you wait before your investment is worth $19,000 if the interest is compounded annually? Country U.S. Japan Canada Yield 5.3% 1.5% 5.2% __________ year(s)
Free
(Short Answer)
4.9/5 (30)
Correct Answer:Verified
25
The amount of carbon-14 remaining in a sample that weighs A is given by 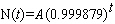 where t is time in years. If tests on a fossilized skull reveal that 99.97% of the carbon-14 has decayed, how old is the skull? Select the correct answer rounded to the nearest integer.
(Multiple Choice)
4.9/5 (31)
Given the graph of the functions  and
and  . Determine the color of the graph that corresponds to
  .
. 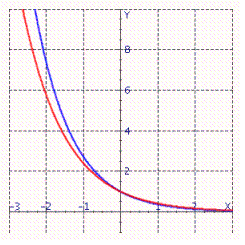 Select the correct answer.
(Multiple Choice)
4.8/5 (33)
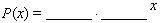
The graph shows the actual percentage of U.S. households with a computer as a function of household income (the data points)and a logistic model of these data (the curve). The logistic model is 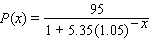 where
where  is the household income in thousands of dollars. According to the model, what percentage of extremely wealthy households had computers?
 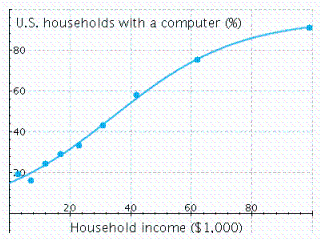 P = __________%
(Short Answer)
4.8/5 (33)
Soon after taking an aspirin, a patient has absorbed 350 mg of the drug. If the amount of aspirin in the bloodstream decays exponentially, with half being removed every 2 hours, find the time it will take for the amount of aspirin in the bloodstream to decrease to 290 mg. Select the answer rounded to three decimal places.
(Multiple Choice)
4.8/5 (33)
Plutonium-239 is used as a fuel for some nuclear reactors and also as the fissionable material in atomic bombs. It has a half-life of 24,400 years. How long will it take 14 grams of plutonium-239 to decay to 1 grams? Select the correct answer rounded to the nearest integer.
(Multiple Choice)
4.8/5 (40)
Choose the logistic function that best approximates the curve. 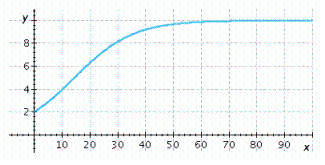
(Multiple Choice)
4.9/5 (31)
Choose the logistic function that best approximates the curve. 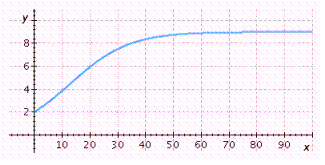
(Multiple Choice)
4.8/5 (35)
Find the logistic function  with the given properties.
  ,
,  has limiting value
  , and for small values of
  ,
,  is approximately exponential and doubles with every increase of 1 in
  .
.
(Multiple Choice)
4.8/5 (30)
For the following demand equation, express the total revenue R as a function of the price p per item. 
(Multiple Choice)
4.8/5 (35)
For the following demand equation, find the largest possible revenue.  $ __________
(Short Answer)
4.8/5 (33)
Which of the following three functions will be smallest for large values of x ? Select the correct answer.
(Multiple Choice)
4.7/5 (36)
The following graph shows the actual percentage of U.S. households with a computer as a function of household income (the data points)and a logistic model of these data (the curve). The logistic model is 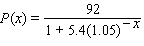 where
where  is the household income in thousands of dollars. For low incomes, the logistic model is approximately exponential. Which exponential model best approximates
  for small
  ? Round the coefficients to the nearest hundredth.
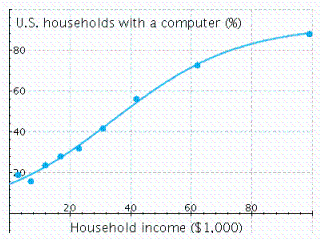
(Short Answer)
4.8/5 (29)
Pack-Em-In Real Estate is building a new housing development. The more houses it builds, the less people will be willing to pay, due to the crowding and smaller lot sizes. In fact, if the company builds 60 houses in this particular development, it can sell them for $180,000 each, but if it builds 70 houses, it will be able to get only $170,000 each. What is the largest possible revenue the company can get?
(Multiple Choice)
4.8/5 (30)
Model the data using an exponential function  .
. 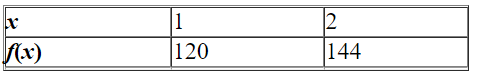 Select the correct answer.
(Multiple Choice)
4.9/5 (36)
Filters
- Essay(0)
- Multiple Choice(0)
- Short Answer(0)
- True False(0)
- Matching(0)