Deck 5: Data Organization and Descriptive Statistics
Full screen (f)
Question
Question
Question
Question
Question
Question
Question
Question
Question
Question
Question
Question
Question
Question
Question
Question
Question
Question
Question
Question
Question
Question
Question
Question
Question
Question
Question
Question
Question
Question
Question
Question
Question
Question
Question
Question
Question
Question
Question
Question
Question
Question
Question
Tom, Tina, & Tori took a verbal aptitude test. The test was normally distributed with a mean of 70 and s = 15. Complete the following table.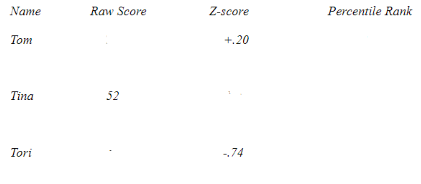
Question
Question

Unlock Deck
Sign up to unlock the cards in this deck!
Unlock Deck
Unlock Deck
1/45
Play
Full screen (f)
Deck 5: Data Organization and Descriptive Statistics
1
A table in which the scores are grouped into intervals and listed along with the frequency of scores in each interval is a _____.
A)bar graph
B)histogram
C)class interval frequency distribution
D)class interval frequency polygon
A)bar graph
B)histogram
C)class interval frequency distribution
D)class interval frequency polygon
class interval frequency distribution
2
A distribution can have more than one ____ but can have only one _____.
A)median; mode or mean
B)mean; mode or median
C)mode; median or mean
D)median or mode; mean
A)median; mode or mean
B)mean; mode or median
C)mode; median or mean
D)median or mode; mean
mode; median or mean
3
_____ is to organizing data using a table as _____ is to organizing data using a figure.
A)Histogram; bar graph
B)Frequency polygon; bar graph
C)Frequency distribution; histogram
D)Frequency polygon; frequency distribution
A)Histogram; bar graph
B)Frequency polygon; bar graph
C)Frequency distribution; histogram
D)Frequency polygon; frequency distribution
Frequency distribution; histogram
4
A number that characterizes the "middleness" of an entire distribution is _____.
A)a measure of central tendency
B)a measure of variability
C)an inferential statistic
D)the standard deviation
A)a measure of central tendency
B)a measure of variability
C)an inferential statistic
D)the standard deviation
Unlock Deck
Unlock for access to all 45 flashcards in this deck.
Unlock Deck
k this deck
5
A line graph of the frequencies of individual scores is a _____.
A)histogram
B)frequency distribution
C)frequency polygon
D)bar graph
A)histogram
B)frequency distribution
C)frequency polygon
D)bar graph
Unlock Deck
Unlock for access to all 45 flashcards in this deck.
Unlock Deck
k this deck
6
A graphical representation of a frequency distribution in which vertical bars are centered above each category along the x-axis and are separated from each other by a space is a _____.
A)histogram
B)bar graph
C)pie graph
D)frequency polygon
A)histogram
B)bar graph
C)pie graph
D)frequency polygon
Unlock Deck
Unlock for access to all 45 flashcards in this deck.
Unlock Deck
k this deck
7
The arithmetic average of a distribution is the _____.
A)mean
B)median
C)mode
D)standard deviation
A)mean
B)median
C)mode
D)standard deviation
Unlock Deck
Unlock for access to all 45 flashcards in this deck.
Unlock Deck
k this deck
8
Mode is to _____ and median is to _____.
A)interval and ratio data only; nominal data only
B)nominal data only; ordinal data only
C)all types of data; ordinal, interval, and ratio data only
D)none of the options is correct
A)interval and ratio data only; nominal data only
B)nominal data only; ordinal data only
C)all types of data; ordinal, interval, and ratio data only
D)none of the options is correct
Unlock Deck
Unlock for access to all 45 flashcards in this deck.
Unlock Deck
k this deck
9
Qualitative variable is to quantitative variable as ____ is to _____.
A)categorical variable; numerical variable
B)numerical variable; categorical variable
C)ordinal, interval, or ratio data; nominal data
D)categorical variable and ordinal, interval, or ratio data; numerical variable and nominal data
A)categorical variable; numerical variable
B)numerical variable; categorical variable
C)ordinal, interval, or ratio data; nominal data
D)categorical variable and ordinal, interval, or ratio data; numerical variable and nominal data
Unlock Deck
Unlock for access to all 45 flashcards in this deck.
Unlock Deck
k this deck
10
A table in which all of the scores are listed along with the frequency with which each occurs is a _____.
A)bar graph
B)histogram
C)frequency polygon
D)frequency distribution
A)bar graph
B)histogram
C)frequency polygon
D)frequency distribution
Unlock Deck
Unlock for access to all 45 flashcards in this deck.
Unlock Deck
k this deck
11
A categorical variable for which each value represents a discrete category is a _____ variable.
A)qualitative
B)quantitative
C)continuous
D)class interval
A)qualitative
B)quantitative
C)continuous
D)class interval
Unlock Deck
Unlock for access to all 45 flashcards in this deck.
Unlock Deck
k this deck
12
When Ms. Jones calculated her students' accounting test scores, she noticed that one student had an extremely low score. Which measure of central tendency should not be used in this situation?
A)mean
B)standard deviation
C)mode
D)median
A)mean
B)standard deviation
C)mode
D)median
Unlock Deck
Unlock for access to all 45 flashcards in this deck.
Unlock Deck
k this deck
13
Arithmetic average is to _____ as score occurring with the greatest frequency is to _____.
A)mean; median
B)median; mode
C)mean; mode
D)mode; median
A)mean; median
B)median; mode
C)mean; mode
D)mode; median
Unlock Deck
Unlock for access to all 45 flashcards in this deck.
Unlock Deck
k this deck
14
During the past year, Cindy and Bobby each read 2 books, but Greg read 25, Jan read 12, and Marcia read 9. The median number of books read by these individuals was
A)2.
B)9.
C)10.
D)50.
A)2.
B)9.
C)10.
D)50.
Unlock Deck
Unlock for access to all 45 flashcards in this deck.
Unlock Deck
k this deck
15
A graphical representation of a frequency distribution in which vertical bars centered above scores on the x-axis touch each other is a _____.
A)histogram
B)bar graph
C)pie graph
D)frequency polygon
A)histogram
B)bar graph
C)pie graph
D)frequency polygon
Unlock Deck
Unlock for access to all 45 flashcards in this deck.
Unlock Deck
k this deck
16
Bar graphs are to _____ as frequency polygons are to _____.
A)quantitative variables; qualitative variables
B)qualitative variables; quantitative variables
C)continuous data; discrete data
D)quantitative variables and continuous data; qualitative variables and discrete data
A)quantitative variables; qualitative variables
B)qualitative variables; quantitative variables
C)continuous data; discrete data
D)quantitative variables and continuous data; qualitative variables and discrete data
Unlock Deck
Unlock for access to all 45 flashcards in this deck.
Unlock Deck
k this deck
17
The middle score in a distribution after the scores have been arranged from highest to lowest or lowest to highest is the _____.
A)mean
B)median
C)mode
D)standard deviation
A)mean
B)median
C)mode
D)standard deviation
Unlock Deck
Unlock for access to all 45 flashcards in this deck.
Unlock Deck
k this deck
18
Imagine that 86,999 people who are penniless live in Centerville. Bill Gates, whose net worth is $87,000,000,000, moves to Centerville. Now the mean net worth in this town is _____ and the median net worth is _____.
A)0; 0
B)0; $1,000,000
C)$1,000,000; 0
D)$1,000,000; $1,000,000
A)0; 0
B)0; $1,000,000
C)$1,000,000; 0
D)$1,000,000; $1,000,000
Unlock Deck
Unlock for access to all 45 flashcards in this deck.
Unlock Deck
k this deck
19
A variable for which the scores represent a change in quantity is a _____ variable.
A)qualitative
B)quantitative
C)class interval
D)nominal
A)qualitative
B)quantitative
C)class interval
D)nominal
Unlock Deck
Unlock for access to all 45 flashcards in this deck.
Unlock Deck
k this deck
20
Seven students reported the following individual earnings from their sale of wrapping paper: $7, $13, $3, $5, $2, $9, and $3. In this distribution of individual earnings, the mean is _____ the mode and _____ the median.
A)equal to; equal to
B)greater than; equal to
C)equal to; less than
D)greater than; greater than
A)equal to; equal to
B)greater than; equal to
C)equal to; less than
D)greater than; greater than
Unlock Deck
Unlock for access to all 45 flashcards in this deck.
Unlock Deck
k this deck
21
If Joe scored 25 on a test with a mean of 20 and a standard deviation of 5 what is his z-score?
A)25
B)+1.0
C)0.0
D)cannot be determined
A)25
B)+1.0
C)0.0
D)cannot be determined
Unlock Deck
Unlock for access to all 45 flashcards in this deck.
Unlock Deck
k this deck
22
Faculty in the psychology department at State University consume an average of 5 cups of coffee per day with a standard deviation of 1.5. The distribution is normal. What proportion of faculty consumes an amount between 4 and 6 cups?
A)0.5468
B)0.4972
C)0.50
D)none of the options is correct
A)0.5468
B)0.4972
C)0.50
D)none of the options is correct
Unlock Deck
Unlock for access to all 45 flashcards in this deck.
Unlock Deck
k this deck
23
Draw the frequency polygon for the following distribution (there are 30 scores in the distribution). In addition, calculate the mean, median, and mode for the distribution.
48, 50, 53, 59, 59, 63, 63, 67, 67, 67, 72, 72, 72, 78, 78, 78, 78, 85, 85, 85, 85, 85, 90, 90, 90, 90, 95, 95, 98, 100
48, 50, 53, 59, 59, 63, 63, 67, 67, 67, 72, 72, 72, 78, 78, 78, 78, 85, 85, 85, 85, 85, 90, 90, 90, 90, 95, 95, 98, 100
Unlock Deck
Unlock for access to all 45 flashcards in this deck.
Unlock Deck
k this deck
24
Explain the difference in proper use between a bar graph and a histogram.
Unlock Deck
Unlock for access to all 45 flashcards in this deck.
Unlock Deck
k this deck
25
A z-score is most affected by the
A)median.
B)mode.
C)standard deviation.
D)range.
A)median.
B)mode.
C)standard deviation.
D)range.
Unlock Deck
Unlock for access to all 45 flashcards in this deck.
Unlock Deck
k this deck
26
The calculation of the average deviation differs from the calculation of the standard deviation in that when calculating the average deviation the difference scores are
A)squared.
B)converted to absolute values.
C)squared and converted to absolute values.
D)it does not differ.
A)squared.
B)converted to absolute values.
C)squared and converted to absolute values.
D)it does not differ.
Unlock Deck
Unlock for access to all 45 flashcards in this deck.
Unlock Deck
k this deck
27
Explain the difference between qualitative and quantitative variables noting the relationship of nominal, ordinal, interval, and ratio data to these terms.
Unlock Deck
Unlock for access to all 45 flashcards in this deck.
Unlock Deck
k this deck
28
Which of the following is FALSE?
A)The range is a simplistic measure of variation that does not use all scores in the distribution in its calculation.
B)The average deviation is a more sophisticated measure of variation than the range in which all scores are used but which may not weight extreme scores adequately.
C)The standard deviation is the least sophisticated measure of variation and the least frequently used.
D)all of the options are true
Unlock Deck
Unlock for access to all 45 flashcards in this deck.
Unlock Deck
k this deck
29
Imagine that distribution A contains the following scores: 3, 4, 5, 6, 7. Imagine that distribution B contains the following scores: 1, 3, 5, 8, 10. Distribution A has a _____ standard deviation and a _____ average deviation in comparison to distribution B.
A)larger; larger
B)smaller; smaller
C)larger; smaller
D)smaller; larger
A)larger; larger
B)smaller; smaller
C)larger; smaller
D)smaller; larger
Unlock Deck
Unlock for access to all 45 flashcards in this deck.
Unlock Deck
k this deck
30
Faculty in the psychology department at State University consume an average of 5 cups of coffee per day with a standard deviation of 1.5. The distribution is normal. What is the percentile rank for an individual who consumed 8 cups of coffee per day?
A)97.72
B)2.28
C)47.72
D)none of the options is correct
A)97.72
B)2.28
C)47.72
D)none of the options is correct
Unlock Deck
Unlock for access to all 45 flashcards in this deck.
Unlock Deck
k this deck
31
Approximately what percentage of scores are between z=1 and z=2?
A)50
B)68
C)16
D)13.5
A)50
B)68
C)16
D)13.5
Unlock Deck
Unlock for access to all 45 flashcards in this deck.
Unlock Deck
k this deck
32
Karen's first psychology exam score is ‑1 standard deviation from the mean in a normal distribution. The test has a mean of 75 and a standard deviation of 5. Karen's percentile rank would be
A)16%.
B)54%.
C)70%.
D)cannot determine from the information given
A)16%.
B)54%.
C)70%.
D)cannot determine from the information given
Unlock Deck
Unlock for access to all 45 flashcards in this deck.
Unlock Deck
k this deck
33
Which of the following is a disadvantage of using the range as a measure of variation?
A)It is limited because only two of the scores in the distribution are used to derive it.
B)It is easily distorted by an unusually high or low score in a distribution.
C)It can only be used with nominal data.
D)It is limited because only two of the scores in the distribution are used to derive it, and it is easily distorted by an unusually high or low score in a distribution.
Unlock Deck
Unlock for access to all 45 flashcards in this deck.
Unlock Deck
k this deck
34
If the average height for women is normally distributed with a mean of 65 inches and a standard deviation of 2.5 inches, then approximately 95% of all women should be between _____ and _____ inches in height.
A)62.5; 67.7
B)60; 70
C)57.5; 72.5
D)cannot determine from the information given
A)62.5; 67.7
B)60; 70
C)57.5; 72.5
D)cannot determine from the information given
Unlock Deck
Unlock for access to all 45 flashcards in this deck.
Unlock Deck
k this deck
35
If the shape of a frequency distribution is lopsided, with a long tail projecting longer to the right than to the left, how would the distribution be skewed?
A)normally
B)negatively
C)positively
D)average
A)normally
B)negatively
C)positively
D)average
Unlock Deck
Unlock for access to all 45 flashcards in this deck.
Unlock Deck
k this deck
36
Sue took a test in both biology and math last week. The biology test had a mean of 70 and a standard deviation of 7 whereas the math test had a mean of 75 and a standard deviation of 10. Sue scored a 76 on the biology test and a 76 on the math test. On which test did she do better in comparison to the rest of the class?
A)the math test
B)the biology test
C)she did the same on each test
D)cannot be determined
A)the math test
B)the biology test
C)she did the same on each test
D)cannot be determined
Unlock Deck
Unlock for access to all 45 flashcards in this deck.
Unlock Deck
k this deck
37
Rich's first psychology exam score is +1 standard deviation from the mean in a normal distribution. The test has a mean of 60 and a standard deviation of 6. Rich's percentile rank would be approximately
A)70%.
B)84%.
C)66%.
D)cannot determine from the information given
A)70%.
B)84%.
C)66%.
D)cannot determine from the information given
Unlock Deck
Unlock for access to all 45 flashcards in this deck.
Unlock Deck
k this deck
38
Faculty in the psychology department at State University consume an average of 5 cups of coffee per day with a standard deviation of 1.5. The distribution is normal. How many cups of coffee would an individual at the 25th percentile drink per day?
A)4
B)5
C)6
D)7
A)4
B)5
C)6
D)7
Unlock Deck
Unlock for access to all 45 flashcards in this deck.
Unlock Deck
k this deck
39
In a psychology class of 100 students, test scores are normally distributed with a mean of 80 and a standard deviation of 5. Approximately what percentage of students have scores between 70 and 90?
A)68%
B)80%
C)95%
D)99%
A)68%
B)80%
C)95%
D)99%
Unlock Deck
Unlock for access to all 45 flashcards in this deck.
Unlock Deck
k this deck
40
Calculate the mean, median, and mode for the following sample: 2, 2, 6, 9, 10, 11, 15, 17, 18, 20.
Unlock Deck
Unlock for access to all 45 flashcards in this deck.
Unlock Deck
k this deck
41
Calculate S (standard deviation) and A.D. (average deviation) for the following sample.
2, 2, 6, 9, 10, 10, 15, 18, 18, 20.
2, 2, 6, 9, 10, 10, 15, 18, 18, 20.
Unlock Deck
Unlock for access to all 45 flashcards in this deck.
Unlock Deck
k this deck
42
Students in the psychology department consume an average of 5 cups of coffee per day with a standard deviation of 1.75 cups. The number of cups of coffee consumed is normally distributed.
Unlock Deck
Unlock for access to all 45 flashcards in this deck.
Unlock Deck
k this deck
43
Tom, Tina, & Tori took a verbal aptitude test. The test was normally distributed with a mean of 70 and s = 15. Complete the following table.
Unlock Deck
Unlock for access to all 45 flashcards in this deck.
Unlock Deck
k this deck
44
For a hypothetical normal distribution of test scores, approximately 95% fall between 38 and 62, 2.5% are below 38, and 2.5% are above 62. Given this information, (a) the mode = _________ and (b) the standard deviation = _________.
Unlock Deck
Unlock for access to all 45 flashcards in this deck.
Unlock Deck
k this deck
45
Draw two distributions with the same standard deviations but different means.
Unlock Deck
Unlock for access to all 45 flashcards in this deck.
Unlock Deck
k this deck
Unlock Deck
Unlock for access to all 45 flashcards in this deck.


