Exam 5: Data Organization and Descriptive Statistics
Exam 1: Thinking Like a Scientist55 Questions
Exam 2: Getting Started34 Questions
Exam 3: Defining Measuring and Manipulating Variables62 Questions
Exam 4: Descriptive Methods55 Questions
Exam 5: Data Organization and Descriptive Statistics45 Questions
Exam 6: Correlational Methods and Statistics38 Questions
Exam 7: Probability and Hypothesis Testing60 Questions
Exam 8: Introduction to Inferential Statistics58 Questions
Exam 9: Experimental Design and Analysis I48 Questions
Exam 10: Experimental Design and Analysis II28 Questions
Exam 11: Experimental Design and Analysis III35 Questions
Exam 12: Experimental Design and Analysis Iv48 Questions
Exam 13: Quasi Experimental and Single Case Designs43 Questions
Exam 14: Nonparametric Inferential Statistics23 Questions
Exam 15: APA Communication Guidelines14 Questions
Select questions type
A distribution can have more than one ____ but can have only one _____.
Free
(Multiple Choice)
4.7/5  (39)
(39)
Correct Answer: Verified
C
Draw the frequency polygon for the following distribution (there are 30 scores in the distribution). In addition, calculate the mean, median, and mode for the distribution.
48, 50, 53, 59, 59, 63, 63, 67, 67, 67, 72, 72, 72, 78, 78, 78, 78, 85, 85, 85, 85, 85, 90, 90, 90, 90, 95, 95, 98, 100
Free
(Essay)
4.7/5 (26)
Correct Answer:Verified
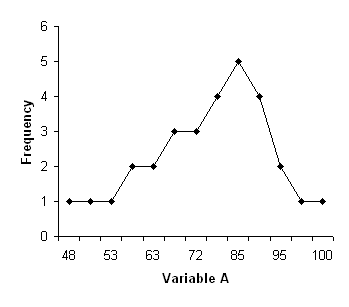 Mean = 76.57, Median = 78, Mode = 85
During the past year, Cindy and Bobby each read 2 books, but Greg read 25, Jan read 12, and Marcia read 9. The median number of books read by these individuals was
Free
(Multiple Choice)
4.9/5 (34)
Correct Answer:Verified
B
A graphical representation of a frequency distribution in which vertical bars are centered above each category along the x-axis and are separated from each other by a space is a _____.
(Multiple Choice)
4.8/5 (31)
Students in the psychology department consume an average of 5 cups of coffee per day with a standard deviation of 1.75 cups. The number of cups of coffee consumed is normally distributed.
(Essay)
4.8/5 (39)
Rich's first psychology exam score is +1 standard deviation from the mean in a normal distribution. The test has a mean of 60 and a standard deviation of 6. Rich's percentile rank would be approximately
(Multiple Choice)
4.7/5 (32)
A categorical variable for which each value represents a discrete category is a _____ variable.
(Multiple Choice)
4.8/5 (33)
Karen's first psychology exam score is ‑1 standard deviation from the mean in a normal distribution. The test has a mean of 75 and a standard deviation of 5. Karen's percentile rank would be
(Multiple Choice)
4.8/5 (36)
Draw two distributions with the same standard deviations but different means.
(Essay)
4.7/5 (39)
Tom, Tina, & Tori took a verbal aptitude test. The test was normally distributed with a mean of 70 and s = 15. Complete the following table.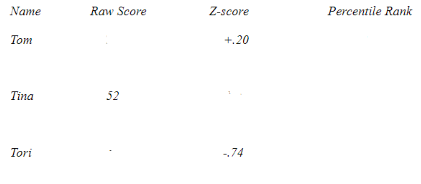
(Essay)
4.8/5 (44)
Faculty in the psychology department at State University consume an average of 5 cups of coffee per day with a standard deviation of 1.5. The distribution is normal. How many cups of coffee would an individual at the 25th percentile drink per day?
(Multiple Choice)
4.8/5 (34)
Bar graphs are to _____ as frequency polygons are to _____.
(Multiple Choice)
4.9/5 (36)
Calculate the mean, median, and mode for the following sample: 2, 2, 6, 9, 10, 11, 15, 17, 18, 20.
(Short Answer)
4.9/5 (37)
Faculty in the psychology department at State University consume an average of 5 cups of coffee per day with a standard deviation of 1.5. The distribution is normal. What is the percentile rank for an individual who consumed 8 cups of coffee per day?
(Multiple Choice)
4.9/5 (37)
Imagine that distribution A contains the following scores: 3, 4, 5, 6, 7. Imagine that distribution B contains the following scores: 1, 3, 5, 8, 10. Distribution A has a _____ standard deviation and a _____ average deviation in comparison to distribution B.
(Multiple Choice)
4.9/5 (34)
Arithmetic average is to _____ as score occurring with the greatest frequency is to _____.
(Multiple Choice)
4.8/5 (35)
Which of the following is a disadvantage of using the range as a measure of variation?
(Multiple Choice)
4.9/5 (28)
Faculty in the psychology department at State University consume an average of 5 cups of coffee per day with a standard deviation of 1.5. The distribution is normal. What proportion of faculty consumes an amount between 4 and 6 cups?
(Multiple Choice)
4.7/5 (37)
A table in which the scores are grouped into intervals and listed along with the frequency of scores in each interval is a _____.
(Multiple Choice)
4.9/5 (32)
Filters
- Essay(0)
- Multiple Choice(0)
- Short Answer(0)
- True False(0)
- Matching(0)