Deck 2: Data Representation
Full screen (f)
Question
Question
Question
Question
Question
Question
Question
Question
Question
Question
Question
Question
Question
Question
Question
Question
Question
Question
Question
Question
Question
Question
Question
Question
Question
Question
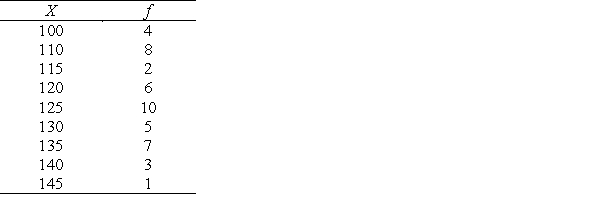
A sample distribution of variable X is as follows:
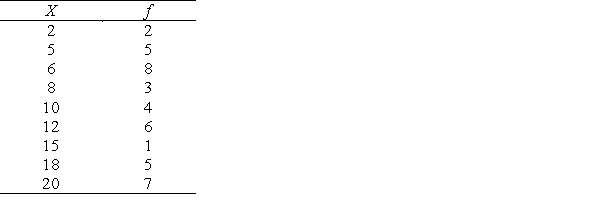 Calculate or draw each of the following for the sample distribution of X. Where possible, use SPSS to generate the data.
a. frequency distribution
b. cumulative relative frequency distribution
c. histogram (ungrouped)
d. frequency polygon
e. Q1
f. Q2
g. Q3
h. P10 and P90
i. box-and-whisker plot
Calculate or draw each of the following for the sample distribution of X. Where possible, use SPSS to generate the data. a. frequency distribution
b. cumulative relative frequency distribution
c. histogram (ungrouped)
d. frequency polygon
e. Q1
f. Q2
g. Q3
h. P10 and P90
i. box-and-whisker plot
Question
A sample distribution of variable X is as follows:
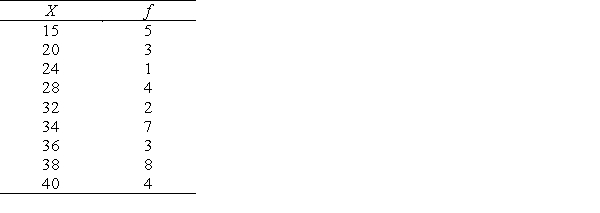 Calculate or draw each of the following for the sample distribution of X. Where possible, use SPSS to generate the data.
a. frequency distribution
b. cumulative relative frequency distribution
c. histogram (ungrouped)
d. frequency polygon
e. Q1
f. Q2
g. Q3
h. P10 and P90
i. box-and-whisker plot
Calculate or draw each of the following for the sample distribution of X. Where possible, use SPSS to generate the data. a. frequency distribution
b. cumulative relative frequency distribution
c. histogram (ungrouped)
d. frequency polygon
e. Q1
f. Q2
g. Q3
h. P10 and P90
i. box-and-whisker plot
Question
A sample distribution of variable X is as follows:
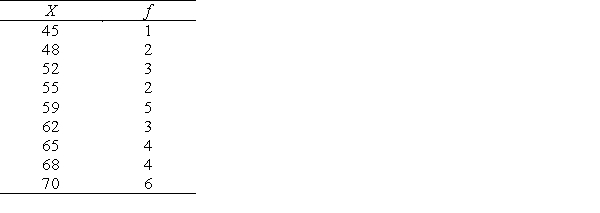 Calculate or draw each of the following for the sample distribution of X. Where possible, use SPSS to generate the data.
a. frequency distribution
b. cumulative relative frequency distribution
c. histogram (ungrouped)
d. frequency polygon
e. Q1
f. Q2
g. Q3
h. P10 and P90
i. box-and-whisker plot
Calculate or draw each of the following for the sample distribution of X. Where possible, use SPSS to generate the data. a. frequency distribution
b. cumulative relative frequency distribution
c. histogram (ungrouped)
d. frequency polygon
e. Q1
f. Q2
g. Q3
h. P10 and P90
i. box-and-whisker plot
Question
A sample distribution of variable X is as follows:
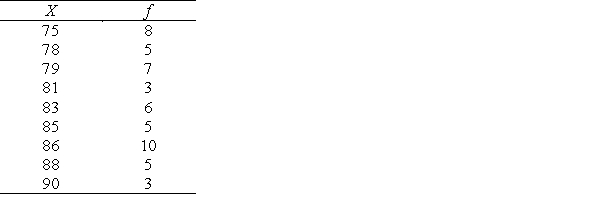 Calculate or draw each of the following for the sample distribution of X. Where possible, use SPSS to generate the data.
a. frequency distribution
b. cumulative relative frequency distribution
c. histogram (ungrouped)
d. frequency polygon
e. Q1
f. Q2
g. Q3
h. P10 and P90
i. box-and-whisker plot
Calculate or draw each of the following for the sample distribution of X. Where possible, use SPSS to generate the data. a. frequency distribution
b. cumulative relative frequency distribution
c. histogram (ungrouped)
d. frequency polygon
e. Q1
f. Q2
g. Q3
h. P10 and P90
i. box-and-whisker plot
Question
A sample distribution of variable X is as follows:
 Calculate or draw each of the following for the sample distribution of X. Where possible, use SPSS to generate the data.
a. frequency distribution
b. cumulative relative frequency distribution
c. histogram (ungrouped)
d. frequency polygon
e. Q1
f. Q2
g. Q3
h. P10 and P90
i. box-and-whisker plot
Calculate or draw each of the following for the sample distribution of X. Where possible, use SPSS to generate the data. a. frequency distribution
b. cumulative relative frequency distribution
c. histogram (ungrouped)
d. frequency polygon
e. Q1
f. Q2
g. Q3
h. P10 and P90
i. box-and-whisker plot

Unlock Deck
Sign up to unlock the cards in this deck!
Unlock Deck
Unlock Deck
1/30
Play
Full screen (f)
Deck 2: Data Representation
1
For a distribution where the 25th percentile is 30, what is the percentile rank of 30?
A) 0
B) .25
C) .30
D) 25
E) 30
A) 0
B) .25
C) .30
D) 25
E) 30
E
2
For a distribution where the 75th percentile is 50, what is the percentile rank of 50?
A) 0
B) .50
C) .75
D) 50
E) 75
A) 0
B) .50
C) .75
D) 50
E) 75
D
3
For a distribution where the 40th percentile is 80, what is the percentile rank of 80?
A) 0
B) .40
C) .80
D) 40
E) 80
A) 0
B) .40
C) .80
D) 40
E) 80
E
4
For a distribution where the 90th percentile is 20, what is the percentile rank of 20?
A) 0
B) .20
C) .90
D) 20
E) 90
A) 0
B) .20
C) .90
D) 20
E) 90
Unlock Deck
Unlock for access to all 30 flashcards in this deck.
Unlock Deck
k this deck
5
Among the following, what is the preferred method for graphing data pertaining to preference of coffee flavor of a sample?
A) Bar graph
B) Cumulative frequency polygon
C) Frequency polygon
D) Histogram
A) Bar graph
B) Cumulative frequency polygon
C) Frequency polygon
D) Histogram
Unlock Deck
Unlock for access to all 30 flashcards in this deck.
Unlock Deck
k this deck
6
Among the following, what is the preferred method for graphing data pertaining to eye color of a sample?
A) Bar graph
B) Cumulative frequency polygon
C) Frequency polygon
D) Histogram
A) Bar graph
B) Cumulative frequency polygon
C) Frequency polygon
D) Histogram
Unlock Deck
Unlock for access to all 30 flashcards in this deck.
Unlock Deck
k this deck
7
Among the following, what is the preferred method for graphing data pertaining to religious affiliation of a sample?
A) Bar graph
B) Cumulative frequency polygon
C) Frequency polygon
D) Histogram
A) Bar graph
B) Cumulative frequency polygon
C) Frequency polygon
D) Histogram
Unlock Deck
Unlock for access to all 30 flashcards in this deck.
Unlock Deck
k this deck
8
Which of the following statements is correct for a continuous variable?
A) The proportion of the distribution below the 25th percentile is 75%.
B) The proportion of the distribution below the second quartile is 50%.
C) The proportion of the distribution between the first quartile and 75th percentile is 75%.
D) The proportion of the distribution between the second quartile and 50th percentile is 50%.
E) The proportion of the distribution between the third quartile and 75th percentile is 25%.
Unlock Deck
Unlock for access to all 30 flashcards in this deck.
Unlock Deck
k this deck
9
Given a variable that is interval or ratio in measurement scale, which of the following is correct?
A) The proportion of the distribution between the 25th percentile and the 3rd quartile is 75%.
B) The proportion of the distribution between the 50th percentile and the 2nd quartile is 50.
C) The proportion of the distribution below the 1st quartile is 75%.
D) The proportion of the distribution between the 2nd quartile and the 75% percentile is 25%.
Unlock Deck
Unlock for access to all 30 flashcards in this deck.
Unlock Deck
k this deck
10
Which of the following statements is correct for a continuous variable?
A) The proportion of the distribution below the 25th percentile is 25%.
B) The proportion of the distribution below the second quartile is 25%.
C) The proportion of the distribution between the first quartile and 50th percentile is 50%.
D) The proportion of the distribution between the second quartile and 50th percentile is 25%.
E) The proportion of the distribution between the third quartile is 25%.
Unlock Deck
Unlock for access to all 30 flashcards in this deck.
Unlock Deck
k this deck
11
Which of the following statements is correct for a continuous variable?
A) The proportion of the distribution below the 50th percentile is 75%.
B) The proportion of the distribution below the third quartile is 25%.
C) The proportion of the distribution between the first quartile and 25th percentile is 50%.
D) The proportion of the distribution between the first quartile and 50th percentile is 25%.
E) The proportion of the distribution between the third quartile and 75th percentile is 25%.
Unlock Deck
Unlock for access to all 30 flashcards in this deck.
Unlock Deck
k this deck
12
Which of the following statements is correct for a continuous variable?
A) The proportion of the distribution below the 25th percentile is 75%.
B) The proportion of the distribution above the first quartile is 75%.
C) The proportion of the distribution below the third quartile is 50%.
D) The proportion of the distribution between the second quartile and 50th percentile is 50%.
E) The proportion of the distribution between the first quartile and 75 percentile is 75%
Unlock Deck
Unlock for access to all 30 flashcards in this deck.
Unlock Deck
k this deck
13
Which of the following statements is correct for a continuous variable?
A) The proportion of the distribution above the 25th percentile is 75%.
B) The proportion of the distribution below the second quartile is 75%.
C) The proportion of the distribution below the third quartile is 25%.
D) The proportion of the distribution between the second quartile and 50th percentile is 25%.
E) The proportion of the distribution between the first quartile and 50th percentile is 50%.
Unlock Deck
Unlock for access to all 30 flashcards in this deck.
Unlock Deck
k this deck
14
Which of the following statements is correct for a continuous variable?
A) The proportion of the distribution above the 25th percentile is 25%.
B) The proportion of the distribution below the second quartile is 25%.
C) The proportion of the distribution below the third quartile is 75%.
D) The proportion of the distribution between the second quartile and 75th percentile is 50%.
E) The proportion of the distribution between the first quartile and 50th percentile is 75%.
Unlock Deck
Unlock for access to all 30 flashcards in this deck.
Unlock Deck
k this deck
15
Which of the following statements is correct for a continuous variable?
A) The proportion of the distribution below the 25th percentile is 25%.
B) The proportion of the distribution below the 50th percentile is 75%.
C) The proportion of the distribution above the third quartile is 75%.
D) The proportion of the distribution between the 25th and 75th percentile is 75%.
E) The proportion of the distribution between the first quartile and third quartiles is 75%.
Unlock Deck
Unlock for access to all 30 flashcards in this deck.
Unlock Deck
k this deck
16
In examining data collected over the past ten years, researchers at Disneyworld find that of 5,000 first time guests: 2,250 visited during the summer months; 675 visited during the fall; 1,300 visited during the winter; and 775 visited during the spring. What is the relative frequency for guests who visited during the spring?
A) .135
B) .155
C) .26
D) .45
A) .135
B) .155
C) .26
D) .45
Unlock Deck
Unlock for access to all 30 flashcards in this deck.
Unlock Deck
k this deck
17
In examining data collected over the past ten years, researchers at Disneyworld find that of 5,000 first time guests: 2,250 visited during the summer months; 675 visited during the fall; 1,300 visited during the winter; and 775 visited during the spring. What is the relative frequency for guests who visited during the winter?
A) .135
B) .155
C) .26
D) .45
A) .135
B) .155
C) .26
D) .45
Unlock Deck
Unlock for access to all 30 flashcards in this deck.
Unlock Deck
k this deck
18
For a dataset with six values (25, 28, 32, 37, 45, 54, 63), the relative frequency for the value 25 is 18%, the relative frequency for the value 28 is 10%, the relative frequency for the value 32 is 7%, the relative frequency for the value 37 is 26%, and the relative frequency for the value 45 is 11%, and the relative frequency for the value 54 is 16%. What is the cumulative relative frequency for the value 45?
A) 11%
B) 28%
C) 61%
D) 72%
E) 100%
A) 11%
B) 28%
C) 61%
D) 72%
E) 100%
Unlock Deck
Unlock for access to all 30 flashcards in this deck.
Unlock Deck
k this deck
19
For a dataset with six values (25, 28, 32, 37, 45, 54, 63), the relative frequency for the value 25 is 18%, the relative frequency for the value 28 is 10%, the relative frequency for the value 32 is 7%, the relative frequency for the value 37 is 26%, and the relative frequency for the value 45 is 11%, and the relative frequency for the value 54 is 16%. What is the cumulative relative frequency for the value 28?
A) 11%
B) 28%
C) 61%
D) 72%
E) 100%
A) 11%
B) 28%
C) 61%
D) 72%
E) 100%
Unlock Deck
Unlock for access to all 30 flashcards in this deck.
Unlock Deck
k this deck
20
For a dataset with five values (65, 72, 80, 88, 95), the relative frequency for the value 65 is 5%, the relative frequency for the value 72 is 15%, the relative frequency for the value 80 is 20%, the relative frequency for the value 88 is 30%, and the relative frequency for the value 95 is 30%. What is the cumulative relative frequency for the value 80?
A) 15%
B) 20%
C) 40%
D) 70%
E) 100%
A) 15%
B) 20%
C) 40%
D) 70%
E) 100%
Unlock Deck
Unlock for access to all 30 flashcards in this deck.
Unlock Deck
k this deck
21
For a dataset with five values (65, 72, 80, 88, 95), the relative frequency for the value 65 is 5%, the relative frequency for the value 72 is 15%, the relative frequency for the value 80 is 20%, the relative frequency for the value 88 is 30%, and the relative frequency for the value 95 is 30%. What is the cumulative relative frequency for the value 88?
A) 30%
B) 40%
C) 60%
D) 70%
E) 100%
A) 30%
B) 40%
C) 60%
D) 70%
E) 100%
Unlock Deck
Unlock for access to all 30 flashcards in this deck.
Unlock Deck
k this deck
22
One-hundred guests during a university's Parent Day are asked who it is they are visiting while they're on campus. Thirty indicate that they are visiting their son, forty indicate they are visiting their daughter, twenty indicate that they are visiting a grandchild, and ten indicate that they are visiting two children. What is the relative frequency for guests who are visiting their daughter?
A) .10
B) .20
C) .30
D) .40
E) .50
A) .10
B) .20
C) .30
D) .40
E) .50
Unlock Deck
Unlock for access to all 30 flashcards in this deck.
Unlock Deck
k this deck
23
The letter grades earned by students in a speech class included (with 'A' being the best grade possible and 'F' being the worst grade possible): A, B, C, D, and F. Letter grade of 'A' had a relative frequency of 15%, grade of 'B' had a relative frequency of 20%, grade of 'C' had a relative frequency of 30%, letter grade of 'D' had a relative frequency of 20%, and letter grade of 'F' had a relative frequency of 15%. What is the cumulative relative frequency for a letter grade of 'C'?
A) 15%
B) 35%
C) 65%
D) 85%
A) 15%
B) 35%
C) 65%
D) 85%
Unlock Deck
Unlock for access to all 30 flashcards in this deck.
Unlock Deck
k this deck
24
The five hottest temperatures (in Fahrenheit) recorded at the Central State Zoo and there frequency of occurrence over the past five years were examined by the zoo's statistician. These temperatures included: 55, 72, 86, 94, and 96. The relative frequency for a temperature of 55 was 20%, for a temperature of 72 was 30%, for a temperature of 86 was 14%, for a temperature of 94 was 15%, and for a temperature of 96 was 21%. What is the cumulative relative frequency for the temperature of 86?
A) 14%
B) 20%
C) 50%
D) 64%
A) 14%
B) 20%
C) 50%
D) 64%
Unlock Deck
Unlock for access to all 30 flashcards in this deck.
Unlock Deck
k this deck
25
A statistician employed by the Central State Zoo examines data from a random sample of 500 previous visitors. She finds that 322 guests who visited purchased annual passes, 102 purchased multi-day passes, and 76 purchased one-day tickets. What is the relative frequency for visitors who purchased one-day tickets?
A) 1.00
B) .64
C) .20
D) .15
A) 1.00
B) .64
C) .20
D) .15
Unlock Deck
Unlock for access to all 30 flashcards in this deck.
Unlock Deck
k this deck
26
A sample distribution of variable X is as follows:
Calculate or draw each of the following for the sample distribution of X. Where possible, use SPSS to generate the data.
a. frequency distribution
b. cumulative relative frequency distribution
c. histogram (ungrouped)
d. frequency polygon
e. Q1
f. Q2
g. Q3
h. P10 and P90
i. box-and-whisker plot
Calculate or draw each of the following for the sample distribution of X. Where possible, use SPSS to generate the data. a. frequency distribution
b. cumulative relative frequency distribution
c. histogram (ungrouped)
d. frequency polygon
e. Q1
f. Q2
g. Q3
h. P10 and P90
i. box-and-whisker plot
Unlock Deck
Unlock for access to all 30 flashcards in this deck.
Unlock Deck
k this deck
27
A sample distribution of variable X is as follows:
Calculate or draw each of the following for the sample distribution of X. Where possible, use SPSS to generate the data.
a. frequency distribution
b. cumulative relative frequency distribution
c. histogram (ungrouped)
d. frequency polygon
e. Q1
f. Q2
g. Q3
h. P10 and P90
i. box-and-whisker plot
Calculate or draw each of the following for the sample distribution of X. Where possible, use SPSS to generate the data. a. frequency distribution
b. cumulative relative frequency distribution
c. histogram (ungrouped)
d. frequency polygon
e. Q1
f. Q2
g. Q3
h. P10 and P90
i. box-and-whisker plot
Unlock Deck
Unlock for access to all 30 flashcards in this deck.
Unlock Deck
k this deck
28
A sample distribution of variable X is as follows:
Calculate or draw each of the following for the sample distribution of X. Where possible, use SPSS to generate the data.
a. frequency distribution
b. cumulative relative frequency distribution
c. histogram (ungrouped)
d. frequency polygon
e. Q1
f. Q2
g. Q3
h. P10 and P90
i. box-and-whisker plot
Calculate or draw each of the following for the sample distribution of X. Where possible, use SPSS to generate the data. a. frequency distribution
b. cumulative relative frequency distribution
c. histogram (ungrouped)
d. frequency polygon
e. Q1
f. Q2
g. Q3
h. P10 and P90
i. box-and-whisker plot
Unlock Deck
Unlock for access to all 30 flashcards in this deck.
Unlock Deck
k this deck
29
A sample distribution of variable X is as follows:
Calculate or draw each of the following for the sample distribution of X. Where possible, use SPSS to generate the data.
a. frequency distribution
b. cumulative relative frequency distribution
c. histogram (ungrouped)
d. frequency polygon
e. Q1
f. Q2
g. Q3
h. P10 and P90
i. box-and-whisker plot
Calculate or draw each of the following for the sample distribution of X. Where possible, use SPSS to generate the data. a. frequency distribution
b. cumulative relative frequency distribution
c. histogram (ungrouped)
d. frequency polygon
e. Q1
f. Q2
g. Q3
h. P10 and P90
i. box-and-whisker plot
Unlock Deck
Unlock for access to all 30 flashcards in this deck.
Unlock Deck
k this deck
30
A sample distribution of variable X is as follows:
Calculate or draw each of the following for the sample distribution of X. Where possible, use SPSS to generate the data.
a. frequency distribution
b. cumulative relative frequency distribution
c. histogram (ungrouped)
d. frequency polygon
e. Q1
f. Q2
g. Q3
h. P10 and P90
i. box-and-whisker plot
Calculate or draw each of the following for the sample distribution of X. Where possible, use SPSS to generate the data. a. frequency distribution
b. cumulative relative frequency distribution
c. histogram (ungrouped)
d. frequency polygon
e. Q1
f. Q2
g. Q3
h. P10 and P90
i. box-and-whisker plot
Unlock Deck
Unlock for access to all 30 flashcards in this deck.
Unlock Deck
k this deck
Unlock Deck
Unlock for access to all 30 flashcards in this deck.


