Exam 2: Data Representation
Exam 1: Introduction30 Questions
Exam 2: Data Representation30 Questions
Exam 3: Univariate Population Parameters and Sample Statistics30 Questions
Exam 4: Normal Distribution and Standard Scores30 Questions
Exam 5: Introduction to Probability and Sample Statistics30 Questions
Exam 6: Inferences About a Single Mean30 Questions
Exam 7: Inferences About the Difference Between Two Means30 Questions
Exam 8: Inferences About Proportions30 Questions
Exam 9: Inferences About Variances30 Questions
Exam 10: Bivariate Measures of Association30 Questions
Exam 11: One-Factor Anova: Fixed-Effects Model30 Questions
Exam 12: Multiple Comparison Procedures30 Questions
Exam 13: Factorial Anova: Fixed-Effects Model30 Questions
Exam 14: One-Factor Fixed-Effects Ancova With Single Covariate30 Questions
Exam 15: Random- and Mixed-Effects Analysis of Variance Models30 Questions
Exam 16: Hierarchical and Randomized Block Analysis of Variance Models30 Questions
Exam 17: Simple Linear Regression35 Questions
Exam 18: Multiple Regression29 Questions
Exam 19: Logistic Regression30 Questions
Select questions type
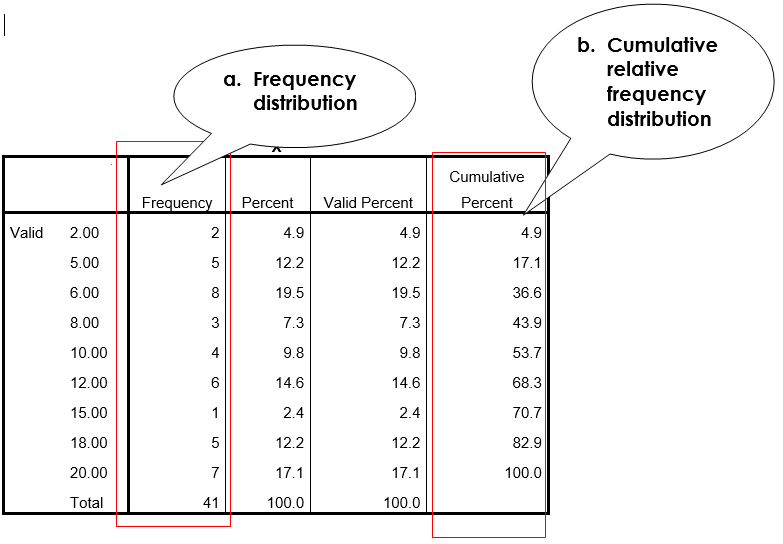
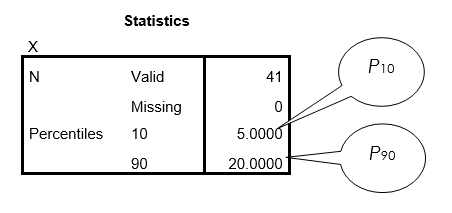
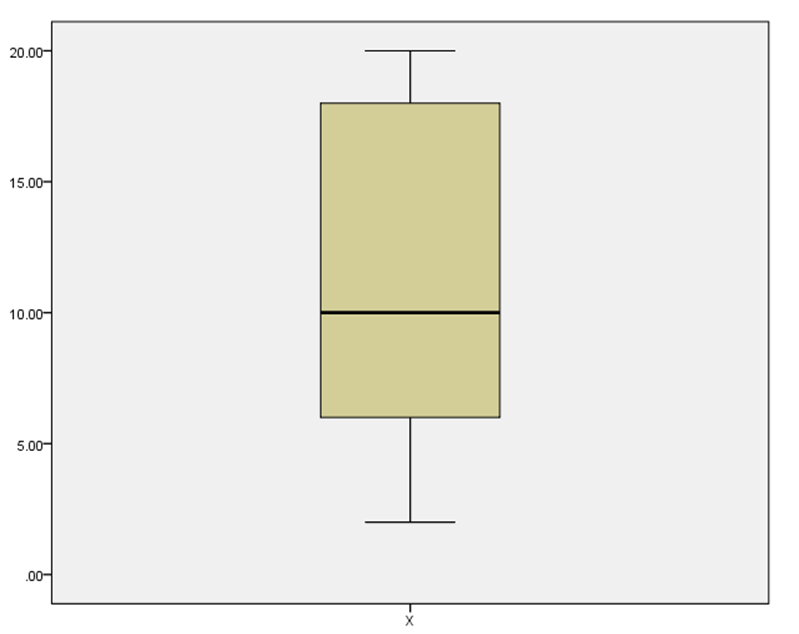
A sample distribution of variable X is as follows:
X f 2 2 5 5 6 8 8 3 10 4 12 6 15 1 18 5 20 7 Calculate or draw each of the following for the sample distribution of X. Where possible, use SPSS to generate the data.
a. frequency distribution
b. cumulative relative frequency distribution
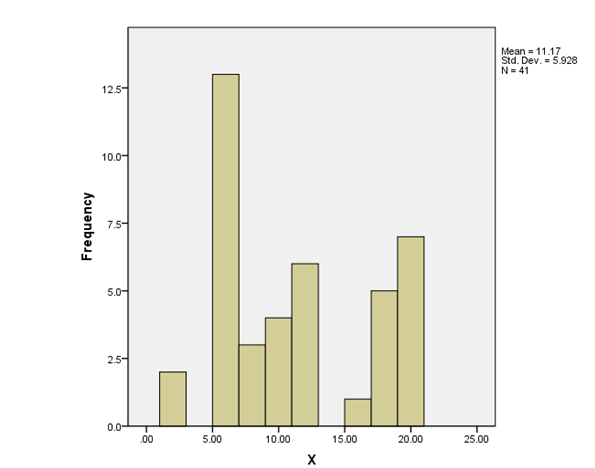
c. histogram (ungrouped)
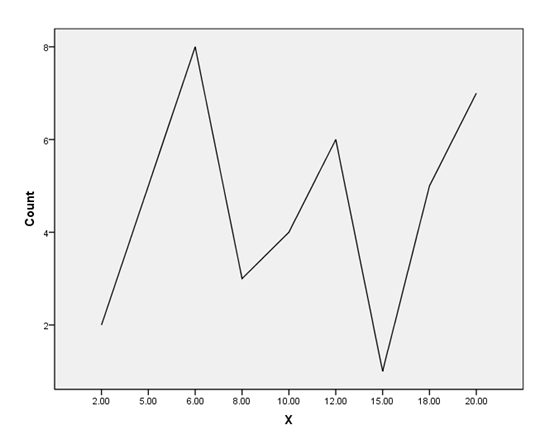
d. frequency polygon
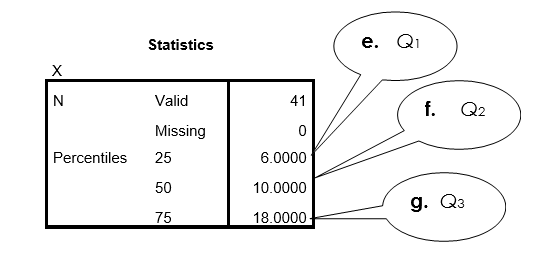
e. Q1
f. Q2
g. Q3
h. P10 and P90
i. box-and-whisker plot
Free
(Essay)
4.9/5  (36)
(36)
Correct Answer: Verified
c. histogram (ungrouped)
d. frequency polygon
h. P10 and P90
i. box-and-whisker plot
For a dataset with six values (25, 28, 32, 37, 45, 54, 63), the relative frequency for the value 25 is 18%, the relative frequency for the value 28 is 10%, the relative frequency for the value 32 is 7%, the relative frequency for the value 37 is 26%, and the relative frequency for the value 45 is 11%, and the relative frequency for the value 54 is 16%. What is the cumulative relative frequency for the value 45?
Free
(Multiple Choice)
4.8/5 (34)
Correct Answer:Verified
D
Among the following, what is the preferred method for graphing data pertaining to religious affiliation of a sample?
Free
(Multiple Choice)
4.8/5 (27)
Correct Answer:Verified
A
The letter grades earned by students in a speech class included (with 'A' being the best grade possible and 'F' being the worst grade possible): A, B, C, D, and F. Letter grade of 'A' had a relative frequency of 15%, grade of 'B' had a relative frequency of 20%, grade of 'C' had a relative frequency of 30%, letter grade of 'D' had a relative frequency of 20%, and letter grade of 'F' had a relative frequency of 15%. What is the cumulative relative frequency for a letter grade of 'C'?
(Multiple Choice)
4.8/5 (27)
For a dataset with five values (65, 72, 80, 88, 95), the relative frequency for the value 65 is 5%, the relative frequency for the value 72 is 15%, the relative frequency for the value 80 is 20%, the relative frequency for the value 88 is 30%, and the relative frequency for the value 95 is 30%. What is the cumulative relative frequency for the value 80?
(Multiple Choice)
4.8/5 (28)
For a distribution where the 40th percentile is 80, what is the percentile rank of 80?
(Multiple Choice)
4.8/5 (41)
For a distribution where the 90th percentile is 20, what is the percentile rank of 20?
(Multiple Choice)
4.7/5 (45)
Which of the following statements is correct for a continuous variable?
(Multiple Choice)
4.8/5 (31)
Among the following, what is the preferred method for graphing data pertaining to eye color of a sample?
(Multiple Choice)
4.9/5 (35)
Which of the following statements is correct for a continuous variable?
(Multiple Choice)
4.8/5 (38)
A statistician employed by the Central State Zoo examines data from a random sample of 500 previous visitors. She finds that 322 guests who visited purchased annual passes, 102 purchased multi-day passes, and 76 purchased one-day tickets. What is the relative frequency for visitors who purchased one-day tickets?
(Multiple Choice)
4.8/5 (26)
For a distribution where the 25th percentile is 30, what is the percentile rank of 30?
(Multiple Choice)
4.9/5 (39)
In examining data collected over the past ten years, researchers at Disneyworld find that of 5,000 first time guests: 2,250 visited during the summer months; 675 visited during the fall; 1,300 visited during the winter; and 775 visited during the spring. What is the relative frequency for guests who visited during the winter?
(Multiple Choice)
4.8/5 (32)
A sample distribution of variable X is as follows:
X f 100 4 110 8 115 2 120 6 125 10 130 5 135 7 140 3 145 1 Calculate or draw each of the following for the sample distribution of X. Where possible, use SPSS to generate the data.
a. frequency distribution
b. cumulative relative frequency distribution
c. histogram (ungrouped)
d. frequency polygon
e. Q1
f. Q2
g. Q3
h. P10 and P90
i. box-and-whisker plot
(Essay)
4.9/5 (32)
Given a variable that is interval or ratio in measurement scale, which of the following is correct?
(Multiple Choice)
4.9/5 (42)
For a dataset with six values (25, 28, 32, 37, 45, 54, 63), the relative frequency for the value 25 is 18%, the relative frequency for the value 28 is 10%, the relative frequency for the value 32 is 7%, the relative frequency for the value 37 is 26%, and the relative frequency for the value 45 is 11%, and the relative frequency for the value 54 is 16%. What is the cumulative relative frequency for the value 28?
(Multiple Choice)
5.0/5 (38)
Which of the following statements is correct for a continuous variable?
(Multiple Choice)
4.8/5 (36)
One-hundred guests during a university's Parent Day are asked who it is they are visiting while they're on campus. Thirty indicate that they are visiting their son, forty indicate they are visiting their daughter, twenty indicate that they are visiting a grandchild, and ten indicate that they are visiting two children. What is the relative frequency for guests who are visiting their daughter?
(Multiple Choice)
4.9/5 (36)
Which of the following statements is correct for a continuous variable?
(Multiple Choice)
4.9/5 (43)
A sample distribution of variable X is as follows:
X f 75 8 78 5 79 7 81 3 83 6 85 5 86 10 88 5 90 3 Calculate or draw each of the following for the sample distribution of X. Where possible, use SPSS to generate the data.
a. frequency distribution
b. cumulative relative frequency distribution
c. histogram (ungrouped)
d. frequency polygon
e. Q1
f. Q2
g. Q3
h. P10 and P90
i. box-and-whisker plot
(Essay)
4.8/5 (31)
Filters
- Essay(0)
- Multiple Choice(0)
- Short Answer(0)
- True False(0)
- Matching(0)