Deck 13: Analyzing Your Data I: an Overview
Full screen (f)
Question
Question
Question
Question
Question
Question
Question
Question
Question
Question
Question
Question
Question
Question
Question
Question
Question
Question
Question
Question
Consider the histogram below. Which of the following statements is necessarily true? 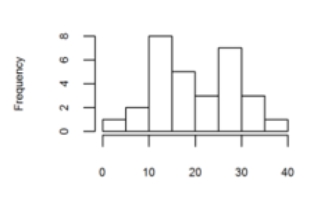
A) If the data in this histogram were to be displayed in a stem-and-leaf plot, there would be 3 leaves in the first row of the plot.
B) The median of this data set lies between 15 and 20.
C) The histogram contains less information about the original data than if the data were represented in a stem-and-leaf plot.
D) There are two means in the data set.
Question
Question
Question
Question
Question
Question
Question
Question
Question
Question
Question
Question
Question
Question
Question
Question
Question
Question
Question
Question
Question
Question
The plot below describes the relationship between the time spent in hours watching television per week (y-axis) and the time it takes to run half a mile in minutes (x-axis) in a sample of individuals.
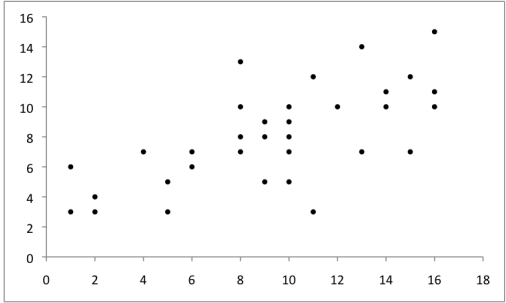 Does the graph illustrate a univariate or bivariate display? What does the graph tell you about the relationship between the two variables?
Does the graph illustrate a univariate or bivariate display? What does the graph tell you about the relationship between the two variables? Question
Question

Unlock Deck
Sign up to unlock the cards in this deck!
Unlock Deck
Unlock Deck
1/44
Play
Full screen (f)
Deck 13: Analyzing Your Data I: an Overview
1
The mode is the most common value in a data set. It is a measure of:
A) range.
B) kurtosis.
C) central tendency.
D) correlation.
A) range.
B) kurtosis.
C) central tendency.
D) correlation.
C
2
Which of the following information can you get from inferential statistics that you cannot obtain from descriptive statistics?
A) How much the data differs from an expected value.
B) Whether the data values are skewed.
C) The direction of association between two variables.
D) The average value of the data
A) How much the data differs from an expected value.
B) Whether the data values are skewed.
C) The direction of association between two variables.
D) The average value of the data
A
3
In Alison's study, the Pearson's r of participants' caffeine consumption (milligrams) and their reaction time (milliseconds) on a computer task is -0.22. This means that…
A) participants exhibited decreased reaction time with a higher consumption of caffeine.
B) participants exhibited increased reaction time with a higher consumption of caffeine.
C) participants had a mean reaction time of 0.22ms in the condition with low caffeine consumption.
D) participants had a mean reaction time of 0.22ms in the condition with high caffeine consumption
A
4
Cohen's d is seen as advantageous over calculating the difference in means of two groups as a measure of effect size because:
A) Cohen's d can be interpreted with respect to the standard deviation.
B) Cohen's d is more likely to obtain an effect that is statistically significant.
C) Cohen's d is a more reliable calculation of effect size.
D) Cohen's d is more easily calculated.
A) Cohen's d can be interpreted with respect to the standard deviation.
B) Cohen's d is more likely to obtain an effect that is statistically significant.
C) Cohen's d is a more reliable calculation of effect size.
D) Cohen's d is more easily calculated.
Unlock Deck
Unlock for access to all 44 flashcards in this deck.
Unlock Deck
k this deck
5
Which of the following groups of data can you compute a confidence interval for?
A) Interval, ratio, nominal
B) Interval, ratio, ordinal
C) Ordinal, ratio, categorical
D) Ordinal, interval, nominal
A) Interval, ratio, nominal
B) Interval, ratio, ordinal
C) Ordinal, ratio, categorical
D) Ordinal, interval, nominal
Unlock Deck
Unlock for access to all 44 flashcards in this deck.
Unlock Deck
k this deck
6
Which of the following is true about confidence intervals?
A) A 95% confidence interval is the same as a p value of .05.
B) The size of a confidence interval does not depend on sample size but depends instead on effect size.
C) A confidence interval can be easily calculated and represented on a graphical display.
D) The upper and lower bounds of a confidence interval are always of the same magnitude.
Unlock Deck
Unlock for access to all 44 flashcards in this deck.
Unlock Deck
k this deck
7
Stephanie is designing an experiment to investigate the effect of listening to calming music on positive emotions. Even though the usual alpha level is 0.05, Stephanie feels that she wants to adopt more stringent criteria for her study, so she chooses an alpha level of 0.01. This strategy reduces the probability of:
A) Type I error
B) Type II error
C) Standard error
D) p-value error
A) Type I error
B) Type II error
C) Standard error
D) p-value error
Unlock Deck
Unlock for access to all 44 flashcards in this deck.
Unlock Deck
k this deck
8
Jessica wants to ensure that her study has sufficient statistical power so that she has a good chance of rejecting the null hypothesis in the event that it is actually false. She would like to reduce the chances of a:
A) Type I error.
B) Type II error.
C) Standard error.
D) p value error.
A) Type I error.
B) Type II error.
C) Standard error.
D) p value error.
Unlock Deck
Unlock for access to all 44 flashcards in this deck.
Unlock Deck
k this deck
9
Which of the following is true about Type II error of a test?
A) The probability of a Type II error is not within the control of the researcher.
B) Type II error is the summation of Type I error and statistical power.
C) Type II error is a conditional probability.
D) The probability of a Type II error is same as the alpha level of a test.
A) The probability of a Type II error is not within the control of the researcher.
B) Type II error is the summation of Type I error and statistical power.
C) Type II error is a conditional probability.
D) The probability of a Type II error is same as the alpha level of a test.
Unlock Deck
Unlock for access to all 44 flashcards in this deck.
Unlock Deck
k this deck
10
What is meant for data to be normally distributed?
A) It means that the standard deviation is 1.96.
B) It means that the mean, median and mode are the same value.
C) It means that the mean and the mode are the same value, but not necessarily the median.
D) It means that 90% of the values fall within one standard deviation of the mean.
A) It means that the standard deviation is 1.96.
B) It means that the mean, median and mode are the same value.
C) It means that the mean and the mode are the same value, but not necessarily the median.
D) It means that 90% of the values fall within one standard deviation of the mean.
Unlock Deck
Unlock for access to all 44 flashcards in this deck.
Unlock Deck
k this deck
11
The sampling distribution of a mean with a sample size of 50…
A) has a smaller standard deviation than a sampling distribution with the same mean of sample size 30.
B) has a smaller standard deviation than a sampling distribution with the same mean of sample size 60.
C) has the same standard deviation with the distribution of individual raw data in the population.
D) has a different standard deviation than a sampling distribution with the same mean of sample size 100 but we do not know whether the standard deviation will be larger or smaller unless we know the standard error.
Unlock Deck
Unlock for access to all 44 flashcards in this deck.
Unlock Deck
k this deck
12
The central limit theorem states that:
A) even with populations that have dramatically non-normal distributions, the sampling distributions of the mean will be increasingly normal in shape as sample sizes increase.
B) the sampling distributions of the mean will reflect the shape of the underlying population, such that normally distributed samples can be assumed to come from a normally distributed population.
C) the sampling distributions of the mean will reflect the shape of the underlying population only for large sample sizes, such that populations with drastically non-normal distributions will yield sampling distributions that are normal for small to moderate sample sizes.
D) even with populations that have dramatically non-normal distributions, the sampling distributions of the mean will be increasingly normal in shape as sample sizes decrease.
Unlock Deck
Unlock for access to all 44 flashcards in this deck.
Unlock Deck
k this deck
13
The sampling distribution of means with a sample size of 1000 obtained from a population with a trimodal distribution (i.e., three modes) will…
A) be trimodal.
B) be bimodal.
C) be unimodal.
D) not have a mode.
A) be trimodal.
B) be bimodal.
C) be unimodal.
D) not have a mode.
Unlock Deck
Unlock for access to all 44 flashcards in this deck.
Unlock Deck
k this deck
14
The p value measures…
A) the probability of the null hypothesis being true given the results that were observed.
B) the probability of not obtaining a statistically significant result if the experiment were repeated.
C) the probability that the obtained result could have occurred by chance.
D) the probability of obtaining a result as extreme as the data if the null hypothesis were true.
Unlock Deck
Unlock for access to all 44 flashcards in this deck.
Unlock Deck
k this deck
15
When comparing two studies measuring the same phenomenon, the study with a statistical power of 0.5 is more likely to ________________________ than the study with a statistical power of 0.8.
A) result in a Type II error
B) give you a more precise estimate of the effect
C) produce a statistically significant finding
D) result in a Type I error
A) result in a Type II error
B) give you a more precise estimate of the effect
C) produce a statistically significant finding
D) result in a Type I error
Unlock Deck
Unlock for access to all 44 flashcards in this deck.
Unlock Deck
k this deck
16
The disadvantage of a small sample size in psychology experiments that expect to measure a small to medium effect is that…
A) the study is underpowered, leading to an increased Type I error.
B) the study is underpowered, leading to an increased Type II error.
C) the study is overpowered, leading to an increased Type I error.
D) the study is overpowered, leading to an increased Type I error.
A) the study is underpowered, leading to an increased Type I error.
B) the study is underpowered, leading to an increased Type II error.
C) the study is overpowered, leading to an increased Type I error.
D) the study is overpowered, leading to an increased Type I error.
Unlock Deck
Unlock for access to all 44 flashcards in this deck.
Unlock Deck
k this deck
17
Why should a power analysis be done while designing the study (i.e., before data collection)?
A) A power analysis will allow you to select the most appropriate alpha level for the study depending on your sample size.
B) A power analysis will tell you what effect size you should aim for in the data.
C) A power analysis will prevent misuse of the p value by putting the focus on confidence intervals instead.
D) A power analysis will let you know what sample size you need to have a good chance of detecting an effect if it exists.
Unlock Deck
Unlock for access to all 44 flashcards in this deck.
Unlock Deck
k this deck
18
Which of the following is a valid reason for focusing on effect size instead of p values when analyzing your results?
A) Effect sizes are more likely to provide you with a statistically significant result than a p value.
B) Effect sizes are immune to flaws in a study's design.
C) Effect sizes are not dependent on the sample size of your data in the way that a p value is.
D) Effect sizes tell you the probability of a result more directly than a p value.
Unlock Deck
Unlock for access to all 44 flashcards in this deck.
Unlock Deck
k this deck
19
Which of the following piece(s) of information is/are available from a stem-and-leaf plot?
A) Mean only
B) Mean and mode only
C) Mean, median and mode
D) Mean and median only
A) Mean only
B) Mean and mode only
C) Mean, median and mode
D) Mean and median only
Unlock Deck
Unlock for access to all 44 flashcards in this deck.
Unlock Deck
k this deck
20
Consider the histogram below. Which of the following statements is necessarily true?
A) If the data in this histogram were to be displayed in a stem-and-leaf plot, there would be 3 leaves in the first row of the plot.
B) The median of this data set lies between 15 and 20.
C) The histogram contains less information about the original data than if the data were represented in a stem-and-leaf plot.
D) There are two means in the data set.
Unlock Deck
Unlock for access to all 44 flashcards in this deck.
Unlock Deck
k this deck
21
In a box-and-whisker plot, the box itself represents the…
A) interquartile range.
B) mean.
C) mode.
D) entire data set.
A) interquartile range.
B) mean.
C) mode.
D) entire data set.
Unlock Deck
Unlock for access to all 44 flashcards in this deck.
Unlock Deck
k this deck
22
Which of the following is true when thinking about statistical significance and effect sizes?
A) A statistically significant effect will always have a meaningful effect size.
B) A statistically significant effect will usually have a large effect size.
C) A large effect size is will always be statistically significant.
D) A statistically non-significant effect can have a large effect size.
A) A statistically significant effect will always have a meaningful effect size.
B) A statistically significant effect will usually have a large effect size.
C) A large effect size is will always be statistically significant.
D) A statistically non-significant effect can have a large effect size.
Unlock Deck
Unlock for access to all 44 flashcards in this deck.
Unlock Deck
k this deck
23
Which of the following cannot properly display data on interval scales?
A) Histograms
B) Stem-and-leaf plots
C) Scatterplots
D) Contingency tables
A) Histograms
B) Stem-and-leaf plots
C) Scatterplots
D) Contingency tables
Unlock Deck
Unlock for access to all 44 flashcards in this deck.
Unlock Deck
k this deck
24
Stem-and-leaf plots are most suited for displaying data sets that are ___________ while histograms can display data sets that are ________________.
A) large; small
B) small; large
C) on an interval scale; on an ordinal scale
D) on an ordinal scale; on an interval scale
A) large; small
B) small; large
C) on an interval scale; on an ordinal scale
D) on an ordinal scale; on an interval scale
Unlock Deck
Unlock for access to all 44 flashcards in this deck.
Unlock Deck
k this deck
25
What is a guaranteed outcome of increasing your sample size?
A) Larger effect sizes and larger p-values
B) Smaller p-values and larger standard errors
C) Smaller p-values and smaller standard errors
D) Larger effect sizes and smaller standard errors
A) Larger effect sizes and larger p-values
B) Smaller p-values and larger standard errors
C) Smaller p-values and smaller standard errors
D) Larger effect sizes and smaller standard errors
Unlock Deck
Unlock for access to all 44 flashcards in this deck.
Unlock Deck
k this deck
26
The interquartile range is a measure of data skewness.
Unlock Deck
Unlock for access to all 44 flashcards in this deck.
Unlock Deck
k this deck
27
Cramer's V is a correlation-like measure of the association between two categorical variables.
Unlock Deck
Unlock for access to all 44 flashcards in this deck.
Unlock Deck
k this deck
28
Cohen's d is an unstandardized measure of effect size.
Unlock Deck
Unlock for access to all 44 flashcards in this deck.
Unlock Deck
k this deck
29
It is possible to compute the correlation of a binary variable and a continuous variable.
Unlock Deck
Unlock for access to all 44 flashcards in this deck.
Unlock Deck
k this deck
30
Once you have calculated statistical power, you can calculate the probability of a Type II error without needing any additional information from the data.
Unlock Deck
Unlock for access to all 44 flashcards in this deck.
Unlock Deck
k this deck
31
The probability of committing a Type I error is the same as the alpha level of a study.
Unlock Deck
Unlock for access to all 44 flashcards in this deck.
Unlock Deck
k this deck
32
The sampling distribution of a mean with sample size 40 has the same spread as the sampling distribution of a mean with sample size 30.
Unlock Deck
Unlock for access to all 44 flashcards in this deck.
Unlock Deck
k this deck
33
For sampling distributions, a larger sample size gives a more precise estimate of the mean.
Unlock Deck
Unlock for access to all 44 flashcards in this deck.
Unlock Deck
k this deck
34
Sampling distributions of means will always tend towards a normal distribution with increasing sample size, even if the distribution of the underlying population is bimodal.
Unlock Deck
Unlock for access to all 44 flashcards in this deck.
Unlock Deck
k this deck
35
The p value is a conditional probability that is independent of sample size.
Unlock Deck
Unlock for access to all 44 flashcards in this deck.
Unlock Deck
k this deck
36
To be able to conduct a power analysis while designing a study, you first need to have an idea of the size of the effect that you are studying.
Unlock Deck
Unlock for access to all 44 flashcards in this deck.
Unlock Deck
k this deck
37
A histogram displays the frequency of data that fall within pre-defined ranges.
Unlock Deck
Unlock for access to all 44 flashcards in this deck.
Unlock Deck
k this deck
38
Outliers are not displayed in a box-and-whisker plot.
Unlock Deck
Unlock for access to all 44 flashcards in this deck.
Unlock Deck
k this deck
39
Box-and-whisker plots are most suited for displaying ordinal data.
Unlock Deck
Unlock for access to all 44 flashcards in this deck.
Unlock Deck
k this deck
40
The data below are from Jason's study measuring how much college students use social media per week (in hours):
0; 0; 3; 3; 7; 7; 7; 11; 12; 15; 15; 18; 21; 23; 23; 28; 30; 31; 31; 35
Display the data in a stem-and-leaf plot and a histogram. List an advantage and disadvantage of using a stem-and-leaf plot.
0; 0; 3; 3; 7; 7; 7; 11; 12; 15; 15; 18; 21; 23; 23; 28; 30; 31; 31; 35
Display the data in a stem-and-leaf plot and a histogram. List an advantage and disadvantage of using a stem-and-leaf plot.
Unlock Deck
Unlock for access to all 44 flashcards in this deck.
Unlock Deck
k this deck
41
Phoebe has analyzed her data under the null hypothesis significance testing (NHST) framework and found a p value of 0.06 and a Cohen's d of 0.5. Explain what this result means.
Unlock Deck
Unlock for access to all 44 flashcards in this deck.
Unlock Deck
k this deck
42
The plot below describes the relationship between the time spent in hours watching television per week (y-axis) and the time it takes to run half a mile in minutes (x-axis) in a sample of individuals.
Does the graph illustrate a univariate or bivariate display? What does the graph tell you about the relationship between the two variables?
Does the graph illustrate a univariate or bivariate display? What does the graph tell you about the relationship between the two variables? Unlock Deck
Unlock for access to all 44 flashcards in this deck.
Unlock Deck
k this deck
43
State two criticisms of null hypothesis significance testing and a solution to each of the criticisms.
Unlock Deck
Unlock for access to all 44 flashcards in this deck.
Unlock Deck
k this deck
44
Define a confidence interval. Describe the relationship between the width of a confidence interval and sample size, and the relationship between p values and sample size.
Unlock Deck
Unlock for access to all 44 flashcards in this deck.
Unlock Deck
k this deck
Unlock Deck
Unlock for access to all 44 flashcards in this deck.


