Exam 13: Analyzing Your Data I: an Overview
Exam 1: Introduction to Research Methods44 Questions
Exam 2: The Ethical Imperative45 Questions
Exam 3: Negotiating the Institutional Review Board Process45 Questions
Exam 4: Starting Your Research45 Questions
Exam 5: Focusing Your Question and Choosing a Design43 Questions
Exam 6: Developing Your Research Protocol44 Questions
Exam 7: Survey and Interview Approaches30 Questions
Exam 8: Experimental Designs43 Questions
Exam 9: Variations on Experimental Designs42 Questions
Exam 10: Observation, Case Studies, Archival Research, and Meta-Analysis45 Questions
Exam 11: Neuroscience Methods45 Questions
Exam 12: Research Over Age and Time44 Questions
Exam 13: Analyzing Your Data I: an Overview44 Questions
Exam 14: Analyzing Your Data II: Specific Approaches45 Questions
Exam 15: Writing up Your Results46 Questions
Exam 16: Publishing Your Research43 Questions
Select questions type
Consider the histogram below. Which of the following statements is necessarily true? 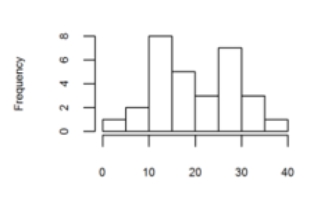
Free
(Multiple Choice)
4.8/5  (40)
(40)
Correct Answer: Verified
B
Why should a power analysis be done while designing the study (i.e., before data collection)?
Free
(Multiple Choice)
4.8/5 (38)
Correct Answer:Verified
D
Cramer's V is a correlation-like measure of the association between two categorical variables.
Free
(True/False)
4.7/5 (37)
Correct Answer:Verified
True
It is possible to compute the correlation of a binary variable and a continuous variable.
(True/False)
4.8/5 (36)
Box-and-whisker plots are most suited for displaying ordinal data.
(True/False)
4.8/5 (32)
When comparing two studies measuring the same phenomenon, the study with a statistical power of 0.5 is more likely to ________________________ than the study with a statistical power of 0.8.
(Multiple Choice)
4.9/5 (32)
Which of the following piece(s) of information is/are available from a stem-and-leaf plot?
(Multiple Choice)
4.7/5 (38)
Once you have calculated statistical power, you can calculate the probability of a Type II error without needing any additional information from the data.
(True/False)
4.8/5 (34)
The sampling distribution of a mean with sample size 40 has the same spread as the sampling distribution of a mean with sample size 30.
(True/False)
5.0/5 (36)
To be able to conduct a power analysis while designing a study, you first need to have an idea of the size of the effect that you are studying.
(True/False)
4.9/5 (46)
Jessica wants to ensure that her study has sufficient statistical power so that she has a good chance of rejecting the null hypothesis in the event that it is actually false. She would like to reduce the chances of a:
(Multiple Choice)
4.8/5 (37)
Cohen's d is seen as advantageous over calculating the difference in means of two groups as a measure of effect size because:
(Multiple Choice)
4.9/5 (41)
Phoebe has analyzed her data under the null hypothesis significance testing (NHST) framework and found a p value of 0.06 and a Cohen's d of 0.5. Explain what this result means.
(Essay)
4.8/5 (27)
A histogram displays the frequency of data that fall within pre-defined ranges.
(True/False)
4.9/5 (31)
The sampling distribution of means with a sample size of 1000 obtained from a population with a trimodal distribution (i.e., three modes) will…
(Multiple Choice)
4.8/5 (34)
Filters
- Essay(0)
- Multiple Choice(0)
- Short Answer(0)
- True False(0)
- Matching(0)