Deck 6: Analysis of Variance, and Hypothesis Testing With Categorical Data: Chi Square
Full screen (f)
Question
Question
You've learned in your criminology class that low self-control is, according to Gottfredson and Hirschi (1990), a strong predictor for criminal behavior. You have administered a survey with a random sample of 350 high school students determining their level of self-control and you have categorized your findings into low self-control and high self-control. You also asked the participants whether they have ever been in contact with the criminal justice system (yes/no). Now you want to learn whether there is indeed a relationship between low self-control and criminal behavior. The results of your survey are presented in the table below. You set your alpha level at 0.05.
a. .Identify the independent and dependent variables and indicate the level of measurement for each variable.
b. Compute the percentages for every cell.
c. State your null hypothesis and your alternative hypotheses.
d. Compute the degrees of freedom.
e. State your decision rule.
f. Compute expected frequencies for each cell.
g. Compute chi square.
h.Interpret your findings.
Question
You want to determine whether gender has an impact on attitudes toward police. You conduct a survey with a random sample of 220 individuals over the age of 18 asking your participants about their attitudes about police (positive/negative). The results are presented in the table below. You set your alpha level at 0.01.
a. Identify the independent and dependent variables and indicate the level of measurement for each variable.
b. Compute the percentages for every cell.
c. State your null hypothesis and your alternative hypotheses.
d. Compute the degrees of freedom.
e. State your decision rule
f. Compute expected frequencies for each cell.
g. Compute chi square.
h.Interpret your findings.
Question
Now that you know about the attitudes of females and males toward police, you want to find whether there is also a relationship between gender (female/male) and official complaints filed (yes/no) after a citizen-police encounter. You send a follow-up survey to the participants already interviewed and 198 of 220 agree to answer the question of whether they have ever filed an official complaint after a citizen-police encounter (yes/no). The results are listed in the table below. This time you select an alpha level of 0.05.
a. Identify the independent and dependent variables and indicate the level of measurement for each variable.
b. Compute the percentages for every cell.
c. State your null hypothesis and your alternative hypothesis.
d. Compute the degrees of freedom.
e. State your decision rule.
f. Compute expected frequencies for each cell.
g. Compute chi square.
h. Interpret your findings.
Question
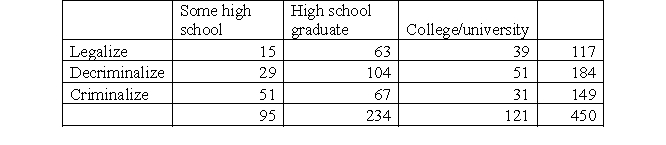
Prostitution is illegal in all states of the United States (except in some counties in Nevada). You are interested to find whether there is a relationship between gender (male/female/transgender) and attitudes regarding the legal status of prostitution (legalize/decriminalize/criminalize). You draw a random sample of 450 individuals over the age of 18 who are residents of Texas. The results of your survey are presented below. You set an alpha level of 0.05.
a. Identify the independent and dependent variables and indicate the level of measurement.
b. Compute the percentages for every cell.
c. State your null hypothesis and your alternative hypothesis.
d. Compute the degrees of freedom.
e. State your decision rule.
f. Compute expected frequencies for each cell.
g. Compute chi square.
h. Interpret your findings.
Question
Question
Question
Question
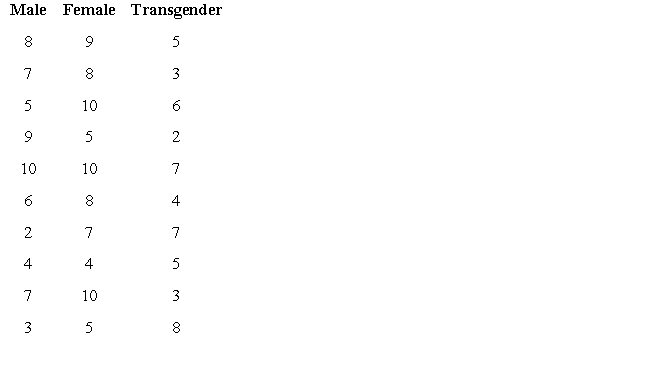
Although the social climate surrounding sexual identity is slowly changing toward more tolerance, individuals who are female or transsexual still experience stigma regarding their sexual identity. Assume you have a master list of students enrolled in a large public high school in Portland (OR) and the list also includes their sexual identity. You randomly select 10 students who self-identify as female, 10 who self-identify as male, and 10 who self-identify as transgender. You want to know how accepted they feel by their teachers (with 1 indicating feeling marginalized and 10 indicating a feeling of being 100% accepted). You select an alpha level of 0.05. The results are presented in the table below.
a. What is the IV and what is the DV? Also indicate the level of measurement for each variable.
b. State your null and alternative hypotheses.
c. Compute:
i. The group mean.
ii. Grand mean.
iii. Standard deviation for each group.
iv. Sum of squares.
v. The degrees of freedom (within and between).
vi. F.
d. State the decision rule.
e. Make a decision and interpret your findings.
f. Use the Scheffé test to determine which means (if any) significantly differ from each other.
Question
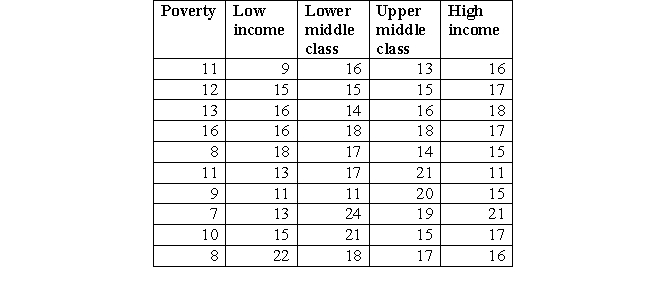
We know from research that poverty is a criminogenic risk factor. You select a random sample of 50 adolescents (age 24 and younger) with a criminal record who are still living with their parents from a diverse neighborhood in Orlando (FL) (with known household income/year). You group them into four categories: poverty ($0-$23,000; low income ($23,001-$35,000); lower middle class ($35,000-$55,000); upper middle class ($55,001-$150,000), and high income ($150,001+). You are interested to find whether the average age of onset (understood as a conviction; FL has no minimum age for criminal responsibility) varies between individuals from different socioeconomic backgrounds. You select an alpha level of 0.05. The results are to be found in the table below.
a. What is the IV and what is the DV? Also indicate the level of measurement for each variable.
b. State your null and alternative hypotheses.
c. Compute:
i. The group mean.
ii. Grand mean.
iii. Standard deviation for each group.
iv. Sum of squares.
v. The degrees of freedom (within and between).
vi. F.
d. State the decision rule
e. Make a decision and interpret your findings.
f. Use the Scheffé test to determine which means (if any) significantly differ from each other.
Question
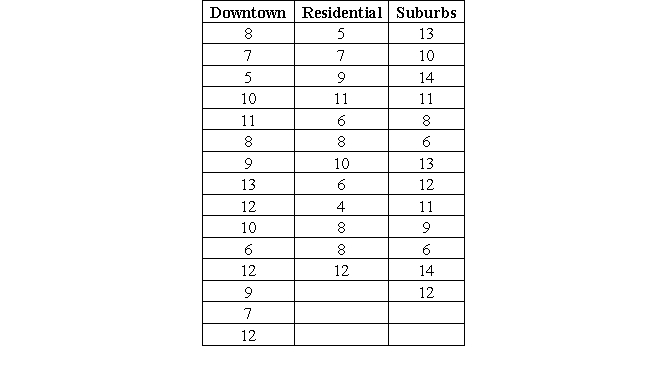
Building on Burgess's (1925) concentric zone theory, Shaw and McKay (1930) developed social disorganization theory. Social disorganization of neighborhoods is, according to Shaw and McKay (1942), characterized by a combination of persistent poverty, racial/ethnical heterogeneity, transiency (rapid/frequent population turnover), and urbanism, which in turn is fueling the disruption of core social institutions, such as the family, the church community, and schools. It was hypothesized that crime is more likely to occur in the core of the city and the enclosing zone in transition, with crime decreasing with the distance from the center. In the contemporary United States, an invert trend can be witnessed. Urban revitalization appears to invert Burgess's concentric zone theory and Shaw and McKay's (1930) social disorganization theory, with more and more wealthy and educated individuals moving back into the core. You want to test this inverse trend by analyzing the levels of perceived neighborhood problems (using a scale of 1-15, where 15 represents the highest level of perceived neighborhood problems) of a random sample of 40 individuals living in Minneapolis and its suburbs. Although Burgess's concentric zone theory entails five zones (central business district, zone in transition, working man, residential, and commuter), you decide to compare the mean levels of perceived neighborhood problems of residents from downtown, residential areas, and suburbs. You select an alpha level of 0.05. The descriptive information is presented in the table below.
a. Indicate which variable is the IV and which is the DV. Also indicate the level of measurement for each variable.
b. State your null and alternative hypotheses.
c. Compute:
i. The group mean.
ii. Grand mean.
iii. Standard deviation for each group.
iv. Sum of squares.
v. The degrees of freedom (within and between).
vi.f
d. State the decision rule
e. Make a decision and interpret your findings.

Unlock Deck
Sign up to unlock the cards in this deck!
Unlock Deck
Unlock Deck
1/11
Play
Full screen (f)
Deck 6: Analysis of Variance, and Hypothesis Testing With Categorical Data: Chi Square
1
Let's assume that you want to examine the relationship between the number of times a person has been bullied in his/her entire life and his/her level of self-esteem (low, moderate, high). You are not quite sure which statistical test of significance you want to use but decide to go with a chi square test of independence because the formulas are more understandable to you.
a. Identify the IV and indicate the level of measurement.
b. Identify the DV and indicate the level of measurement.
c. Reflect on your decision and state whether the test you chose has been the most appropriate one to use. Also, explain your decision.
a. Identify the IV and indicate the level of measurement.
b. Identify the DV and indicate the level of measurement.
c. Reflect on your decision and state whether the test you chose has been the most appropriate one to use. Also, explain your decision.
a. The IV is the number of times one has been bullied in his/her entire life. The variable is continuous (ratio).
b. The DV is the level of self-esteem (low, moderate, and high). The variable is categorical (ordinal).
c. Chi square is not an appropriate test to use because the IV is continuous, which would allow us to use a more sophisticated test of significance (such as z, t, ANOVA). Although it would be (theoretically) possible to utilize chi square, it is not recommended. As we learned in this chapter, chi square is less powerful than parametric tests (z, t, ANOVA). Next, when utilizing chi square it is less likely that we will reject our null hypothesis and thus it is more likely for us to commit a type II error.
2
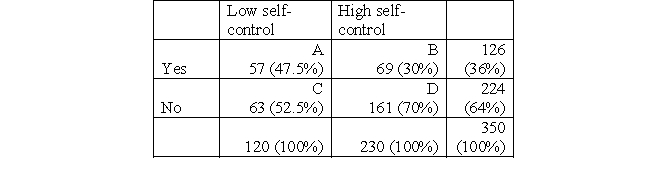
You've learned in your criminology class that low self-control is, according to Gottfredson and Hirschi (1990), a strong predictor for criminal behavior. You have administered a survey with a random sample of 350 high school students determining their level of self-control and you have categorized your findings into low self-control and high self-control. You also asked the participants whether they have ever been in contact with the criminal justice system (yes/no). Now you want to learn whether there is indeed a relationship between low self-control and criminal behavior. The results of your survey are presented in the table below. You set your alpha level at 0.05.
a. .Identify the independent and dependent variables and indicate the level of measurement for each variable.
b. Compute the percentages for every cell.
c. State your null hypothesis and your alternative hypotheses.
d. Compute the degrees of freedom.
e. State your decision rule.
f. Compute expected frequencies for each cell.
g. Compute chi square.
h.Interpret your findings.
a. IV = level of self-control (ordinal).
DV = ever in contact with the criminal justice system (nominal).
b.
c. H0: There is no relationship between one's level of self-control and criminal behavior.
H1: There is a relationship between one's level of self-control and criminal behavior.
d. df = (c - 1)(r - 1) = (2 - 1)(2 - 1) = 1.
e. You reject the null hypothesis if x2 is greater than 3.841.
f. E(A) = (120 × 126)/350 = 43.2
E(B) = (230 × 126)/350 = 82.8
E(C) = (120 × 224)/350 = 76.8
E(D) = (230 × 224)/350 = 147.2
g.
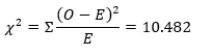
h. You reject the null hypothesis (alpha 0.05) because x2 (10.48) is greater than 3.841, meaning that there is a statistically significant relationship between one's level of self-control and criminal behavior, χ2(1) = 10.48, p < 0.05. Although 47.5% of high school students with a low level of self-control have been in contact with the criminal justice system, only 30% of high-school students with a high level of self-control have been. You select an alpha level of 0.05.
DV = ever in contact with the criminal justice system (nominal).
b.
c. H0: There is no relationship between one's level of self-control and criminal behavior.
H1: There is a relationship between one's level of self-control and criminal behavior.
d. df = (c - 1)(r - 1) = (2 - 1)(2 - 1) = 1.
e. You reject the null hypothesis if x2 is greater than 3.841.
f. E(A) = (120 × 126)/350 = 43.2
E(B) = (230 × 126)/350 = 82.8
E(C) = (120 × 224)/350 = 76.8
E(D) = (230 × 224)/350 = 147.2
g.
h. You reject the null hypothesis (alpha 0.05) because x2 (10.48) is greater than 3.841, meaning that there is a statistically significant relationship between one's level of self-control and criminal behavior, χ2(1) = 10.48, p < 0.05. Although 47.5% of high school students with a low level of self-control have been in contact with the criminal justice system, only 30% of high-school students with a high level of self-control have been. You select an alpha level of 0.05.
3
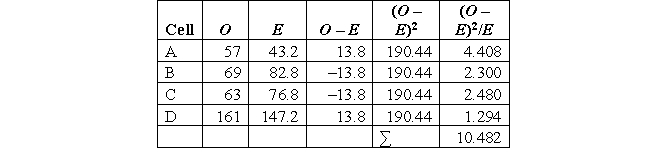
You want to determine whether gender has an impact on attitudes toward police. You conduct a survey with a random sample of 220 individuals over the age of 18 asking your participants about their attitudes about police (positive/negative). The results are presented in the table below. You set your alpha level at 0.01.
a. Identify the independent and dependent variables and indicate the level of measurement for each variable.
b. Compute the percentages for every cell.
c. State your null hypothesis and your alternative hypotheses.
d. Compute the degrees of freedom.
e. State your decision rule
f. Compute expected frequencies for each cell.
g. Compute chi square.
h.Interpret your findings.
a. IV = gender: male, female (nominal).
DV = attitudes toward police: positive, negative (nominal).
b.
c. H0: There is no relationship between one's gender and one's attitudes toward police.
H1: There is a relationship between one's gender and one's attitudes toward police.
d. df = (c - 1)(r - 1) = (2 - 1)(2 - 1) = 1.
e. You reject the null hypothesis if x2 is greater than 6.635.
f. E(A) = (99 × 119)/220 = 53.55
E(B) = (121 × 119)/220 = 65.45
E(C) = (99 × 101)/220 = 45.45
E(D) = (121 × 101)/220 = 55.55
g.
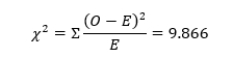
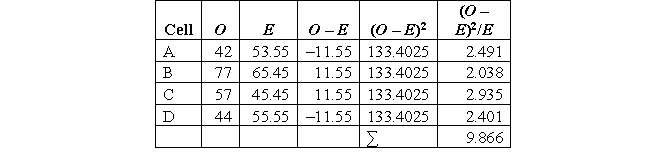
h. You reject the null hypothesis (α = 0.01) because χ2 (9.866) is greater than 6.635, meaning that there is a statistically significant relationship between one's gender and one's attitudes toward police (x2(1) = 9.866, p < 0.01). Whereas 42.42% of males hold positive attitudes toward police, 63.64% of females expressed positive attitudes toward police.
DV = attitudes toward police: positive, negative (nominal).
b.
c. H0: There is no relationship between one's gender and one's attitudes toward police.
H1: There is a relationship between one's gender and one's attitudes toward police.
d. df = (c - 1)(r - 1) = (2 - 1)(2 - 1) = 1.
e. You reject the null hypothesis if x2 is greater than 6.635.
f. E(A) = (99 × 119)/220 = 53.55
E(B) = (121 × 119)/220 = 65.45
E(C) = (99 × 101)/220 = 45.45
E(D) = (121 × 101)/220 = 55.55
g.
h. You reject the null hypothesis (α = 0.01) because χ2 (9.866) is greater than 6.635, meaning that there is a statistically significant relationship between one's gender and one's attitudes toward police (x2(1) = 9.866, p < 0.01). Whereas 42.42% of males hold positive attitudes toward police, 63.64% of females expressed positive attitudes toward police.
4
Now that you know about the attitudes of females and males toward police, you want to find whether there is also a relationship between gender (female/male) and official complaints filed (yes/no) after a citizen-police encounter. You send a follow-up survey to the participants already interviewed and 198 of 220 agree to answer the question of whether they have ever filed an official complaint after a citizen-police encounter (yes/no). The results are listed in the table below. This time you select an alpha level of 0.05.
a. Identify the independent and dependent variables and indicate the level of measurement for each variable.
b. Compute the percentages for every cell.
c. State your null hypothesis and your alternative hypothesis.
d. Compute the degrees of freedom.
e. State your decision rule.
f. Compute expected frequencies for each cell.
g. Compute chi square.
h. Interpret your findings.
Unlock Deck
Unlock for access to all 11 flashcards in this deck.
Unlock Deck
k this deck
5
Prostitution is illegal in all states of the United States (except in some counties in Nevada). You are interested to find whether there is a relationship between gender (male/female/transgender) and attitudes regarding the legal status of prostitution (legalize/decriminalize/criminalize). You draw a random sample of 450 individuals over the age of 18 who are residents of Texas. The results of your survey are presented below. You set an alpha level of 0.05.
a. Identify the independent and dependent variables and indicate the level of measurement.
b. Compute the percentages for every cell.
c. State your null hypothesis and your alternative hypothesis.
d. Compute the degrees of freedom.
e. State your decision rule.
f. Compute expected frequencies for each cell.
g. Compute chi square.
h. Interpret your findings.
a. Identify the independent and dependent variables and indicate the level of measurement.
b. Compute the percentages for every cell.
c. State your null hypothesis and your alternative hypothesis.
d. Compute the degrees of freedom.
e. State your decision rule.
f. Compute expected frequencies for each cell.
g. Compute chi square.
h. Interpret your findings.
Unlock Deck
Unlock for access to all 11 flashcards in this deck.
Unlock Deck
k this deck
6
You rejected the null hypothesis for the following cases (2 × 2 tables) and thus found a real difference between the sample means. However, you want to know how strong the relationship is.
a. Determine which test of association is appropriate for a chi square with two variables with two categories.
b. Compute the strength of the relationship for the following and interpret your results.
i. χ2 = 4.235; n = 153
ii. χ2 = 18.567; n = 215
iii. χ2 = 3.898; n = 310
iv. χ2 = 22.33; n = 146
v. χ2 = 10.659; n = 189
vi. χ2 = 29.66; n = 195
Unlock Deck
Unlock for access to all 11 flashcards in this deck.
Unlock Deck
k this deck
7
You calculated chi square for several cases that have a table greater than 2 × 2. To determine the strength of the relationship, calculate Cramer's V and interpret your results.
a. χ2 = 39.56; n = 166; 3 rows and 3 columns
b. χ2 = 22.15; n = 123; 2 rows and 3 columns
c. χ2 = 15.26; n = 213; 4 rows and 3 columns
d. χ2 = 44.13; n = 286; 3 rows and 5 columns
e. χ2 = 10.22; n = 145; 3 rows and 4 columns
f. χ2 = 29.36; n = 226; 6 rows and 5 columns
a. χ2 = 39.56; n = 166; 3 rows and 3 columns
b. χ2 = 22.15; n = 123; 2 rows and 3 columns
c. χ2 = 15.26; n = 213; 4 rows and 3 columns
d. χ2 = 44.13; n = 286; 3 rows and 5 columns
e. χ2 = 10.22; n = 145; 3 rows and 4 columns
f. χ2 = 29.36; n = 226; 6 rows and 5 columns
Unlock Deck
Unlock for access to all 11 flashcards in this deck.
Unlock Deck
k this deck
8
Let's assume you randomly draw three samples of correction officers from a single facility (50 black/50 white/50 other). You aim to find whether they have ever been a victim of sexual assault or harassment within the correction facility (yes/no). Your friend tells you to run an ANOVA to determine whether there is a difference between white, black, and other correction officers. Will you follow your friends' suggestion? Explain.
Unlock Deck
Unlock for access to all 11 flashcards in this deck.
Unlock Deck
k this deck
9
Although the social climate surrounding sexual identity is slowly changing toward more tolerance, individuals who are female or transsexual still experience stigma regarding their sexual identity. Assume you have a master list of students enrolled in a large public high school in Portland (OR) and the list also includes their sexual identity. You randomly select 10 students who self-identify as female, 10 who self-identify as male, and 10 who self-identify as transgender. You want to know how accepted they feel by their teachers (with 1 indicating feeling marginalized and 10 indicating a feeling of being 100% accepted). You select an alpha level of 0.05. The results are presented in the table below.
a. What is the IV and what is the DV? Also indicate the level of measurement for each variable.
b. State your null and alternative hypotheses.
c. Compute:
i. The group mean.
ii. Grand mean.
iii. Standard deviation for each group.
iv. Sum of squares.
v. The degrees of freedom (within and between).
vi. F.
d. State the decision rule.
e. Make a decision and interpret your findings.
f. Use the Scheffé test to determine which means (if any) significantly differ from each other.
a. What is the IV and what is the DV? Also indicate the level of measurement for each variable.
b. State your null and alternative hypotheses.
c. Compute:
i. The group mean.
ii. Grand mean.
iii. Standard deviation for each group.
iv. Sum of squares.
v. The degrees of freedom (within and between).
vi. F.
d. State the decision rule.
e. Make a decision and interpret your findings.
f. Use the Scheffé test to determine which means (if any) significantly differ from each other.
Unlock Deck
Unlock for access to all 11 flashcards in this deck.
Unlock Deck
k this deck
10
We know from research that poverty is a criminogenic risk factor. You select a random sample of 50 adolescents (age 24 and younger) with a criminal record who are still living with their parents from a diverse neighborhood in Orlando (FL) (with known household income/year). You group them into four categories: poverty ($0-$23,000; low income ($23,001-$35,000); lower middle class ($35,000-$55,000); upper middle class ($55,001-$150,000), and high income ($150,001+). You are interested to find whether the average age of onset (understood as a conviction; FL has no minimum age for criminal responsibility) varies between individuals from different socioeconomic backgrounds. You select an alpha level of 0.05. The results are to be found in the table below.
a. What is the IV and what is the DV? Also indicate the level of measurement for each variable.
b. State your null and alternative hypotheses.
c. Compute:
i. The group mean.
ii. Grand mean.
iii. Standard deviation for each group.
iv. Sum of squares.
v. The degrees of freedom (within and between).
vi. F.
d. State the decision rule
e. Make a decision and interpret your findings.
f. Use the Scheffé test to determine which means (if any) significantly differ from each other.
a. What is the IV and what is the DV? Also indicate the level of measurement for each variable.
b. State your null and alternative hypotheses.
c. Compute:
i. The group mean.
ii. Grand mean.
iii. Standard deviation for each group.
iv. Sum of squares.
v. The degrees of freedom (within and between).
vi. F.
d. State the decision rule
e. Make a decision and interpret your findings.
f. Use the Scheffé test to determine which means (if any) significantly differ from each other.
Unlock Deck
Unlock for access to all 11 flashcards in this deck.
Unlock Deck
k this deck
11
Building on Burgess's (1925) concentric zone theory, Shaw and McKay (1930) developed social disorganization theory. Social disorganization of neighborhoods is, according to Shaw and McKay (1942), characterized by a combination of persistent poverty, racial/ethnical heterogeneity, transiency (rapid/frequent population turnover), and urbanism, which in turn is fueling the disruption of core social institutions, such as the family, the church community, and schools. It was hypothesized that crime is more likely to occur in the core of the city and the enclosing zone in transition, with crime decreasing with the distance from the center. In the contemporary United States, an invert trend can be witnessed. Urban revitalization appears to invert Burgess's concentric zone theory and Shaw and McKay's (1930) social disorganization theory, with more and more wealthy and educated individuals moving back into the core. You want to test this inverse trend by analyzing the levels of perceived neighborhood problems (using a scale of 1-15, where 15 represents the highest level of perceived neighborhood problems) of a random sample of 40 individuals living in Minneapolis and its suburbs. Although Burgess's concentric zone theory entails five zones (central business district, zone in transition, working man, residential, and commuter), you decide to compare the mean levels of perceived neighborhood problems of residents from downtown, residential areas, and suburbs. You select an alpha level of 0.05. The descriptive information is presented in the table below.
a. Indicate which variable is the IV and which is the DV. Also indicate the level of measurement for each variable.
b. State your null and alternative hypotheses.
c. Compute:
i. The group mean.
ii. Grand mean.
iii. Standard deviation for each group.
iv. Sum of squares.
v. The degrees of freedom (within and between).
vi.f
d. State the decision rule
e. Make a decision and interpret your findings.
a. Indicate which variable is the IV and which is the DV. Also indicate the level of measurement for each variable.
b. State your null and alternative hypotheses.
c. Compute:
i. The group mean.
ii. Grand mean.
iii. Standard deviation for each group.
iv. Sum of squares.
v. The degrees of freedom (within and between).
vi.f
d. State the decision rule
e. Make a decision and interpret your findings.
Unlock Deck
Unlock for access to all 11 flashcards in this deck.
Unlock Deck
k this deck
Unlock Deck
Unlock for access to all 11 flashcards in this deck.


