Deck 5: Demand Estimation
Full screen (f)
Question
Question
Question
Question
Question
Question
Question
Question
Question
Question
Question
Question
Question
Question
Question
Question
Question
Question
Question
The scatter diagram represents a data set and a plot of the simple linear regression equation estimated from the data. The diagram shows evidence of
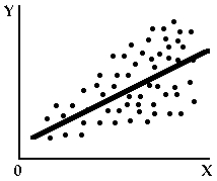
A) homoscedasticity.
B) heteroscedasticity.
C) positive autocorrelation.
D) negative autocorrelation.
A) homoscedasticity.
B) heteroscedasticity.
C) positive autocorrelation.
D) negative autocorrelation.
Question
The scatter diagram represents the error terms from a simple linear regression estimated from time-series data. The error terms are plotted against time. The diagram shows evidence of
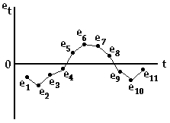
A) homoscedasticity.
B) heteroscedasticity.
C) positive autocorrelation.
D) negative autocorrelation.
A) homoscedasticity.
B) heteroscedasticity.
C) positive autocorrelation.
D) negative autocorrelation.
Question
Question
Question
Question
Question
Question
Question
Question
Question
Question
Question
Question
Question
Question
Question
Question
Question
Question
Question
Question
Question
Question
Question
Question
Question
Question
Question
Question
Question
Question
Question
Question
Question
Question
Question
Question
Question
Question
Question
Question
Question
Question
Question
Question
Question
Question
Question
Question
Question
Question
Question
Question
Question
Question
Question
Question
Question
Question
Question
Question

Unlock Deck
Sign up to unlock the cards in this deck!
Unlock Deck
Unlock Deck
1/119
Play
Full screen (f)
Deck 5: Demand Estimation
1
The identification problem would not prevent estimation of a demand curve from price and quantity data if, over the time period sampled, the only thing that varied was the
A) technology of production.
B) level of consumer income.
C) price(s) of substitutes and complements.
D) level of advertising expenditures.
A) technology of production.
B) level of consumer income.
C) price(s) of substitutes and complements.
D) level of advertising expenditures.
technology of production.
2
The identification problem would prevent estimation of a demand curve from price and quantity data if, over the time period sampled, the only thing that varied was the
A) technology of production.
B) price(s) of raw materials.
C) level of consumer income.
D) rental cost of capital.
A) technology of production.
B) price(s) of raw materials.
C) level of consumer income.
D) rental cost of capital.
level of consumer income.
3
If the t ratio for the slope of a simple linear regression equation is equal to 3.614 and the critical values of the t distribution at the 1 percent and 5 percent levels of significance, respectively, are 3.499 and 2.365, then the slope is
A) not significantly different from zero.
B) significantly different from zero at both the 1 percent and the 5 percent levels.
C) significantly different from zero at the 1 percent level but not at the 5 percent level.
D) significantly different from zero at the 5 percent level but not at the 1 percent level.
significantly different from zero at both the 1 percent and the 5 percent levels.
4
Application of simple linear regression analysis to the estimation of a demand equation has yielded the following:
Q = 24 - 2P
If the current product price is P = $6 and the quantity sold per time period is Q = 10, then the error (e) for the current time period is equal to
A) 1.
B) -1.
C) 2.
D) -2.
Q = 24 - 2P
If the current product price is P = $6 and the quantity sold per time period is Q = 10, then the error (e) for the current time period is equal to
A) 1.
B) -1.
C) 2.
D) -2.
Unlock Deck
Unlock for access to all 119 flashcards in this deck.
Unlock Deck
k this deck
5
If the t ratio for the slope of a simple linear regression equation is equal to 1.614 and the critical values of the t distribution at the 1 percent and 5 percent levels of significance, respectively, are 3.499 and 2.365, then the slope is
A) not significantly different from zero.
B) significantly different from zero at both the 1 percent and the 5 percent levels.
C) significantly different from zero at the 1 percent level but not at the 5 percent level.
D) significantly different from zero at the 5 percent level but not at the 1 percent level.
Unlock Deck
Unlock for access to all 119 flashcards in this deck.
Unlock Deck
k this deck
6
A multiple regression analysis based on a data set that consists of 30 observations yielded the following estimated equation:
Q = 120 - 1.1P + 3.7I + 0.90A
Where P is price, I is income, and A is advertising. If the coefficient of determination is 0.80, then the adjusted coefficient of determination is
A) 0.84.
B) 0.78.
C) 0.62.
D) 1.04.
Q = 120 - 1.1P + 3.7I + 0.90A
Where P is price, I is income, and A is advertising. If the coefficient of determination is 0.80, then the adjusted coefficient of determination is
A) 0.84.
B) 0.78.
C) 0.62.
D) 1.04.
Unlock Deck
Unlock for access to all 119 flashcards in this deck.
Unlock Deck
k this deck
7
A multiple regression analysis based on a data set that consists of 30 observations yielded the following estimated equation:
Q = 120 - 1.1P + 3.7I + 0.09A
Where P is price, I is income, and A is advertising. If the coefficient of determination is 0.80, then the F statistic is
A) 34.67.
B) 29.35.
C) 21.23.
D) 4.67.
Q = 120 - 1.1P + 3.7I + 0.09A
Where P is price, I is income, and A is advertising. If the coefficient of determination is 0.80, then the F statistic is
A) 34.67.
B) 29.35.
C) 21.23.
D) 4.67.
Unlock Deck
Unlock for access to all 119 flashcards in this deck.
Unlock Deck
k this deck
8
A simple linear regression analysis based on a data set that consists of 20 observations yielded the following estimated equation:
Q = 120 - 3.6P
If the coefficient of determination is 0.81, then the correlation coefficient is equal to
A) 0.81.
B) -0.81.
C) -0.90.
D) 0.90.
Q = 120 - 3.6P
If the coefficient of determination is 0.81, then the correlation coefficient is equal to
A) 0.81.
B) -0.81.
C) -0.90.
D) 0.90.
Unlock Deck
Unlock for access to all 119 flashcards in this deck.
Unlock Deck
k this deck
9
A multiple regression analysis based on a data set that consists of 30 observations yielded the following estimated demand equation:
Q = 120 - 1.1P + 0.04I + 0.90A
Where P is price, I is income, and A is advertising. If price is equal to $1,000, income is equal to $20,000, and advertising expenditures are equal to $5,000, then the predicted quantity demanded (Q) is
A) 6,520.
B) 4,320.
C) 8,015.
D) None of these answers is correct.
Unlock Deck
Unlock for access to all 119 flashcards in this deck.
Unlock Deck
k this deck
10
A multiple regression analysis based on a data set that consists of 500 observations yielded the following estimated demand equation:
Q = 120 - 1.1P + 0.04I + 0.90A - 0.04PZ
Where P is price, I is income, A is advertising, and PZ is the price of a related good. If the standard errors of the independent variables are 0.25, 0.5, 0.3, and 0.01, respectively, which of the four variables should be dropped from the equation?
A) P
B) I
C) A
D) PZ
Unlock Deck
Unlock for access to all 119 flashcards in this deck.
Unlock Deck
k this deck
11
The F statistic calculated from a multiple regression analysis is equal to 1.96. If the critical values of the F distribution are 2.42 and 3.47 at the 5 percent and 1 percent levels of significance, respectively, then
A) at least one of the slope coefficients is significantly different from zero.
B) none of the slope coefficients is significantly different from zero.
C) all of the slope coefficients are significantly different from zero.
D) no more than 5 percent (1 out of 20) of the slope coefficients are different from zero.
Unlock Deck
Unlock for access to all 119 flashcards in this deck.
Unlock Deck
k this deck
12
The F statistic calculated from a multiple regression analysis is equal to 5.96. If the critical values of the F distribution are 2.42 and 3.47 at the 5 percent and 1 percent levels of significance, respectively, then
A) at least one of the slope coefficients is significantly different from zero.
B) none of the slope coefficients is significantly different from zero.
C) all of the slope coefficients are significantly different from zero.
D) no more than 5 percent (1 out of 20) of the slope coefficients are different from zero.
Unlock Deck
Unlock for access to all 119 flashcards in this deck.
Unlock Deck
k this deck
13
The application of multiple regression analysis to a time-series data set yields a calculated Durbin-Watson statistic that is equal to 2.00. From this result, it is clear that
A) multicollinearity is present.
B) multicollinearity is absent.
C) autocorrelation is present.
D) autocorrelation is absent.
A) multicollinearity is present.
B) multicollinearity is absent.
C) autocorrelation is present.
D) autocorrelation is absent.
Unlock Deck
Unlock for access to all 119 flashcards in this deck.
Unlock Deck
k this deck
14
The application of multiple regression analysis to a time-series data set yields a calculated Durbin-Watson statistic that is equal to 1.00. If the lower test value at the 1 percent level is 1.28 and the upper value is 1.51, then
A) there is no evidence of a problem.
B) there is some evidence of a problem, but it is not significant.
C) there is evidence of a significant problem.
D) there is not sufficient information to determine whether or not there is a problem.
A) there is no evidence of a problem.
B) there is some evidence of a problem, but it is not significant.
C) there is evidence of a significant problem.
D) there is not sufficient information to determine whether or not there is a problem.
Unlock Deck
Unlock for access to all 119 flashcards in this deck.
Unlock Deck
k this deck
15
The application of multiple regression analysis to a time-series data set yields a calculated Durbin-Watson statistic that is equal to 1.00. If the lower test value at the 1 percent level is 1.28 and the upper value is 1.51, then there is evidence that
A) multicollinearity is present.
B) multicollinearity is absent.
C) autocorrelation is present.
D) autocorrelation is absent.
A) multicollinearity is present.
B) multicollinearity is absent.
C) autocorrelation is present.
D) autocorrelation is absent.
Unlock Deck
Unlock for access to all 119 flashcards in this deck.
Unlock Deck
k this deck
16
The application of multiple regression analysis to a time-series data set yields a calculated Durbin-Watson statistic that is equal to 1.49. If the lower test value at the 1 percent level is 1.28 and the upper value is 1.51, then
A) there is no evidence of a problem.
B) there is some evidence of a problem, but it is not significant.
C) there is evidence of a significant problem.
D) there is not sufficient information given to determine whether or not there is a problem.
A) there is no evidence of a problem.
B) there is some evidence of a problem, but it is not significant.
C) there is evidence of a significant problem.
D) there is not sufficient information given to determine whether or not there is a problem.
Unlock Deck
Unlock for access to all 119 flashcards in this deck.
Unlock Deck
k this deck
17
The application of multiple regression analysis to a data set yields an F statistic that is highly significant and t ratios that are not significant. This is an indication that
A) autocorrelation is present.
B) multicollinearity is present.
C) homoscedasticity is present.
D) heteroscedasticity is present.
A) autocorrelation is present.
B) multicollinearity is present.
C) homoscedasticity is present.
D) heteroscedasticity is present.
Unlock Deck
Unlock for access to all 119 flashcards in this deck.
Unlock Deck
k this deck
18
Autocorrelation can be the result of
A) the omission of an important explanatory variable.
B) using cross-sectional data.
C) multicollinearity.
D) All of the above are correct.
A) the omission of an important explanatory variable.
B) using cross-sectional data.
C) multicollinearity.
D) All of the above are correct.
Unlock Deck
Unlock for access to all 119 flashcards in this deck.
Unlock Deck
k this deck
19
The scatter diagram represents a data set and a plot of the simple linear regression equation estimated from the data. The diagram shows evidence of
A) homoscedasticity.
B) heteroscedasticity.
C) positive autocorrelation.
D) negative autocorrelation.
A) homoscedasticity.
B) heteroscedasticity.
C) positive autocorrelation.
D) negative autocorrelation.
Unlock Deck
Unlock for access to all 119 flashcards in this deck.
Unlock Deck
k this deck
20
The scatter diagram represents the error terms from a simple linear regression estimated from time-series data. The error terms are plotted against time. The diagram shows evidence of
A) homoscedasticity.
B) heteroscedasticity.
C) positive autocorrelation.
D) negative autocorrelation.
A) homoscedasticity.
B) heteroscedasticity.
C) positive autocorrelation.
D) negative autocorrelation.
Unlock Deck
Unlock for access to all 119 flashcards in this deck.
Unlock Deck
k this deck
21
The identification problem refers to the difficulties that a researcher encounters when trying to
A) determine which independent variables influence quantity demanded.
B) find accurate data on the price of a commodity and on the quantity demanded of a commodity.
C) estimate a demand function from data on commodity price and quantity demanded.
D) measure the impact of extraneous variables on experimental market data.
Unlock Deck
Unlock for access to all 119 flashcards in this deck.
Unlock Deck
k this deck
22
The estimation of consumer demand by questioning a sample of consumers is referred to as the
A) consumer survey approach.
B) observational research approach.
C) consumer clinic approach.
D) market experiment approach.
A) consumer survey approach.
B) observational research approach.
C) consumer clinic approach.
D) market experiment approach.
Unlock Deck
Unlock for access to all 119 flashcards in this deck.
Unlock Deck
k this deck
23
The estimation of consumer demand by setting up simulated stores, providing a sample of consumers with money, and then allowing them to purchase and keep the commodities they select in the stores is called the
A) consumer survey approach.
B) observational research approach.
C) consumer clinic approach.
D) market experiment approach.
A) consumer survey approach.
B) observational research approach.
C) consumer clinic approach.
D) market experiment approach.
Unlock Deck
Unlock for access to all 119 flashcards in this deck.
Unlock Deck
k this deck
24
The estimation of consumer demand by monitoring actual purchasing and consumption behavior by a sample of consumers is called the
A) consumer survey approach.
B) observational research approach.
C) consumer clinic approach.
D) market experiment approach.
A) consumer survey approach.
B) observational research approach.
C) consumer clinic approach.
D) market experiment approach.
Unlock Deck
Unlock for access to all 119 flashcards in this deck.
Unlock Deck
k this deck
25
If the t ratio for the slope of a simple coefficient of a simple linear regression equation is -2.48 and the critical values of the t distribution at the 1 percent and 5 percent levels, respectively, are 3.499 and 2.365, then the slope is
A) not significantly different from zero.
B) significantly different from zero at both the 1 percent and the 5 percent levels.
C) significantly different from zero at the 1 percent level but not at the 5 percent level.
D) significantly different from zero at the 5 percent level but not at the 1 percent level.
Unlock Deck
Unlock for access to all 119 flashcards in this deck.
Unlock Deck
k this deck
26
Ordinary least squares is used to estimate a linear relationship between a firm's quantity sold per month and its total promotional expenditures, and the slope of the linear function is found to be positive and significantly different from zero. Assuming that all other variables, including product price, were constant during the period covered by the data set, this result implies that
A) the firm should spend more on promotional expenditures.
B) the firm should spend less on promotional expenditures.
C) promotional expenditures influence demand.
D) promotional expenditures have no influence on demand.
A) the firm should spend more on promotional expenditures.
B) the firm should spend less on promotional expenditures.
C) promotional expenditures influence demand.
D) promotional expenditures have no influence on demand.
Unlock Deck
Unlock for access to all 119 flashcards in this deck.
Unlock Deck
k this deck
27
Ordinary least squares is used to estimate a linear relationship between a firm's total revenue per week (in thousands of dollars) and the average percentage discount from list price allowed to customers by salespeople. A 95 percent confidence interval on the slope is calculated from the regression output. The interval ranges from 1.05 to 2.38. Based on this result, the researcher
A) can conclude that the slope is significantly different from zero at the 5 percent level of significance.
B) can be 95 percent confident that the effect of a 1 percent increase in the average price discount will increase weekly total revenue by between $1,050 and $2,380.
C) has a 1-in-20 chance of incorrectly concluding that the slope is within the estimated confidence interval.
D) All of the above are correct.
Unlock Deck
Unlock for access to all 119 flashcards in this deck.
Unlock Deck
k this deck
28
The coefficient of determination
A) is maximized by ordinary least squares.
B) has a value between zero and 1.
C) will generally increase if additional independent variables are added to a regression analysis.
D) All of the above are correct.
A) is maximized by ordinary least squares.
B) has a value between zero and 1.
C) will generally increase if additional independent variables are added to a regression analysis.
D) All of the above are correct.
Unlock Deck
Unlock for access to all 119 flashcards in this deck.
Unlock Deck
k this deck
29
The coefficient of correlation is
A) a measure of the strength and direction of the linear relationship between two variables.
B) equal to the size of the change in the Y variable that is caused by a change in the X variable.
C) is equal to the proportion of the variation in the Y variable that is due to variations in the X variable.
D) All of the above are correct.
Unlock Deck
Unlock for access to all 119 flashcards in this deck.
Unlock Deck
k this deck
30
Multiple regression analysis is used when
A) there is not enough data to carry out simple linear regression analysis.
B) the dependent variable depends on more than one independent variable.
C) one or more of the assumptions of simple linear regression are not correct.
D) the relationship between the dependent variable and the independent variables cannot be described by a linear function.
Unlock Deck
Unlock for access to all 119 flashcards in this deck.
Unlock Deck
k this deck
31
The adjusted value of the coefficient of determination
A) will always increase if additional independent variables are added to the regression model.
B) is equal to the proportion of the sum of the squared deviations of the dependent variable from its mean that is explained by the regression model.
C) is always greater than the proportion of the sum of the squared deviations of the dependent variable from its mean that is explained by the regression model.
D) is always less than the proportion of the sum of the squared deviations of the dependent variable from its mean that is explained by the regression model.
Unlock Deck
Unlock for access to all 119 flashcards in this deck.
Unlock Deck
k this deck
32
If the F test statistic for a regression is greater than the critical value from the F distribution, it implies that
A) none of the independent variables in the regression model has a significant effect on the dependent variable.
B) all of the independent variables in the regression model have significant effects on the dependent variable.
C) one or more of the independent variables in the regression model have a significant effect on the dependent variable.
D) None of the above is correct.
Unlock Deck
Unlock for access to all 119 flashcards in this deck.
Unlock Deck
k this deck
33
The standard error of the regression measures the
A) variability of the independent variable(s) relative to its (their) mean.
B) variability of the dependent variable relative to its mean.
C) variability of the dependent variable relative to the regression line.
D) average error that will result if the regression line is used to predict.
A) variability of the independent variable(s) relative to its (their) mean.
B) variability of the dependent variable relative to its mean.
C) variability of the dependent variable relative to the regression line.
D) average error that will result if the regression line is used to predict.
Unlock Deck
Unlock for access to all 119 flashcards in this deck.
Unlock Deck
k this deck
34
Multicollinearity refers to a situation in which
A) successive error terms derived from the application of regression analysis to time-series data are correlated.
B) there is a high degree of correlation between the independent variables included in a multiple regression model.
C) the dependent variable is highly correlated with the independent variable(s) in a regression analysis.
D) the application of a multiple regression model yields estimates that are nonlinear in form.
Unlock Deck
Unlock for access to all 119 flashcards in this deck.
Unlock Deck
k this deck
35
Autocorrelation refers to a situation in which
A) successive error terms derived from the application of regression analysis to time-series data are correlated.
B) there is a high degree of correlation between two or more of the independent variables included in a multiple regression model.
C) the dependent variable is highly correlated with the independent variable(s) in a regression analysis.
D) the application of a multiple regression model yields estimates that are nonlinear in form.
Unlock Deck
Unlock for access to all 119 flashcards in this deck.
Unlock Deck
k this deck
36
Heteroscedasticity refers to a situation in which the error terms from a regression analysis
A) do not have equal variance.
B) are not normally distributed.
C) do not have a mean of zero.
D) All of the above are correct.
A) do not have equal variance.
B) are not normally distributed.
C) do not have a mean of zero.
D) All of the above are correct.
Unlock Deck
Unlock for access to all 119 flashcards in this deck.
Unlock Deck
k this deck
37
Autocorrelation may be the result of
A) the omission of an important explanatory variable.
B) the presence of a trend in the independent variable.
C) nonlinearities in the relationship between the dependent and independent variables.
D) All of the above are correct.
A) the omission of an important explanatory variable.
B) the presence of a trend in the independent variable.
C) nonlinearities in the relationship between the dependent and independent variables.
D) All of the above are correct.
Unlock Deck
Unlock for access to all 119 flashcards in this deck.
Unlock Deck
k this deck
38
One advantage of estimating a function in which all variables have been transformed into their natural logarithms is that
A) problems with multicollinearity will be eliminated.
B) problems with heteroscedasticity will be eliminated.
C) the estimated slope coefficients are all elasticities.
D) None of the above is correct.
A) problems with multicollinearity will be eliminated.
B) problems with heteroscedasticity will be eliminated.
C) the estimated slope coefficients are all elasticities.
D) None of the above is correct.
Unlock Deck
Unlock for access to all 119 flashcards in this deck.
Unlock Deck
k this deck
39
One difference between foreign and domestic demand for a commodity exported by the United States is that
A) foreign demand is unrelated to the dollar price of the commodity.
B) foreign demand depends on the exchange rate between domestic and foreign currencies.
C) the domestic price elasticity of demand depends on the availability of substitute commodities.
D) foreign-made commodities are not good substitutes for U.S.-made commodities.
Unlock Deck
Unlock for access to all 119 flashcards in this deck.
Unlock Deck
k this deck
40
Consider the following scenario: A real estate firm decides to estimate the demand for housing as a function of the location's population density and presence of shopping centers (among other things). However, the company also observes that there is a statistically significant positive correlation between population density and the presence of shopping centers. Would you recommend including both of these variables into the regression estimation? If your recommendation is no, why?
A) Yes, as both of these variables seem logical and interpreting their coefficients is important
B) No, because this would lead to multicollinearity
C) No, because this would lead to heteroscedasticity
D) No, because this would lead to autocorrelation
A) Yes, as both of these variables seem logical and interpreting their coefficients is important
B) No, because this would lead to multicollinearity
C) No, because this would lead to heteroscedasticity
D) No, because this would lead to autocorrelation
Unlock Deck
Unlock for access to all 119 flashcards in this deck.
Unlock Deck
k this deck
41
Assume that the following is the result of a demand estimation:
,
Where I represents consumer income, P is the price, and Q is quantity demanded. What is the price elasticity of demand?
A) 20
B) 5
C) 2
D) None of the above
,
Where I represents consumer income, P is the price, and Q is quantity demanded. What is the price elasticity of demand?
A) 20
B) 5
C) 2
D) None of the above
Unlock Deck
Unlock for access to all 119 flashcards in this deck.
Unlock Deck
k this deck
42
Assume that the following is the result of a demand estimation:
Assuming that all coefficients are statistically significant and the model does not suffer from any estimation issues, which of the following statements is wrong:
A) X is a normal good
B) X and Y are competing products
C) X and Z are competing products
D) A rise in the price of X reduces the quantity of X demanded
Unlock Deck
Unlock for access to all 119 flashcards in this deck.
Unlock Deck
k this deck
43
Which of the following is a marketing research approach to demand estimation?
A) Consumer surveys
B) Observational research
C) Market Experiments
D) All of the above
A) Consumer surveys
B) Observational research
C) Market Experiments
D) All of the above
Unlock Deck
Unlock for access to all 119 flashcards in this deck.
Unlock Deck
k this deck
44
Using consumer survey approach, data is obtained from
A) questioning a sample of consumers.
B) laboratory experiments.
C) observing consumers purchasing and consuming products.
D) real market tests in actual marketplace.
A) questioning a sample of consumers.
B) laboratory experiments.
C) observing consumers purchasing and consuming products.
D) real market tests in actual marketplace.
Unlock Deck
Unlock for access to all 119 flashcards in this deck.
Unlock Deck
k this deck
45
Using observational research approach, data is obtained from
A) questioning a sample of consumers.
B) laboratory experiments.
C) observing consumers purchasing and consuming products.
D) real market tests in actual marketplace.
A) questioning a sample of consumers.
B) laboratory experiments.
C) observing consumers purchasing and consuming products.
D) real market tests in actual marketplace.
Unlock Deck
Unlock for access to all 119 flashcards in this deck.
Unlock Deck
k this deck
46
Using consumer clinics approach, data is obtained from
A) questioning a sample of consumers.
B) laboratory experiments.
C) observing consumers purchasing and consuming products.
D) real market tests in actual marketplace.
A) questioning a sample of consumers.
B) laboratory experiments.
C) observing consumers purchasing and consuming products.
D) real market tests in actual marketplace.
Unlock Deck
Unlock for access to all 119 flashcards in this deck.
Unlock Deck
k this deck
47
Using market experiment approach, data is obtained from
A) questioning a sample of consumers.
B) laboratory experiments.
C) observing consumers purchasing and consuming products.
D) real market tests in actual marketplace.
A) questioning a sample of consumers.
B) laboratory experiments.
C) observing consumers purchasing and consuming products.
D) real market tests in actual marketplace.
Unlock Deck
Unlock for access to all 119 flashcards in this deck.
Unlock Deck
k this deck
48
Regression line can be best described as
A) the line that goes through all the data points.
B) line obtained by minimizing the sum of the distance between the horizontal axis and the data points.
C) line obtained by minimizing the sum of squared vertical deviations of each point from the regression line.
D) line obtained by minimizing the sum of squared horizontal deviations of each point from the regression line.
Unlock Deck
Unlock for access to all 119 flashcards in this deck.
Unlock Deck
k this deck
49
OLS (ordinary least squares) is used to estimate a linear relationship between a firm's quantity of laptops sold per year and its total promotional expenditures, and the slope of the linear function is found to be positive but not significantly different from zero. Assuming that all other variables, including product price, were constant during the period covered by the data set, this result implies that
A) the firm should spend more on promotional expenditures due to positive slope.
B) the firm should spend less on promotional expenditures due to positive slope.
C) promotional expenditures influence demand.
D) more research is needed, or promotional expenditures have no influence on demand.
A) the firm should spend more on promotional expenditures due to positive slope.
B) the firm should spend less on promotional expenditures due to positive slope.
C) promotional expenditures influence demand.
D) more research is needed, or promotional expenditures have no influence on demand.
Unlock Deck
Unlock for access to all 119 flashcards in this deck.
Unlock Deck
k this deck
50
Application of simple linear regression analysis to the estimation of a demand equation has yielded the following:
Q = 44 - 11P
If the current product price is P = $1 and the quantity sold per time period is Q = 30, then the error (e) for the current time period is equal to
A) 3
B) 11
C) 29
D) 33
Q = 44 - 11P
If the current product price is P = $1 and the quantity sold per time period is Q = 30, then the error (e) for the current time period is equal to
A) 3
B) 11
C) 29
D) 33
Unlock Deck
Unlock for access to all 119 flashcards in this deck.
Unlock Deck
k this deck
51
One of the advantages of using the following function in estimation is
A) problems with multicollinearity will be eliminated.
B) problems with heteroscedasticity will be eliminated.
C) the estimated slope coefficients are all elasticities.
D) None of the above is correct.
Unlock Deck
Unlock for access to all 119 flashcards in this deck.
Unlock Deck
k this deck
52
Which of the following countries is the top exporter in dollar value of exports in the US in 2015?
A) Harley-Davidson
B) United Technologies
C) JP Morgan Chase
D) Apple
A) Harley-Davidson
B) United Technologies
C) JP Morgan Chase
D) Apple
Unlock Deck
Unlock for access to all 119 flashcards in this deck.
Unlock Deck
k this deck
53
Which of the following companies did NOT experience a decline in a smartphone market since the 2005?
A) Blackberry
B) Huawei
C) Nokia
D) Motorola
A) Blackberry
B) Huawei
C) Nokia
D) Motorola
Unlock Deck
Unlock for access to all 119 flashcards in this deck.
Unlock Deck
k this deck
54
Behavioral economics extends the understanding of economic behavior by considering which of the following factors?
A) Cognitive
B) Emotional
C) Rational
D) Physiological
A) Cognitive
B) Emotional
C) Rational
D) Physiological
Unlock Deck
Unlock for access to all 119 flashcards in this deck.
Unlock Deck
k this deck
55
Which of the following is NOT an advantage of the virtual shopping against the simulated physical store in marketing research?
A) It is cheaper to conduct virtual shopping
B) More people can participate in a shorter period of time
C) It is easier to make changes and repeat simulations
D) The results are more accurate
A) It is cheaper to conduct virtual shopping
B) More people can participate in a shorter period of time
C) It is easier to make changes and repeat simulations
D) The results are more accurate
Unlock Deck
Unlock for access to all 119 flashcards in this deck.
Unlock Deck
k this deck
56
Assume that a firm wants to use multiple regression analysis on Excel to estimate how the demand for its product X depends on price of its product, consumer's income (i)and a price of a substitute Y. Which of the following explicit linear form should the firm use?
A)
B)
C)
D)
A)
B)
C)
D)
Unlock Deck
Unlock for access to all 119 flashcards in this deck.
Unlock Deck
k this deck
57
A simple linear regression analysis based on a data set that consists of 3,000 observations yielded the following estimated equation:
Q = 100 -1.25P
If the coefficient of determination is 0.64, then the correlation coefficient is equal to
A) 0.64
B) 0.72
C) 0.80
D) 0.88
Q = 100 -1.25P
If the coefficient of determination is 0.64, then the correlation coefficient is equal to
A) 0.64
B) 0.72
C) 0.80
D) 0.88
Unlock Deck
Unlock for access to all 119 flashcards in this deck.
Unlock Deck
k this deck
58
A multiple regression analysis based on a data set that consists of 505 observations yielded the following estimated demand equation:
Q = 50 - 2P + 0.01I + 0.01A
Where P is price, I is income, and A is advertising. If price is equal to $20, income is equal to $2,000, and advertising expenditures are equal to $5,000, then the predicted quantity demanded (Q) is
A) 20.
B) 40.
C) 60.
D) 80.
Q = 50 - 2P + 0.01I + 0.01A
Where P is price, I is income, and A is advertising. If price is equal to $20, income is equal to $2,000, and advertising expenditures are equal to $5,000, then the predicted quantity demanded (Q) is
A) 20.
B) 40.
C) 60.
D) 80.
Unlock Deck
Unlock for access to all 119 flashcards in this deck.
Unlock Deck
k this deck
59
If one finds estimate of b to be equal with standard error , using a critical value of 1.96, what is the confidence interval for the true b coefficient?
A) (0.52, 2.48)
B) (-0.98, 0.98)
C) (-0.46, 3.46)
D) (1.00, 2,00)
A) (0.52, 2.48)
B) (-0.98, 0.98)
C) (-0.46, 3.46)
D) (1.00, 2,00)
Unlock Deck
Unlock for access to all 119 flashcards in this deck.
Unlock Deck
k this deck
60
Cross-sectional data are made up of observations that are collected across a period of time.
Unlock Deck
Unlock for access to all 119 flashcards in this deck.
Unlock Deck
k this deck
61
The demand curve for a commodity can generally be approximated by drawing a graph with price on the horizontal axis and quantity on the vertical axis, plotting a series of points that represent observed combinations of price and quantity, and then drawing lines that connect the points.
Unlock Deck
Unlock for access to all 119 flashcards in this deck.
Unlock Deck
k this deck
62
If the price of a commodity rises and the quantity sold increases, it does not prove that the demand curve for the commodity slopes upward.
Unlock Deck
Unlock for access to all 119 flashcards in this deck.
Unlock Deck
k this deck
63
If the supply curve for a commodity shifts while the demand curve does not shift, then the demand identification problem will not be encountered.
Unlock Deck
Unlock for access to all 119 flashcards in this deck.
Unlock Deck
k this deck
64
The identification problem is dealt with in practice by including all of the determinants of demand in the estimated demand function.
Unlock Deck
Unlock for access to all 119 flashcards in this deck.
Unlock Deck
k this deck
65
Observational research involves questioning a sample of consumers about their responses to actual and potential market conditions.
Unlock Deck
Unlock for access to all 119 flashcards in this deck.
Unlock Deck
k this deck
66
One advantage of consumer clinics over market experiments is the ability to control the environment and screen out the effects of external events.
Unlock Deck
Unlock for access to all 119 flashcards in this deck.
Unlock Deck
k this deck
67
A market experiment is carried out by providing consumers with a sum of money that must be spent in a simulated store.
Unlock Deck
Unlock for access to all 119 flashcards in this deck.
Unlock Deck
k this deck
68
The use of electronic devices designed to gather information about which television stations people are watching is an example of observational research.
Unlock Deck
Unlock for access to all 119 flashcards in this deck.
Unlock Deck
k this deck
69
A scatter diagram is a graph of a linear function.
Unlock Deck
Unlock for access to all 119 flashcards in this deck.
Unlock Deck
k this deck
70
In the linear function Y = a + bX, Y is the intercept and X is the slope of the function.
Unlock Deck
Unlock for access to all 119 flashcards in this deck.
Unlock Deck
k this deck
71
The slope of a linear function is equal to the change in the dependent variable divided by the corresponding change in the independent variable.
Unlock Deck
Unlock for access to all 119 flashcards in this deck.
Unlock Deck
k this deck
72
The Y intercept of a linear function is equal to the value of X when Y is equal to zero.
Unlock Deck
Unlock for access to all 119 flashcards in this deck.
Unlock Deck
k this deck
73
If a 1-unit increase in the value of X results in a 2-unit decrease in the value of Y, then b = -2.
Unlock Deck
Unlock for access to all 119 flashcards in this deck.
Unlock Deck
k this deck
74
If a linear function that is plotted on a graph passes through the origin of a graph, then b = 0.
Unlock Deck
Unlock for access to all 119 flashcards in this deck.
Unlock Deck
k this deck
75
If a regression line that was calculated by ordinary least squares is plotted on a scatter diagram, all of the points in the data set will be on the line.
Unlock Deck
Unlock for access to all 119 flashcards in this deck.
Unlock Deck
k this deck
76
A regression line that is calculated by ordinary least squares will have an intercept and slope that minimize the sum of the squared differences between the observed value of the Y variable and the regression line.
Unlock Deck
Unlock for access to all 119 flashcards in this deck.
Unlock Deck
k this deck
77
Unexplained variation in the Y variable is denoted et.
Unlock Deck
Unlock for access to all 119 flashcards in this deck.
Unlock Deck
k this deck
78
If ordinary least squares is used to estimate a linear function, then the sum of the et will always be equal to zero.
Unlock Deck
Unlock for access to all 119 flashcards in this deck.
Unlock Deck
k this deck
79
One of the crucial assumptions of regression analysis is that the error term has a normal probability distribution.
Unlock Deck
Unlock for access to all 119 flashcards in this deck.
Unlock Deck
k this deck
80
A significance test on the slope coefficient using the t ratio tests the hypothesis that the slope is equal to zero.
Unlock Deck
Unlock for access to all 119 flashcards in this deck.
Unlock Deck
k this deck
Unlock Deck
Unlock for access to all 119 flashcards in this deck.


