Exam 5: Demand Estimation
Exam 1: The Nature and Scope of Managerial Economics132 Questions
Exam 2: Demand, Supply, and Equilibrium Analysis103 Questions
Exam 3: Optimization Techniques and New Management Tools126 Questions
Exam 4: Demand Theory134 Questions
Exam 5: Demand Estimation119 Questions
Exam 6: Demand Forecasting111 Questions
Exam 7: Production Theory and Estimation101 Questions
Exam 8: Cost Theory and Estimation101 Questions
Exam 9: Market Structure: Perfect Competition, Monopoly, and Monopolistic Competition104 Questions
Exam 10: Oligopoly and Firm Architecture108 Questions
Exam 11: Game Theory and Strategic Behavior105 Questions
Exam 12: Pricing Practices111 Questions
Exam 13: Regulation and Antitrust: The Role of Government in the Economy110 Questions
Exam 14: Risk Analysis111 Questions
Exam 15: Long-Run Investment Decisions: Capital Budgeting116 Questions
Select questions type
The standard error of the regression measures the
Free
(Multiple Choice)
4.8/5  (33)
(33)
Correct Answer: Verified
C
If the price of a commodity rises and the quantity sold increases, it does not prove that the demand curve for the commodity slopes upward.
Free
(True/False)
4.9/5 (36)
Correct Answer:Verified
True
Using observational research approach, data is obtained from
Free
(Multiple Choice)
4.9/5 (35)
Correct Answer:Verified
C
The scatter diagram represents the error terms from a simple linear regression estimated from time-series data. The error terms are plotted against time. The diagram shows evidence of
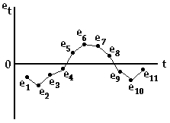
(Multiple Choice)
4.7/5 (29)
Analysis of variance tests the explanatory power of the entire regression.
(True/False)
4.7/5 (34)
Calculate the equation of the linear function that is plotted on the graph.
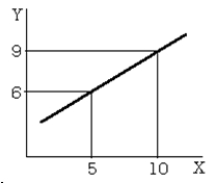
(Essay)
4.8/5 (37)
Heteroscedasticity refers to a situation in which the error terms from a regression analysis
(Multiple Choice)
4.9/5 (32)
A multiple regression analysis based on a data set that consists of 505 observations yielded the following estimated demand equation:
Q = 50 - 2P + 0.01I + 0.01A
Where P is price, I is income, and A is advertising. If price is equal to $20, income is equal to $2,000, and advertising expenditures are equal to $5,000, then the predicted quantity demanded (Q) is
(Multiple Choice)
4.8/5 (33)
Application of simple linear regression analysis to the estimation of a demand equation has yielded the following:
Q = 44 - 11P
If the current product price is P = $1 and the quantity sold per time period is Q = 30, then the error (e) for the current time period is equal to
(Multiple Choice)
4.9/5 (36)
The Y intercept of a linear function is equal to the value of X when Y is equal to zero.
(True/False)
4.8/5 (26)
Assume that a firm wants to use multiple regression analysis on Excel to estimate how the demand for its product X depends on price of its product, consumer's income (i)and a price of a substitute Y. Which of the following explicit linear form should the firm use?
(Multiple Choice)
4.9/5 (36)
The application of multiple regression analysis to a time-series data set yields a calculated Durbin-Watson statistic that is equal to 1.00. If the lower test value at the 1 percent level is 1.28 and the upper value is 1.51, then there is evidence that
(Multiple Choice)
4.9/5 (35)
A significance test on the slope coefficient using the t ratio tests the hypothesis that the slope is equal to zero.
(True/False)
4.7/5 (29)
Your coworker has run a simple univariate regression and computed the explained and the total variation in Y and asked you to compute the coefficient of correlation Expl.var.in
Total. var.in
(Essay)
4.9/5 (32)
One advantage of estimating a function in which all variables have been transformed into their natural logarithms is that
(Multiple Choice)
4.9/5 (26)
The F test has, as its null hypothesis, the proposition that none of the estimated slope coefficients is different from zero.
(True/False)
4.9/5 (28)
Which of the following countries is the top exporter in dollar value of exports in the US in 2015?
(Multiple Choice)
4.9/5 (41)
One advantage of consumer clinics over market experiments is the ability to control the environment and screen out the effects of external events.
(True/False)
4.8/5 (35)
The demand curve for a commodity can generally be approximated by drawing a graph with price on the horizontal axis and quantity on the vertical axis, plotting a series of points that represent observed combinations of price and quantity, and then drawing lines that connect the points.
(True/False)
4.8/5 (38)
Filters
- Essay(0)
- Multiple Choice(0)
- Short Answer(0)
- True False(0)
- Matching(0)