Deck 10: Data Description and Probability Distributions
Full screen (f)
Question
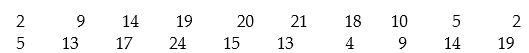
Construct a frequency table:
-The following is the number of hours students studied per week on average. Use five intervals, starting with 0 - 4.
A)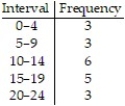
B)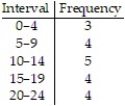
C)
D)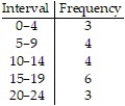
-The following is the number of hours students studied per week on average. Use five intervals, starting with 0 - 4.
A)
B)
C)
D)
Question
Construct a frequency table:
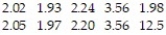
-The following are the heights, in inches, of ten middle school basketball players. Determine the data range for the following data set. Also, construct a frequency table for the data set, use a class interval width of 2 and start with 62.5 inches.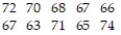
-The following are the heights, in inches, of ten middle school basketball players. Determine the data range for the following data set. Also, construct a frequency table for the data set, use a class interval width of 2 and start with 62.5 inches.
Question
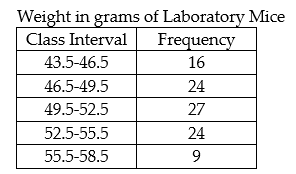
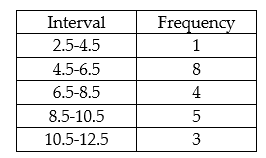
The frequency distribution below gives the weight in grams of 100 laboratory mice. What is the probability that the weight of a healthy mouse selected randomly from the sample will be more than 52 grams?
A) 0.33
B) 0.67
C) 0.50
D) 0.23
A) 0.33
B) 0.67
C) 0.50
D) 0.23
Question
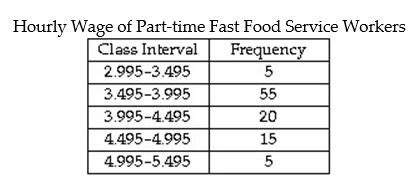
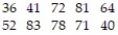
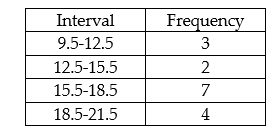
Given the frequency distribution below, what is the probability of the hourly wage of a person chosen at random from the sample being less than $4.495?
A) 0.08
B) 0.20
C) 0.80
D) 0.75
A) 0.08
B) 0.20
C) 0.80
D) 0.75
Question
Construct the specified histogram:
-Eighty U. S households were surveyed about MP3 players. The table gives the frequency distribution for the data.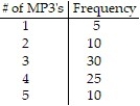
 Construct a histogram.
-Eighty U. S households were surveyed about MP3 players. The table gives the frequency distribution for the data.
Construct a histogram. Question
Construct the specified histogram:
-Construct a histogram for the following frequency table.
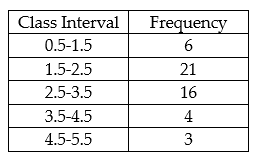
-Construct a histogram for the following frequency table.
Question
Construct the specified histogram:
-Twenty voters were asked their age. The results are summarized in the frequency table below.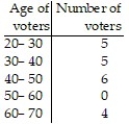
 Construct a histogram.
-Twenty voters were asked their age. The results are summarized in the frequency table below.
Construct a histogram. Question
Construct the specified histogram:
-Construct a histogram for the following set of data on oil rig utilization by type.
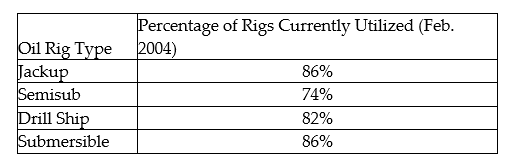
-Construct a histogram for the following set of data on oil rig utilization by type.
Question
Construct a bar graph of the given frequency distribution:
-The frequency distribution indicates the height in feet of persons in a group of 216 people.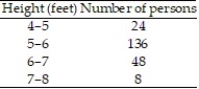
A)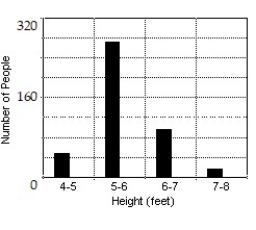
B)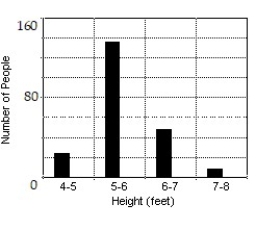
C)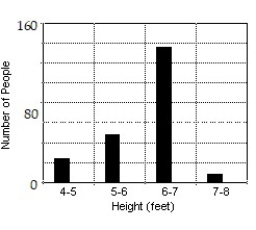
D)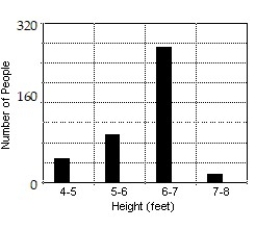
-The frequency distribution indicates the height in feet of persons in a group of 216 people.
A)
B)
C)
D)
Question
Construct a bar graph of the given frequency distribution:
-The frequency distribution indicates the number of fish caught by each fisherman in a group of 250 fishermen.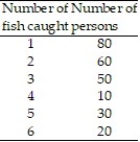
A)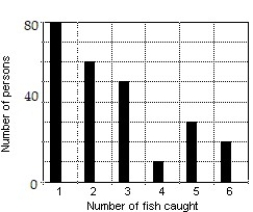
B)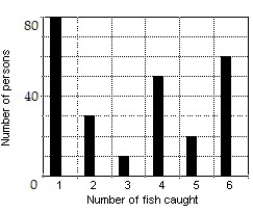
C)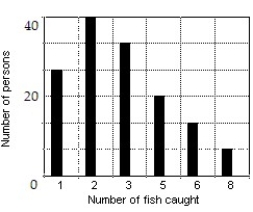
D)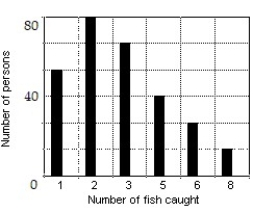
-The frequency distribution indicates the number of fish caught by each fisherman in a group of 250 fishermen.
A)
B)
C)
D)
Question
Construct a broken-line graph of the data in the table:
-The following table shows the number of computer sales made at Computer Buy over five months. Use time on the horizontal scale for your line graph.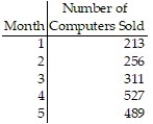
-The following table shows the number of computer sales made at Computer Buy over five months. Use time on the horizontal scale for your line graph.
Question
Construct a broken-line graph of the data in the table:
-The following table gives the total amount of precipitation during the given months. Use time on the horizontal scale for your line graph.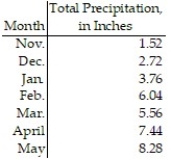
-The following table gives the total amount of precipitation during the given months. Use time on the horizontal scale for your line graph.
Question
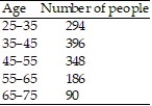
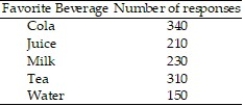
Construct a pie graph, with sectors given in percent, to represent the data in the given table:
-

A)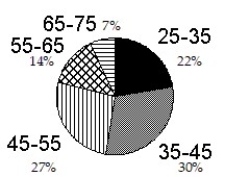
B)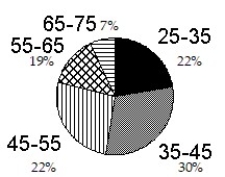
C)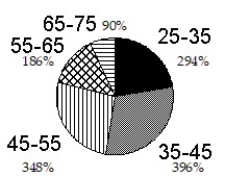
D)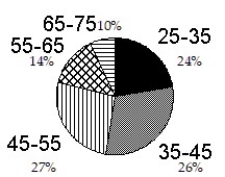
-
A)
B)
C)
D)
Question
Construct a pie graph, with sectors given in percent, to represent the data in the given table:
-

A)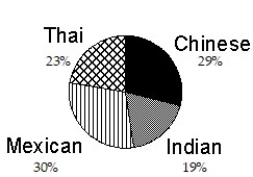
B)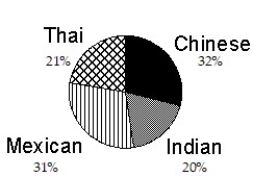
C)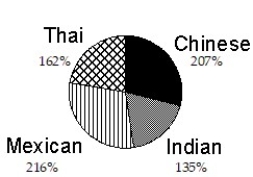
D)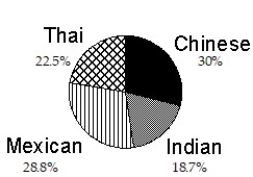
-
A)
B)
C)
D)
Question
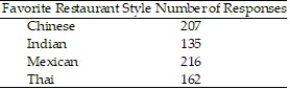
Construct a pie graph, with sectors given in percent, to represent the data in the given table:
-
A)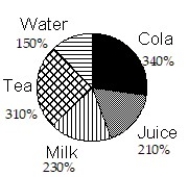
B)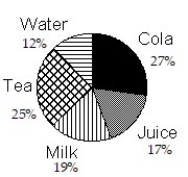
C)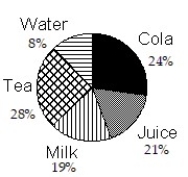
D)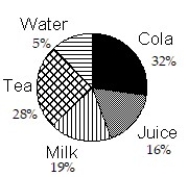
-
A)
B)
C)
D)
Question
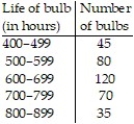
Construct a frequency polygon:
-

A)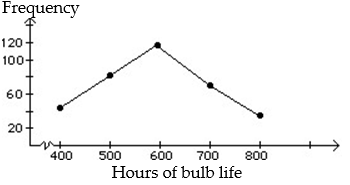
B)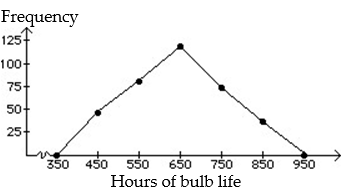
-
A)
B)
Question
Construct a frequency polygon:
-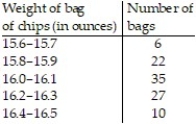
A)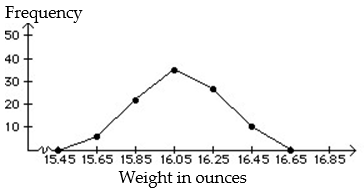
B)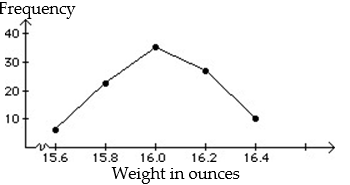
-
A)
B)
Question
Question
Question
Question
Question
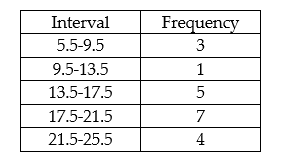
Find the mean for the following grouped data.
A) 15.5
B) 17.1
C) 19.5
D) 7.5
A) 15.5
B) 17.1
C) 19.5
D) 7.5
Question
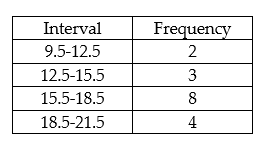
Find the mean for the following grouped data.
A) 11
B) 14
C) 16.47
D) 17
A) 11
B) 14
C) 16.47
D) 17
Question
Question
Question
Find the median for the following grouped data.
A) 11.35
B) 9.875
C) 10
D) 8.35
A) 11.35
B) 9.875
C) 10
D) 8.35
Question
Find the median for the following grouped data.
A) 9.5
B) 11.5
C) 7.60
D) 7.25
A) 9.5
B) 11.5
C) 7.60
D) 7.25
Question
Question
Question
Which single measure of central tendency - mean, median, or mode - would you say best describes the given set of measurements?
-
A) The Mean
B) The Mode
C) The Median
-
A) The Mean
B) The Mode
C) The Median
Question
Which single measure of central tendency - mean, median, or mode - would you say best describes the given set of measurements?
-
A) The Median
B) The Mean
C) The Mode
-
A) The Median
B) The Mean
C) The Mode
Question
Question
Question
Question
Question
Question
What proportion of the following sample of ten measurements lies within 1 standard deviation of the mean?

A) 60%
B) 40%
C) 80%
D) 100%
A) 60%
B) 40%
C) 80%
D) 100%
Question
What proportion of the following sample of ten measurements lies within 2 standard deviations of the mean?

A) 100%
B) 80%
C) 70%
D) 90%
A) 100%
B) 80%
C) 70%
D) 90%
Question
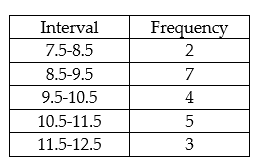
Find the standard deviation for the following grouped data:
A) 3.09
B) 9.5625
C) 3.256
D) 7.56
A) 3.09
B) 9.5625
C) 3.256
D) 7.56
Question
The register of a college recorded the amount of time each student spent waiting in line during peak registration hours one Monday. The frequency table below summarizes the results. Find the standard deviation. Round your answer to one decimal place. 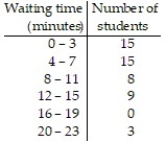
A) 5.4
B) 5.6
C) 5.3
D) 5.8
E) 5.9
A) 5.4
B) 5.6
C) 5.3
D) 5.8
E) 5.9
Question
The test scores of 40 driver license applicants are summarized in the frequency table below. Find the standard deviation. 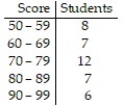 Round your answer to one decimal place.
A) 12.0
B) 12.1
C) 12.7
D) 14.1
E) 13.4
Round your answer to one decimal place.A) 12.0
B) 12.1
C) 12.7
D) 14.1
E) 13.4
Question
Question
Question
Evaluate  for the given values of n, x, and p.
-n = 30, x = 12, p = 0.20
A) 0.0028
B) 0.0139
C) 0.0064
D) 0.1082
for the given values of n, x, and p.-n = 30, x = 12, p = 0.20
A) 0.0028
B) 0.0139
C) 0.0064
D) 0.1082
Question
Evaluate for the given values of n, x, and p.
-n = 6, x = 3, p =
A) 0.0322
B) 0.0154
C) 0.0286
D) 0.0536
for the given values of n, x, and p.-n = 6, x = 3, p =
A) 0.0322
B) 0.0154
C) 0.0286
D) 0.0536
Question
A fair coin is tossed fourteen times. What is the probability of obtaining the following? Express the answer both in terms  of and as a four-place decimal.
-Exactly 12 heads?
of and as a four-place decimal.-Exactly 12 heads?
Question
Construct a histogram for the binomial distribution 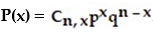 ,and compute the mean and standard deviation:
-n = 6, p =
,and compute the mean and standard deviation:-n = 6, p =
Question
Construct a histogram for the binomial distribution ,and compute the mean and standard deviation:
-n = 7 and p =
,and compute the mean and standard deviation:-n = 7 and p =
Question
Question
Question
Question
Question
Question
Question
Question
Question
Question
Question
Question
Question
Question
Question
Question
Question

Unlock Deck
Sign up to unlock the cards in this deck!
Unlock Deck
Unlock Deck
1/65
Play
Full screen (f)
Deck 10: Data Description and Probability Distributions
1
Construct a frequency table:
-The following is the number of hours students studied per week on average. Use five intervals, starting with 0 - 4.
A)
B)
C)
D)
-The following is the number of hours students studied per week on average. Use five intervals, starting with 0 - 4.
A)
B)
C)
D)
2
Construct a frequency table:
-The following are the heights, in inches, of ten middle school basketball players. Determine the data range for the following data set. Also, construct a frequency table for the data set, use a class interval width of 2 and start with 62.5 inches.
-The following are the heights, in inches, of ten middle school basketball players. Determine the data range for the following data set. Also, construct a frequency table for the data set, use a class interval width of 2 and start with 62.5 inches.
Data range: 11 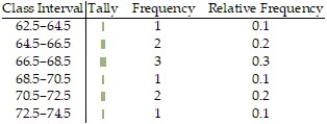
3
The frequency distribution below gives the weight in grams of 100 laboratory mice. What is the probability that the weight of a healthy mouse selected randomly from the sample will be more than 52 grams?
A) 0.33
B) 0.67
C) 0.50
D) 0.23
A) 0.33
B) 0.67
C) 0.50
D) 0.23
0.33
4
Given the frequency distribution below, what is the probability of the hourly wage of a person chosen at random from the sample being less than $4.495?
A) 0.08
B) 0.20
C) 0.80
D) 0.75
A) 0.08
B) 0.20
C) 0.80
D) 0.75
Unlock Deck
Unlock for access to all 65 flashcards in this deck.
Unlock Deck
k this deck
5
Construct the specified histogram:
-Eighty U. S households were surveyed about MP3 players. The table gives the frequency distribution for the data. Construct a histogram.
-Eighty U. S households were surveyed about MP3 players. The table gives the frequency distribution for the data.
Construct a histogram. Unlock Deck
Unlock for access to all 65 flashcards in this deck.
Unlock Deck
k this deck
6
Construct the specified histogram:
-Construct a histogram for the following frequency table.
-Construct a histogram for the following frequency table.
Unlock Deck
Unlock for access to all 65 flashcards in this deck.
Unlock Deck
k this deck
7
Construct the specified histogram:
-Twenty voters were asked their age. The results are summarized in the frequency table below. Construct a histogram.
-Twenty voters were asked their age. The results are summarized in the frequency table below.
Construct a histogram. Unlock Deck
Unlock for access to all 65 flashcards in this deck.
Unlock Deck
k this deck
8
Construct the specified histogram:
-Construct a histogram for the following set of data on oil rig utilization by type.
-Construct a histogram for the following set of data on oil rig utilization by type.
Unlock Deck
Unlock for access to all 65 flashcards in this deck.
Unlock Deck
k this deck
9
Construct a bar graph of the given frequency distribution:
-The frequency distribution indicates the height in feet of persons in a group of 216 people.
A)
B)
C)
D)
-The frequency distribution indicates the height in feet of persons in a group of 216 people.
A)
B)
C)
D)
Unlock Deck
Unlock for access to all 65 flashcards in this deck.
Unlock Deck
k this deck
10
Construct a bar graph of the given frequency distribution:
-The frequency distribution indicates the number of fish caught by each fisherman in a group of 250 fishermen.
A)
B)
C)
D)
-The frequency distribution indicates the number of fish caught by each fisherman in a group of 250 fishermen.
A)
B)
C)
D)
Unlock Deck
Unlock for access to all 65 flashcards in this deck.
Unlock Deck
k this deck
11
Construct a broken-line graph of the data in the table:
-The following table shows the number of computer sales made at Computer Buy over five months. Use time on the horizontal scale for your line graph.
-The following table shows the number of computer sales made at Computer Buy over five months. Use time on the horizontal scale for your line graph.
Unlock Deck
Unlock for access to all 65 flashcards in this deck.
Unlock Deck
k this deck
12
Construct a broken-line graph of the data in the table:
-The following table gives the total amount of precipitation during the given months. Use time on the horizontal scale for your line graph.
-The following table gives the total amount of precipitation during the given months. Use time on the horizontal scale for your line graph.
Unlock Deck
Unlock for access to all 65 flashcards in this deck.
Unlock Deck
k this deck
13
Construct a pie graph, with sectors given in percent, to represent the data in the given table:
-
A)
B)
C)
D)
-
A)
B)
C)
D)
Unlock Deck
Unlock for access to all 65 flashcards in this deck.
Unlock Deck
k this deck
14
Construct a pie graph, with sectors given in percent, to represent the data in the given table:
-
A)
B)
C)
D)
-
A)
B)
C)
D)
Unlock Deck
Unlock for access to all 65 flashcards in this deck.
Unlock Deck
k this deck
15
Construct a pie graph, with sectors given in percent, to represent the data in the given table:
-
A)
B)
C)
D)
-
A)
B)
C)
D)
Unlock Deck
Unlock for access to all 65 flashcards in this deck.
Unlock Deck
k this deck
16
Construct a frequency polygon:
-
A)
B)
-
A)
B)
Unlock Deck
Unlock for access to all 65 flashcards in this deck.
Unlock Deck
k this deck
17
Construct a frequency polygon:
-
A)
B)
-
A)
B)
Unlock Deck
Unlock for access to all 65 flashcards in this deck.
Unlock Deck
k this deck
18
Find the mean for the data set:
2, 11, 35, 2, 9, 35, 11, 9, 7, 2, 2, 2, 2, 9, 2
A) 2
B) 11
C) 9.33
D) 7
2, 11, 35, 2, 9, 35, 11, 9, 7, 2, 2, 2, 2, 9, 2
A) 2
B) 11
C) 9.33
D) 7
Unlock Deck
Unlock for access to all 65 flashcards in this deck.
Unlock Deck
k this deck
19
Following is a sample of the percent increases in the price of a house from 2002 to 2007 in 8 regions of the U. S.
75 130 145 150 150 225 225 300
Find the mean.
A) 225
B) 175
C) 150
D) 300
75 130 145 150 150 225 225 300
Find the mean.
A) 225
B) 175
C) 150
D) 300
Unlock Deck
Unlock for access to all 65 flashcards in this deck.
Unlock Deck
k this deck
20
In the English department of a midwestern university, the annual salaries of five faculty members are $34,000, $35,000, $36,000, $36,500 and $65,000.
Compute the mean.
A) $50,750
B) $36000
C) $41,300
D) $34,000
Compute the mean.
A) $50,750
B) $36000
C) $41,300
D) $34,000
Unlock Deck
Unlock for access to all 65 flashcards in this deck.
Unlock Deck
k this deck
21
A small company employs a supervisor at $1200 a week, an inventory manager at $800 a week, 5 stock boys at $400 a week each, and 3 drivers at $700 a week each.
A) $550
B) $610
C) $1017
D) $1260
A) $550
B) $610
C) $1017
D) $1260
Unlock Deck
Unlock for access to all 65 flashcards in this deck.
Unlock Deck
k this deck
22
Find the mean for the following grouped data.
A) 15.5
B) 17.1
C) 19.5
D) 7.5
A) 15.5
B) 17.1
C) 19.5
D) 7.5
Unlock Deck
Unlock for access to all 65 flashcards in this deck.
Unlock Deck
k this deck
23
Find the mean for the following grouped data.
A) 11
B) 14
C) 16.47
D) 17
A) 11
B) 14
C) 16.47
D) 17
Unlock Deck
Unlock for access to all 65 flashcards in this deck.
Unlock Deck
k this deck
24
Find the median for the data set:
2, 14, 35, 2, 8, 35, 14, 8, 6, 2, 2, 2, 2, 8, 2
A) 9.47
B) 8
C) 14.25
D) 6
2, 14, 35, 2, 8, 35, 14, 8, 6, 2, 2, 2, 2, 8, 2
A) 9.47
B) 8
C) 14.25
D) 6
Unlock Deck
Unlock for access to all 65 flashcards in this deck.
Unlock Deck
k this deck
25
Following is a sample of the percent increases in the price of a house from 2000 to 2005 in 8 regions of the U. S.
75 130 145 150 150 225 225 300
Find the median.
A) 225
B) 150
C) 137.5
D) 300
75 130 145 150 150 225 225 300
Find the median.
A) 225
B) 150
C) 137.5
D) 300
Unlock Deck
Unlock for access to all 65 flashcards in this deck.
Unlock Deck
k this deck
26
Find the median for the following grouped data.
A) 11.35
B) 9.875
C) 10
D) 8.35
A) 11.35
B) 9.875
C) 10
D) 8.35
Unlock Deck
Unlock for access to all 65 flashcards in this deck.
Unlock Deck
k this deck
27
Find the median for the following grouped data.
A) 9.5
B) 11.5
C) 7.60
D) 7.25
A) 9.5
B) 11.5
C) 7.60
D) 7.25
Unlock Deck
Unlock for access to all 65 flashcards in this deck.
Unlock Deck
k this deck
28
Find the mode for the data set:
3, 13, 30, 3, 8, 30, 13, 8, 6, 3, 3, 3, 3, 8, 3
A) 9.6
B) 7
C) 3
D) 13
3, 13, 30, 3, 8, 30, 13, 8, 6, 3, 3, 3, 3, 8, 3
A) 9.6
B) 7
C) 3
D) 13
Unlock Deck
Unlock for access to all 65 flashcards in this deck.
Unlock Deck
k this deck
29
Find the mode for the data set:
2, 11, 35, 2, 9, 35, 11, 9, 7, 2, 2, 2, 2, 9, 2
A) 9.3
B) 7
C) 11
D) 2
2, 11, 35, 2, 9, 35, 11, 9, 7, 2, 2, 2, 2, 9, 2
A) 9.3
B) 7
C) 11
D) 2
Unlock Deck
Unlock for access to all 65 flashcards in this deck.
Unlock Deck
k this deck
30
Which single measure of central tendency - mean, median, or mode - would you say best describes the given set of measurements?
-
A) The Mean
B) The Mode
C) The Median
-
A) The Mean
B) The Mode
C) The Median
Unlock Deck
Unlock for access to all 65 flashcards in this deck.
Unlock Deck
k this deck
31
Which single measure of central tendency - mean, median, or mode - would you say best describes the given set of measurements?
-
A) The Median
B) The Mean
C) The Mode
-
A) The Median
B) The Mean
C) The Mode
Unlock Deck
Unlock for access to all 65 flashcards in this deck.
Unlock Deck
k this deck
32
If an investor purchased 50 shares of Pearson Education stock at $85 per share, 90 shares at $105 per share, 120 shares at $110 per share and another 75 shares at $130 per share. What is the mean cost per share?
A) $110.25
B) $109.40
C) $130.50
D) $105.50
A) $110.25
B) $109.40
C) $130.50
D) $105.50
Unlock Deck
Unlock for access to all 65 flashcards in this deck.
Unlock Deck
k this deck
33
In the English department of a midwestern university, the annual salaries of five faculty members are $34,000, $35,000, $36,000, $36,500 and $65,000.
Compute the median.
A) $36,000
B) $41,300
C) $50,750
D) $34,000
Compute the median.
A) $36,000
B) $41,300
C) $50,750
D) $34,000
Unlock Deck
Unlock for access to all 65 flashcards in this deck.
Unlock Deck
k this deck
34
Here are the prices for 8 different MP3 players. Find the standard deviation.
$195 $358 $201 $276 $161 $301 $387 $128
Round to one decimal place.
A) 329.5
B) 144.5
C) 94.1
D) 238.5
$195 $358 $201 $276 $161 $301 $387 $128
Round to one decimal place.
A) 329.5
B) 144.5
C) 94.1
D) 238.5
Unlock Deck
Unlock for access to all 65 flashcards in this deck.
Unlock Deck
k this deck
35
Here are the commutes (in miles) for a group of six students. Find the standard deviation.
14.7 16.3 34.0 33.7 22.6 16.0
Round to two decimal places.
A) 3141.91
B) 3540.25
C) 33.93
D) 8.93
14.7 16.3 34.0 33.7 22.6 16.0
Round to two decimal places.
A) 3141.91
B) 3540.25
C) 33.93
D) 8.93
Unlock Deck
Unlock for access to all 65 flashcards in this deck.
Unlock Deck
k this deck
36
Find the standard deviation for the following data set:
2, 2, 2, 5, 5, 6, 6, 8, 8, 9
A) 2
B) 6.21
C) 2.49
D) 5
2, 2, 2, 5, 5, 6, 6, 8, 8, 9
A) 2
B) 6.21
C) 2.49
D) 5
Unlock Deck
Unlock for access to all 65 flashcards in this deck.
Unlock Deck
k this deck
37
What proportion of the following sample of ten measurements lies within 1 standard deviation of the mean?
A) 60%
B) 40%
C) 80%
D) 100%
A) 60%
B) 40%
C) 80%
D) 100%
Unlock Deck
Unlock for access to all 65 flashcards in this deck.
Unlock Deck
k this deck
38
What proportion of the following sample of ten measurements lies within 2 standard deviations of the mean?
A) 100%
B) 80%
C) 70%
D) 90%
A) 100%
B) 80%
C) 70%
D) 90%
Unlock Deck
Unlock for access to all 65 flashcards in this deck.
Unlock Deck
k this deck
39
Find the standard deviation for the following grouped data:
A) 3.09
B) 9.5625
C) 3.256
D) 7.56
A) 3.09
B) 9.5625
C) 3.256
D) 7.56
Unlock Deck
Unlock for access to all 65 flashcards in this deck.
Unlock Deck
k this deck
40
The register of a college recorded the amount of time each student spent waiting in line during peak registration hours one Monday. The frequency table below summarizes the results. Find the standard deviation. Round your answer to one decimal place.
A) 5.4
B) 5.6
C) 5.3
D) 5.8
E) 5.9
A) 5.4
B) 5.6
C) 5.3
D) 5.8
E) 5.9
Unlock Deck
Unlock for access to all 65 flashcards in this deck.
Unlock Deck
k this deck
41
The test scores of 40 driver license applicants are summarized in the frequency table below. Find the standard deviation. Round your answer to one decimal place.
A) 12.0
B) 12.1
C) 12.7
D) 14.1
E) 13.4
Round your answer to one decimal place.A) 12.0
B) 12.1
C) 12.7
D) 14.1
E) 13.4
Unlock Deck
Unlock for access to all 65 flashcards in this deck.
Unlock Deck
k this deck
42
Here are the prices for 8 different MP3 players. Find the range.
$195 $358 $201 $276 $161 $301 $387 $128
A) 200
B) 259
C) 230
D) 195
$195 $358 $201 $276 $161 $301 $387 $128
A) 200
B) 259
C) 230
D) 195
Unlock Deck
Unlock for access to all 65 flashcards in this deck.
Unlock Deck
k this deck
43
Here are the commutes (in miles) for a group of six students.
14.7 16.3 34.0 33.7 22.6 16.0
Find the range rounded to one decimal place.
A) 16.0
B) 19.5
C) 19.3
D) 34.0
14.7 16.3 34.0 33.7 22.6 16.0
Find the range rounded to one decimal place.
A) 16.0
B) 19.5
C) 19.3
D) 34.0
Unlock Deck
Unlock for access to all 65 flashcards in this deck.
Unlock Deck
k this deck
44
Evaluate for the given values of n, x, and p.
-n = 30, x = 12, p = 0.20
A) 0.0028
B) 0.0139
C) 0.0064
D) 0.1082
for the given values of n, x, and p.-n = 30, x = 12, p = 0.20
A) 0.0028
B) 0.0139
C) 0.0064
D) 0.1082
Unlock Deck
Unlock for access to all 65 flashcards in this deck.
Unlock Deck
k this deck
45
Evaluate for the given values of n, x, and p.
-n = 6, x = 3, p =
A) 0.0322
B) 0.0154
C) 0.0286
D) 0.0536
for the given values of n, x, and p.-n = 6, x = 3, p =
A) 0.0322
B) 0.0154
C) 0.0286
D) 0.0536
Unlock Deck
Unlock for access to all 65 flashcards in this deck.
Unlock Deck
k this deck
46
A fair coin is tossed fourteen times. What is the probability of obtaining the following? Express the answer both in terms of and as a four-place decimal.
-Exactly 12 heads?
of and as a four-place decimal.-Exactly 12 heads?
Unlock Deck
Unlock for access to all 65 flashcards in this deck.
Unlock Deck
k this deck
47
Construct a histogram for the binomial distribution ,and compute the mean and standard deviation:
-n = 6, p =
,and compute the mean and standard deviation:-n = 6, p =
Unlock Deck
Unlock for access to all 65 flashcards in this deck.
Unlock Deck
k this deck
48
Construct a histogram for the binomial distribution ,and compute the mean and standard deviation:
-n = 7 and p =
,and compute the mean and standard deviation:-n = 7 and p =
Unlock Deck
Unlock for access to all 65 flashcards in this deck.
Unlock Deck
k this deck
49
According to a college survey, 22% of all students do not work. Find the standard deviation for the random variable X, the number of students who do not work in samples of size 16.
A) 1.88
B) 2.75
C) 3.52
D) 1.66
A) 1.88
B) 2.75
C) 3.52
D) 1.66
Unlock Deck
Unlock for access to all 65 flashcards in this deck.
Unlock Deck
k this deck
50
If a baseball player has a batting average of 0.420, what is the probability that the player will get at least 2 hits in the next four times at bat?
A) 0.333
B) 0.042
C) 0.50
D) 0.559
A) 0.333
B) 0.042
C) 0.50
D) 0.559
Unlock Deck
Unlock for access to all 65 flashcards in this deck.
Unlock Deck
k this deck
51
A botanist wants to grow a rare plant in his greenhouse. The probability that a given bulb will mature is 0.42. Suppose 6 bulbs are planted.(A) Write the probability function defining this distribution.(B) What is the probability that 3 or more bulbs will mature?(Round your answer to three decimal places.)
Unlock Deck
Unlock for access to all 65 flashcards in this deck.
Unlock Deck
k this deck
52
In a certain college, 33% of the math majors belong to foreign student. If 10 students are selected at random from the math majors, that is the probability that no more than 6 are foreign?
A) 0.9815
B) 0.913
C) 0.9846
D) 0.0547
A) 0.9815
B) 0.913
C) 0.9846
D) 0.0547
Unlock Deck
Unlock for access to all 65 flashcards in this deck.
Unlock Deck
k this deck
53
According to a college survey, 22% of all students work full time. Find the mean for the random variable X, the number of students who work full time in samples of size 16.Find the mean of the binomial distribution.
A) 2.75
B) 3.52
C) 0.22
D) 4.00
A) 2.75
B) 3.52
C) 0.22
D) 4.00
Unlock Deck
Unlock for access to all 65 flashcards in this deck.
Unlock Deck
k this deck
54
A normal random variable X has mean 40 and standard deviation 16. Find the area under the normal curve above the interval 16-60.
A) 0.8089
B) 0.8276
C) 0.8962
D) 0.7324
A) 0.8089
B) 0.8276
C) 0.8962
D) 0.7324
Unlock Deck
Unlock for access to all 65 flashcards in this deck.
Unlock Deck
k this deck
55
The life expectancy (in hours) of a fluorescent tube is normally distributed with mean 7,000 and standard deviation 1,000. Find the probability that a tube lasts for more than 8,900 hours.
A) 0.9719
B) 0.0287
C) 0.9713
D) 0.0281
A) 0.9719
B) 0.0287
C) 0.9713
D) 0.0281
Unlock Deck
Unlock for access to all 65 flashcards in this deck.
Unlock Deck
k this deck
56
A normal distribution has mean 200 and standard deviation 50. Find the area under the normal curve from the mean to 224.
A) 0.5000
B) 0.6844
C) 0.1844
D) 0.6808
A) 0.5000
B) 0.6844
C) 0.1844
D) 0.6808
Unlock Deck
Unlock for access to all 65 flashcards in this deck.
Unlock Deck
k this deck
57
Given a normal distribution with mean 120 and standard deviation 5, find the number of standard deviations the measurement is from the mean. Express the answer as a positive number.
-125
A) 2
B) 3
C) 0
D) 1
-125
A) 2
B) 3
C) 0
D) 1
Unlock Deck
Unlock for access to all 65 flashcards in this deck.
Unlock Deck
k this deck
58
Given a normal distribution with mean 120 and standard deviation 5, find the number of standard deviations the measurement is from the mean. Express the answer as a positive number.
-107
A) 1.4
B) 2.6
C) 3.2
D) 2
-107
A) 1.4
B) 2.6
C) 3.2
D) 2
Unlock Deck
Unlock for access to all 65 flashcards in this deck.
Unlock Deck
k this deck
59
Given a normal distribution with mean 120 and standard deviation 5, find the number of standard deviations the measurement is from the mean. Express the answer as a positive number.
-134.9
A) 2.98
B) 3.02
C) 3.25
D) 2.18
-134.9
A) 2.98
B) 3.02
C) 3.25
D) 2.18
Unlock Deck
Unlock for access to all 65 flashcards in this deck.
Unlock Deck
k this deck
60
Given a normal distribution with mean 120 and standard deviation 5, find the number of standard deviations the measurement is from the mean. Express the answer as a positive number.
-114.2
A) 2.12
B) 1.2
C) 2.4
D) 1.16
-114.2
A) 2.12
B) 1.2
C) 2.4
D) 1.16
Unlock Deck
Unlock for access to all 65 flashcards in this deck.
Unlock Deck
k this deck
61
Use the rule-of-thumb test to check whether a normal distribution (with the same mean and standard deviation as the binomial distribution) is a suitable approximation for the binomial distribution with given the properties:
-n = 20, p = .8
-n = 20, p = .8
Unlock Deck
Unlock for access to all 65 flashcards in this deck.
Unlock Deck
k this deck
62
Use the rule-of-thumb test to check whether a normal distribution (with the same mean and standard deviation as the binomial distribution) is a suitable approximation for the binomial distribution with given the properties:
-n = 400, p = 0.06
-n = 400, p = 0.06
Unlock Deck
Unlock for access to all 65 flashcards in this deck.
Unlock Deck
k this deck
63
Assume the distribution is normal. Use the area of the normal curve to answer the question. Round to the nearest whole percent:
-The mean clotting time of blood is 7.35 seconds, with a standard deviation of 0.35 seconds. What is the probability that blood clotting time will be less than 7 seconds?
A) 14%
B) 16%
C) 15%
D) 84%
-The mean clotting time of blood is 7.35 seconds, with a standard deviation of 0.35 seconds. What is the probability that blood clotting time will be less than 7 seconds?
A) 14%
B) 16%
C) 15%
D) 84%
Unlock Deck
Unlock for access to all 65 flashcards in this deck.
Unlock Deck
k this deck
64
Assume the distribution is normal. Use the area of the normal curve to answer the question. Round to the nearest whole percent:
-The average size of the bass in a lake is 11.4 inches, with a standard deviation of 3.2 inches. Find the probability of catching a bass longer than 17 inches.
A) 4%
B) 8%
C) 5%
D) 96%
-The average size of the bass in a lake is 11.4 inches, with a standard deviation of 3.2 inches. Find the probability of catching a bass longer than 17 inches.
A) 4%
B) 8%
C) 5%
D) 96%
Unlock Deck
Unlock for access to all 65 flashcards in this deck.
Unlock Deck
k this deck
65
Assume the distribution is normal. Use the area of the normal curve to answer the question. Round to the nearest whole percent:
-A machine produces screws with an average diameter of 0.30 inches and a standard deviation of 0.01 inches. What is the probability that a screw will have a diameter greater than 0.32 inches?
A) 3%
B) 1%
C) 2%
D) 97%
-A machine produces screws with an average diameter of 0.30 inches and a standard deviation of 0.01 inches. What is the probability that a screw will have a diameter greater than 0.32 inches?
A) 3%
B) 1%
C) 2%
D) 97%
Unlock Deck
Unlock for access to all 65 flashcards in this deck.
Unlock Deck
k this deck
Unlock Deck
Unlock for access to all 65 flashcards in this deck.


