Exam 10: Data Description and Probability Distributions
Exam 1: Linear Equations and Graphs59 Questions
Exam 2: Functions and Graphs178 Questions
Exam 3: Mathematics of Finance57 Questions
Exam 4: Systems of Linear Equations; Matrices115 Questions
Exam 5: Linear Inequalities and Linear Programming26 Questions
Exam 6: Linear Programming: The Simplex Method58 Questions
Exam 7: Logic, Sets, and Counting51 Questions
Exam 8: Probability59 Questions
Exam 9: Markov Chains60 Questions
Exam 10: Data Description and Probability Distributions65 Questions
Exam 11: Games and Decisions52 Questions
Exam 12: Appendix A: Basic Algebra Review45 Questions
Exam 13: Appendix B: Special Topics20 Questions
Select questions type
In the English department of a midwestern university, the annual salaries of five faculty members are $34,000, $35,000, $36,000, $36,500 and $65,000.
Compute the median.
Free
(Multiple Choice)
4.7/5  (34)
(34)
Correct Answer: Verified
A
Construct a histogram for the binomial distribution 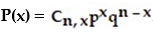 ,and compute the mean and standard deviation:
-n = 7 and p =
,and compute the mean and standard deviation:
-n = 7 and p = 
Free
(Short Answer)
4.9/5 (22)
Correct Answer:Verified
μ = 3.5; σ = 1.32 
If an investor purchased 50 shares of Pearson Education stock at $85 per share, 90 shares at $105 per share, 120 shares at $110 per share and another 75 shares at $130 per share. What is the mean cost per share?
Free
(Multiple Choice)
4.8/5 (32)
Correct Answer:Verified
B
Which single measure of central tendency - mean, median, or mode - would you say best describes the given set of measurements?
-
(Multiple Choice)
4.9/5 (35)
Construct the specified histogram:
-Eighty U. S households were surveyed about MP3 players. The table gives the frequency distribution for the data. 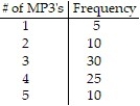
 Construct a histogram.
(Short Answer)
4.8/5 (34)
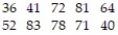
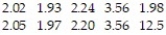
Here are the commutes (in miles) for a group of six students.
14.7 16.3 34.0 33.7 22.6 16.0
Find the range rounded to one decimal place.
(Multiple Choice)
4.9/5 (31)
Which single measure of central tendency - mean, median, or mode - would you say best describes the given set of measurements?
-
(Multiple Choice)
4.8/5 (34)
Given a normal distribution with mean 120 and standard deviation 5, find the number of standard deviations the measurement is from the mean. Express the answer as a positive number.
-134.9
(Multiple Choice)
4.8/5 (38)
Find the mean for the data set:
2, 11, 35, 2, 9, 35, 11, 9, 7, 2, 2, 2, 2, 9, 2
(Multiple Choice)
4.8/5 (42)
Find the standard deviation for the following data set:
2, 2, 2, 5, 5, 6, 6, 8, 8, 9
(Multiple Choice)
4.9/5 (40)
What proportion of the following sample of ten measurements lies within 1 standard deviation of the mean?

(Multiple Choice)
4.9/5 (40)
Construct a broken-line graph of the data in the table:
-The following table shows the number of computer sales made at Computer Buy over five months. Use time on the horizontal scale for your line graph. 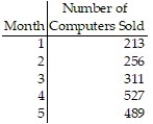
(Short Answer)
4.8/5 (29)
Use the rule-of-thumb test to check whether a normal distribution (with the same mean and standard deviation as the binomial distribution) is a suitable approximation for the binomial distribution with given the properties:
-n = 400, p = 0.06
(True/False)
4.8/5 (29)
Here are the prices for 8 different MP3 players. Find the standard deviation.
$195 $358 $201 $276 $161 $301 $387 $128
Round to one decimal place.
(Multiple Choice)
4.8/5 (31)
Given a normal distribution with mean 120 and standard deviation 5, find the number of standard deviations the measurement is from the mean. Express the answer as a positive number.
-107
(Multiple Choice)
4.9/5 (34)
Following is a sample of the percent increases in the price of a house from 2002 to 2007 in 8 regions of the U. S.
75 130 145 150 150 225 225 300
Find the mean.
(Multiple Choice)
4.8/5 (30)
A normal distribution has mean 200 and standard deviation 50. Find the area under the normal curve from the mean to 224.
(Multiple Choice)
4.9/5 (36)
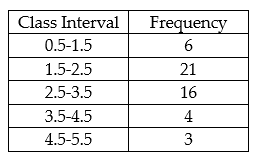
Construct the specified histogram:
-Construct a histogram for the following frequency table.
(Short Answer)
4.8/5 (26)
The test scores of 40 driver license applicants are summarized in the frequency table below. Find the standard deviation. 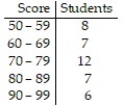 Round your answer to one decimal place.
(Multiple Choice)
4.9/5 (35)
Filters
- Essay(0)
- Multiple Choice(0)
- Short Answer(0)
- True False(0)
- Matching(0)