Deck 6: Discrete Probability Distributions
Full screen (f)
Question
Question
Question
Given the table of probabilities for the random variable x, does this form a probability distribution? 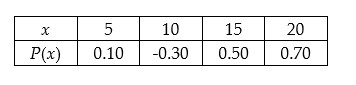
Question
Given the table of probabilities for the random variable x, does this form a probability distribution? 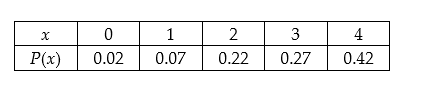
Question
Consider the discrete probability distribution to the right when answering the following question. Find the probability that x equals 4. 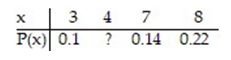
A) 0.46
B) 2.16
C) 1.84
D) 0.54
A) 0.46
B) 2.16
C) 1.84
D) 0.54
Question
Consider the discrete probability distribution to the right when answering the following question. Find the probability that x exceeds 4. 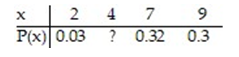
A) 0.97
B) 0.35
C) 0.38
D) 0.62
A) 0.97
B) 0.35
C) 0.38
D) 0.62
Question
An Apple Pie Company knows that the number of pies sold each day varies from day to day. The owner believes that on 50% of the days she sells 100 pies. On another 25% of the days she sells 150 pies, and she sells 200 pies on the remaining 25% of the days. To make sure she has enough product, the owner bakes 200 pies each day at a cost of $2.50 each. Assume any pies that go unsold are thrown out at the end of the day. If she sells the pies for $5 each, find the probability distribution for her daily profit.
A)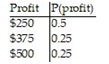
B)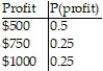
C)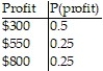
D)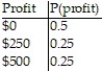
A)
B)
C)
D)
Question
Calculate the mean for the discrete probability distribution shown here. 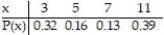
A) 26
B) 6.5
C) 6.96
D) 1.74
A) 26
B) 6.5
C) 6.96
D) 1.74
Question
A lab orders a shipment of 100 rats a week, 52 weeks a year, from a rat supplier for experiments that the lab conducts. Prices for each weekly shipment of rats follow the distribution below:
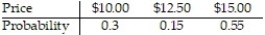
Suppose the mean cost of the rats turned out to be $13.13 per week. Interpret this value.
A) The average cost for all weekly rat purchases is $13.13.
B) The rat cost that occurs more often than any other is $13.13.
C) Most of the weeks resulted in rat costs of $13.13.
D) The median cost for the distribution of rat costs is $13.13.
Question
The produce manager at a farmer's market was interested in determining how many oranges a person buys when they buy oranges. He asked the cashiers over a weekend to count how many oranges a person bought when they bought oranges and record this number for analysis at a later time. The data is given below in the table. The random variable x represents the number of oranges purchased and P(x) represents the probability that a customer will buy x apples. Determine the mean number of oranges purchased by a customer. 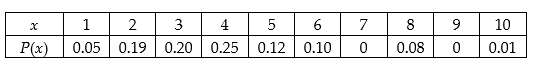
A) 3.97
B) 3
C) 4
D) 5.50
A) 3.97
B) 3
C) 4
D) 5.50
Question
A seed company has a test plot in which it is testing the germination of a hybrid seed. They plant 50 rows of 40 seeds per row. After a two-week period, the researchers count how many seed per row have sprouted. They noted that least number of seeds to germinate was 33 and some rows had all 40 germinate. The germination data is given below in the table. The random variable x represents the number of seed in a row that germinated and P(x) represents the probability of selecting a row with that number of seed germinating. Determine the mean number of seeds per row that germinated.
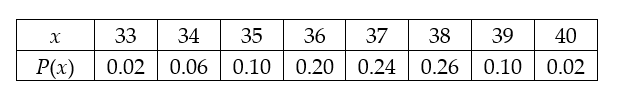
A) 36.9
B) 36.5
C) 0.13
D) 36
A) 36.9
B) 36.5
C) 0.13
D) 36
Question
A manager asked her employees how many times they had given blood in the last year. The results of the survey are given below. The random variable x represents the number of times a person gave blood and P(x) represents the probability of selecting an employee who had given blood that percent of the time. What is the mean number of times a person gave blood based on this survey? 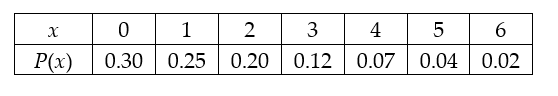
A) 2.0
B) 0.14
C) 1.6
D) 3.0
A) 2.0
B) 0.14
C) 1.6
D) 3.0
Question
A lab orders a shipment of 100 rats a week, 52 weeks a year, from a rat supplier for experiments that the lab conducts. Prices for each weekly shipment of rats follow the distribution below:
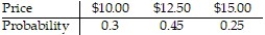
How much should the lab budget for next year's rat orders assuming this distribution does not change. (Hint: find the expected price.)
A) $1238.00
B) $643.50
C) $12.38
D) $3,346,200.00
How much should the lab budget for next year's rat orders assuming this distribution does not change. (Hint: find the expected price.)
A) $1238.00
B) $643.50
C) $12.38
D) $3,346,200.00
Question
A dice game involves throwing three dice and betting on one of the six numbers that are on the dice. The game costs $11 to play, and you win if the number you bet appears on any of the dice. The distribution for the outcomes of the game (including the profit) is shown below: 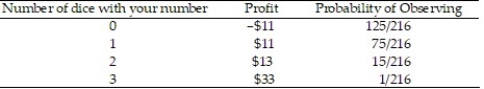 Find your expected profit from playing this game.
A) -$1.53
B) $11.20
C) $0.50
D) $5.96
Find your expected profit from playing this game.A) -$1.53
B) $11.20
C) $0.50
D) $5.96
Question
A legendary football coach was known for his winning seasons. He consistently won nine or more games per season. Suppose x equals the number of games won up to the halfway mark (six games) in a  season. If this coach and his team had a probability
  of winning any one game (and the winning or losing of one game was independent of another), then the probability distribution of the number x of winning games in a series of six games is:
 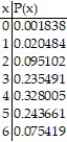 Find the expected number of winning games in the first half of the season for this coach's football teams.
season. If this coach and his team had a probability of winning any one game (and the winning or losing of one game was independent of another), then the probability distribution of the number x of winning games in a series of six games is: Find the expected number of winning games in the first half of the season for this coach's football teams. Question
Question
An automobile insurance company estimates the following loss probabilities for the next year on a $25,000 sports car: 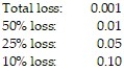 Assuming the company will sell only a $500 deductible policy for this model (i.e., the owner covers the first $500 damage), how much annual premium should the company charge in order to average $500 profit per policy sold?
Assuming the company will sell only a $500 deductible policy for this model (i.e., the owner covers the first $500 damage), how much annual premium should the company charge in order to average $500 profit per policy sold? Question
The random variable x represents the number of tests that a patient entering a clinic will have along with the corresponding probabilities. Find the mean and standard deviation for the random variable x. 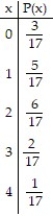
A) mean: 3.72; standard deviation: 2.52
B) mean: 2.52; standard deviation: 1.93
C) mean: 1.59; standard deviation: 1.09
D) mean: 1.59; standard deviation: 3.72
A) mean: 3.72; standard deviation: 2.52
B) mean: 2.52; standard deviation: 1.93
C) mean: 1.59; standard deviation: 1.09
D) mean: 1.59; standard deviation: 3.72
Question
The random variable x represents the number of computers that families have along with the corresponding probabilities. Find the mean and standard deviation for the random variable x. 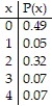
A) mean: 1.39; standard deviation: 0.64
B) mean: 1.18; standard deviation: 1.30
C) mean: 1.39; standard deviation: 0.80
D) mean: 1.18; standard deviation: 0.64
A) mean: 1.39; standard deviation: 0.64
B) mean: 1.18; standard deviation: 1.30
C) mean: 1.39; standard deviation: 0.80
D) mean: 1.18; standard deviation: 0.64
Question
In a sandwich shop, the following probability distribution was obtained. The random variable x represents the number of condiments used for a hamburger. Find the mean and standard deviation for the random variable x. 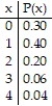
A) mean: 1.30; standard deviation: 2.38
B) mean: 1.14; standard deviation: 1.04
C) mean: 1.30; standard deviation: 1.54
D) mean: 1.54; standard deviation: 1.30
A) mean: 1.30; standard deviation: 2.38
B) mean: 1.14; standard deviation: 1.04
C) mean: 1.30; standard deviation: 1.54
D) mean: 1.54; standard deviation: 1.30
Question
The owner of a farmer's market was interested in determining how many oranges a person buys when they buy oranges. He asked the cashiers over a weekend to count how many oranges a person bought when they bought oranges and record this number for analysis at a later time. The data is given below in the table. The random variable x represents the number of oranges purchased and P(x) represents the probability that a customer will buy x oranges. Determine the variance of the number of oranges purchased by a customer. 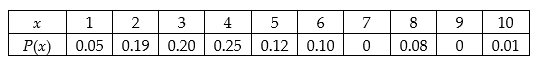
A) 1.95
B) 3.97
C) 0.56
D) 3.57
A) 1.95
B) 3.97
C) 0.56
D) 3.57
Question
A manager at a local company asked his employees how many times they had given blood in the last year. The results of the survey are given below. The random variable x represents the number of times a person gave blood and P(x) represents the probability of selecting an employee who had given blood that percent of the time. What is the standard deviation for the number of times a person gave blood based on this survey? 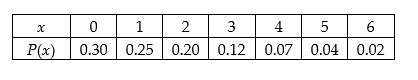
A) 1.16
B) 1.54
C) 2.23
D) 1.82
A) 1.16
B) 1.54
C) 2.23
D) 1.82
Question
A seed company has a test plot in which it is testing the germination of a hybrid seed. They plant 50 rows of 40 seeds per row. After a two-week period, the researchers count how many seed per row have sprouted. They noted that least number of seeds to germinate was 33 and some rows had all 40 germinate. The germination data is given below in the table. The random variable x represents the number of seed in a row that germinated and P(x) represents the probability of selecting a row with that number of seed germinating. Determine the standard deviation of the number of seeds per row that germinated. 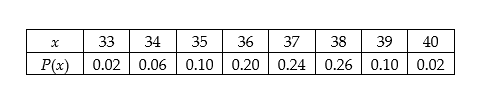
A) 6.07
B) 1.51
C) 7.13
D) 36.86
A) 6.07
B) 1.51
C) 7.13
D) 36.86
Question
If p is the probability of success of a binomial experiment, then the probability of failure is
A)
B)
C) -p
D) 1 - p
A)
B)
C) -p
D) 1 - p
Question
Question
Question
Question
Question
Question
Question
Question
Suppose x is a random variable for which a Poisson probability distribution with  provides a good characterization. Find ? for x.
A) 10.4
B) 108.16
C) 3.22
D) 5.2
provides a good characterization. Find ? for x.A) 10.4
B) 108.16
C) 3.22
D) 5.2

Unlock Deck
Sign up to unlock the cards in this deck!
Unlock Deck
Unlock Deck
1/32
Play
Full screen (f)
Deck 6: Discrete Probability Distributions
1
The peak shopping time at home improvement store is between 8:00am-11:00 am on Saturday mornings. Management at the home improvement store randomly selected 175 customers last Saturday morning and decided to observe their shopping habits. They recorded the number of items that each of the customers purchased as well as the total time the customers spent in the store. Identify the types of variables recorded by the home improvement store.
A) number of items - continuous; total time - continuous
B) number of items - continuous; total time - discrete
C) number of items - discrete; total time - discrete
D) number of items - discrete; total time - continuous
A) number of items - continuous; total time - continuous
B) number of items - continuous; total time - discrete
C) number of items - discrete; total time - discrete
D) number of items - discrete; total time - continuous
number of items - discrete; total time - continuous
2
A random variable is
A) a qualitative attribute of a population.
B) a numerical measure of the outcome of a probability experiment.
C) the variable for which an algebraic equation is solved.
D) generated by a random number table.
A) a qualitative attribute of a population.
B) a numerical measure of the outcome of a probability experiment.
C) the variable for which an algebraic equation is solved.
D) generated by a random number table.
a numerical measure of the outcome of a probability experiment.
3
Given the table of probabilities for the random variable x, does this form a probability distribution?
False
4
Given the table of probabilities for the random variable x, does this form a probability distribution?
Unlock Deck
Unlock for access to all 32 flashcards in this deck.
Unlock Deck
k this deck
5
Consider the discrete probability distribution to the right when answering the following question. Find the probability that x equals 4.
A) 0.46
B) 2.16
C) 1.84
D) 0.54
A) 0.46
B) 2.16
C) 1.84
D) 0.54
Unlock Deck
Unlock for access to all 32 flashcards in this deck.
Unlock Deck
k this deck
6
Consider the discrete probability distribution to the right when answering the following question. Find the probability that x exceeds 4.
A) 0.97
B) 0.35
C) 0.38
D) 0.62
A) 0.97
B) 0.35
C) 0.38
D) 0.62
Unlock Deck
Unlock for access to all 32 flashcards in this deck.
Unlock Deck
k this deck
7
An Apple Pie Company knows that the number of pies sold each day varies from day to day. The owner believes that on 50% of the days she sells 100 pies. On another 25% of the days she sells 150 pies, and she sells 200 pies on the remaining 25% of the days. To make sure she has enough product, the owner bakes 200 pies each day at a cost of $2.50 each. Assume any pies that go unsold are thrown out at the end of the day. If she sells the pies for $5 each, find the probability distribution for her daily profit.
A)
B)
C)
D)
A)
B)
C)
D)
Unlock Deck
Unlock for access to all 32 flashcards in this deck.
Unlock Deck
k this deck
8
Calculate the mean for the discrete probability distribution shown here.
A) 26
B) 6.5
C) 6.96
D) 1.74
A) 26
B) 6.5
C) 6.96
D) 1.74
Unlock Deck
Unlock for access to all 32 flashcards in this deck.
Unlock Deck
k this deck
9
A lab orders a shipment of 100 rats a week, 52 weeks a year, from a rat supplier for experiments that the lab conducts. Prices for each weekly shipment of rats follow the distribution below:
Suppose the mean cost of the rats turned out to be $13.13 per week. Interpret this value.
A) The average cost for all weekly rat purchases is $13.13.
B) The rat cost that occurs more often than any other is $13.13.
C) Most of the weeks resulted in rat costs of $13.13.
D) The median cost for the distribution of rat costs is $13.13.
Unlock Deck
Unlock for access to all 32 flashcards in this deck.
Unlock Deck
k this deck
10
The produce manager at a farmer's market was interested in determining how many oranges a person buys when they buy oranges. He asked the cashiers over a weekend to count how many oranges a person bought when they bought oranges and record this number for analysis at a later time. The data is given below in the table. The random variable x represents the number of oranges purchased and P(x) represents the probability that a customer will buy x apples. Determine the mean number of oranges purchased by a customer.
A) 3.97
B) 3
C) 4
D) 5.50
A) 3.97
B) 3
C) 4
D) 5.50
Unlock Deck
Unlock for access to all 32 flashcards in this deck.
Unlock Deck
k this deck
11
A seed company has a test plot in which it is testing the germination of a hybrid seed. They plant 50 rows of 40 seeds per row. After a two-week period, the researchers count how many seed per row have sprouted. They noted that least number of seeds to germinate was 33 and some rows had all 40 germinate. The germination data is given below in the table. The random variable x represents the number of seed in a row that germinated and P(x) represents the probability of selecting a row with that number of seed germinating. Determine the mean number of seeds per row that germinated.
A) 36.9
B) 36.5
C) 0.13
D) 36
A) 36.9
B) 36.5
C) 0.13
D) 36
Unlock Deck
Unlock for access to all 32 flashcards in this deck.
Unlock Deck
k this deck
12
A manager asked her employees how many times they had given blood in the last year. The results of the survey are given below. The random variable x represents the number of times a person gave blood and P(x) represents the probability of selecting an employee who had given blood that percent of the time. What is the mean number of times a person gave blood based on this survey?
A) 2.0
B) 0.14
C) 1.6
D) 3.0
A) 2.0
B) 0.14
C) 1.6
D) 3.0
Unlock Deck
Unlock for access to all 32 flashcards in this deck.
Unlock Deck
k this deck
13
A lab orders a shipment of 100 rats a week, 52 weeks a year, from a rat supplier for experiments that the lab conducts. Prices for each weekly shipment of rats follow the distribution below:
How much should the lab budget for next year's rat orders assuming this distribution does not change. (Hint: find the expected price.)
A) $1238.00
B) $643.50
C) $12.38
D) $3,346,200.00
How much should the lab budget for next year's rat orders assuming this distribution does not change. (Hint: find the expected price.)
A) $1238.00
B) $643.50
C) $12.38
D) $3,346,200.00
Unlock Deck
Unlock for access to all 32 flashcards in this deck.
Unlock Deck
k this deck
14
A dice game involves throwing three dice and betting on one of the six numbers that are on the dice. The game costs $11 to play, and you win if the number you bet appears on any of the dice. The distribution for the outcomes of the game (including the profit) is shown below: Find your expected profit from playing this game.
A) -$1.53
B) $11.20
C) $0.50
D) $5.96
Find your expected profit from playing this game.A) -$1.53
B) $11.20
C) $0.50
D) $5.96
Unlock Deck
Unlock for access to all 32 flashcards in this deck.
Unlock Deck
k this deck
15
A legendary football coach was known for his winning seasons. He consistently won nine or more games per season. Suppose x equals the number of games won up to the halfway mark (six games) in a season. If this coach and his team had a probability of winning any one game (and the winning or losing of one game was independent of another), then the probability distribution of the number x of winning games in a series of six games is: Find the expected number of winning games in the first half of the season for this coach's football teams.
season. If this coach and his team had a probability of winning any one game (and the winning or losing of one game was independent of another), then the probability distribution of the number x of winning games in a series of six games is: Find the expected number of winning games in the first half of the season for this coach's football teams. Unlock Deck
Unlock for access to all 32 flashcards in this deck.
Unlock Deck
k this deck
16
On one busy holiday weekend, a national airline has many requests for standby flights at half of the usual one-way air fare. However, past experience has shown that these passengers have only about a 1 in 5 chance of getting on the standby flight. When they fail to get on a flight as a standby, their only other choice is to fly first class on the next flight out. Suppose that the usual one-way air fare to a certain city is $124 and the cost of flying first class is $385. Should a passenger who wishes to fly to this city opt to fly as a standby? [Hint: Find the expected cost of the trip for a person flying standby.]
Unlock Deck
Unlock for access to all 32 flashcards in this deck.
Unlock Deck
k this deck
17
An automobile insurance company estimates the following loss probabilities for the next year on a $25,000 sports car: Assuming the company will sell only a $500 deductible policy for this model (i.e., the owner covers the first $500 damage), how much annual premium should the company charge in order to average $500 profit per policy sold?
Assuming the company will sell only a $500 deductible policy for this model (i.e., the owner covers the first $500 damage), how much annual premium should the company charge in order to average $500 profit per policy sold? Unlock Deck
Unlock for access to all 32 flashcards in this deck.
Unlock Deck
k this deck
18
The random variable x represents the number of tests that a patient entering a clinic will have along with the corresponding probabilities. Find the mean and standard deviation for the random variable x.
A) mean: 3.72; standard deviation: 2.52
B) mean: 2.52; standard deviation: 1.93
C) mean: 1.59; standard deviation: 1.09
D) mean: 1.59; standard deviation: 3.72
A) mean: 3.72; standard deviation: 2.52
B) mean: 2.52; standard deviation: 1.93
C) mean: 1.59; standard deviation: 1.09
D) mean: 1.59; standard deviation: 3.72
Unlock Deck
Unlock for access to all 32 flashcards in this deck.
Unlock Deck
k this deck
19
The random variable x represents the number of computers that families have along with the corresponding probabilities. Find the mean and standard deviation for the random variable x.
A) mean: 1.39; standard deviation: 0.64
B) mean: 1.18; standard deviation: 1.30
C) mean: 1.39; standard deviation: 0.80
D) mean: 1.18; standard deviation: 0.64
A) mean: 1.39; standard deviation: 0.64
B) mean: 1.18; standard deviation: 1.30
C) mean: 1.39; standard deviation: 0.80
D) mean: 1.18; standard deviation: 0.64
Unlock Deck
Unlock for access to all 32 flashcards in this deck.
Unlock Deck
k this deck
20
In a sandwich shop, the following probability distribution was obtained. The random variable x represents the number of condiments used for a hamburger. Find the mean and standard deviation for the random variable x.
A) mean: 1.30; standard deviation: 2.38
B) mean: 1.14; standard deviation: 1.04
C) mean: 1.30; standard deviation: 1.54
D) mean: 1.54; standard deviation: 1.30
A) mean: 1.30; standard deviation: 2.38
B) mean: 1.14; standard deviation: 1.04
C) mean: 1.30; standard deviation: 1.54
D) mean: 1.54; standard deviation: 1.30
Unlock Deck
Unlock for access to all 32 flashcards in this deck.
Unlock Deck
k this deck
21
The owner of a farmer's market was interested in determining how many oranges a person buys when they buy oranges. He asked the cashiers over a weekend to count how many oranges a person bought when they bought oranges and record this number for analysis at a later time. The data is given below in the table. The random variable x represents the number of oranges purchased and P(x) represents the probability that a customer will buy x oranges. Determine the variance of the number of oranges purchased by a customer.
A) 1.95
B) 3.97
C) 0.56
D) 3.57
A) 1.95
B) 3.97
C) 0.56
D) 3.57
Unlock Deck
Unlock for access to all 32 flashcards in this deck.
Unlock Deck
k this deck
22
A manager at a local company asked his employees how many times they had given blood in the last year. The results of the survey are given below. The random variable x represents the number of times a person gave blood and P(x) represents the probability of selecting an employee who had given blood that percent of the time. What is the standard deviation for the number of times a person gave blood based on this survey?
A) 1.16
B) 1.54
C) 2.23
D) 1.82
A) 1.16
B) 1.54
C) 2.23
D) 1.82
Unlock Deck
Unlock for access to all 32 flashcards in this deck.
Unlock Deck
k this deck
23
A seed company has a test plot in which it is testing the germination of a hybrid seed. They plant 50 rows of 40 seeds per row. After a two-week period, the researchers count how many seed per row have sprouted. They noted that least number of seeds to germinate was 33 and some rows had all 40 germinate. The germination data is given below in the table. The random variable x represents the number of seed in a row that germinated and P(x) represents the probability of selecting a row with that number of seed germinating. Determine the standard deviation of the number of seeds per row that germinated.
A) 6.07
B) 1.51
C) 7.13
D) 36.86
A) 6.07
B) 1.51
C) 7.13
D) 36.86
Unlock Deck
Unlock for access to all 32 flashcards in this deck.
Unlock Deck
k this deck
24
If p is the probability of success of a binomial experiment, then the probability of failure is
A)
B)
C) -p
D) 1 - p
A)
B)
C) -p
D) 1 - p
Unlock Deck
Unlock for access to all 32 flashcards in this deck.
Unlock Deck
k this deck
25
The probability that an individual has 20-20 vision is 0.12. In a class of 43 students, what is the probability of finding five people with 20-20 vision?
A) 0.116
B) 0.12
C) 0.000
D) 0.186
A) 0.116
B) 0.12
C) 0.000
D) 0.186
Unlock Deck
Unlock for access to all 32 flashcards in this deck.
Unlock Deck
k this deck
26
According to the Federal Communications Commission, 70% of all U.S. households have vcrs. In a random sample of 15 households, what is the probability that fewer than 13 have vcrs?
A) 0.1268
B) 0.7
C) 0.8732
D) 0.5
A) 0.1268
B) 0.7
C) 0.8732
D) 0.5
Unlock Deck
Unlock for access to all 32 flashcards in this deck.
Unlock Deck
k this deck
27
A psychic network received telephone calls last year from over 1.5 million people. A recent article attempts to shed some light onto the credibility of the psychic network. One of the psychic network's psychics agreed to take part in the following experiment. Five different cards are shuffled, and one is chosen at random. The psychic will then try to identify which card was drawn without seeing it. Assume that the experiment was repeated 45 times and that the results of any two experiments are independent of one another. If we assume that the psychic is a fake (i.e., they are merely guessing at the cards and have no psychic powers), find the probability that they guess at least three correctly.
A) 0.003141
B) 0.009657
C) 0.996771
D) 0.002695
A) 0.003141
B) 0.009657
C) 0.996771
D) 0.002695
Unlock Deck
Unlock for access to all 32 flashcards in this deck.
Unlock Deck
k this deck
28
A recent article in the paper claims that government ethics are at an all-time low. Reporting on a recent sample, the paper claims that 32% of all constituents believe their representative possesses low ethical standards. Assume that responses were randomly and independently collected. A representative of a district with 1,000 people does not believe the paper's claim applies to her. If the claim is true, how many of the representative's constituents believe the representative possesses low ethical standards?
A) 32
B) 968
C) 680
D) 320
A) 32
B) 968
C) 680
D) 320
Unlock Deck
Unlock for access to all 32 flashcards in this deck.
Unlock Deck
k this deck
29
A recent article in the paper claims that government ethics are at an all-time low. Reporting on a recent sample, the paper claims that 31% of all constituents believe their representative possesses low ethical standards. Suppose 20 of a representative's constituents are randomly and independently sampled. Assuming the paper's claim is correct, find the probability that more than eight but fewer than 12 of the 20 constituents sampled believe their representative possesses low ethical standards.
A) 0.257174
B) 0.176107
C) 0.090085
D) 0.127128
A) 0.257174
B) 0.176107
C) 0.090085
D) 0.127128
Unlock Deck
Unlock for access to all 32 flashcards in this deck.
Unlock Deck
k this deck
30
A psychic network received telephone calls last year from over 1.5 million people. A recent article attempts to shed some light onto the credibility of the psychic network. One of the psychic network's psychics agreed to take part in the following experiment. Five different cards are shuffled, and one is chosen at random. The psychic will then try to identify which card was drawn without seeing it. Assume that the experiment was repeated 50 times and that the results of any two experiments are independent of one another. If we assume that the psychic is a fake (i.e., they are merely guessing at the cards and have no psychic powers), how many of the 50 cards do we expect the psychic to guess correctly?
A) 5
B) 9
C) 0
D) 10
A) 5
B) 9
C) 0
D) 10
Unlock Deck
Unlock for access to all 32 flashcards in this deck.
Unlock Deck
k this deck
31
Suppose the number of babies born during an 8-hour shift at a hospital's maternity wing follows a Poisson distribution with a mean of 3 an hour. Some people believe that the presence of a full moon increases the number of births that take place. Suppose during the presence of a full moon, County Hospital experienced eight consecutive hours with more than four births. Based on this fact, comment on the belief that the full moon increases the number of births.
A) The belief is not supported as the probability of observing this many births is 0.00000137.
B) The belief is not supported as the probability of observing this many births is 0.185.
C) The belief is supported as the probability of observing this many births would be 0.00000137.
D) The belief is supported as the probability of observing this many births would be 0.185.
Unlock Deck
Unlock for access to all 32 flashcards in this deck.
Unlock Deck
k this deck
32
Suppose x is a random variable for which a Poisson probability distribution with provides a good characterization. Find ? for x.
A) 10.4
B) 108.16
C) 3.22
D) 5.2
provides a good characterization. Find ? for x.A) 10.4
B) 108.16
C) 3.22
D) 5.2
Unlock Deck
Unlock for access to all 32 flashcards in this deck.
Unlock Deck
k this deck
Unlock Deck
Unlock for access to all 32 flashcards in this deck.


