Deck 10: Analysis of Quantitative Data
Full screen (f)
Question
Question
Question
Question
Question
Question
Question
Question
Question
Question
Ten college students, five males and five females, took a test on geography knowledge with 20 questions. The number correct is listed below.
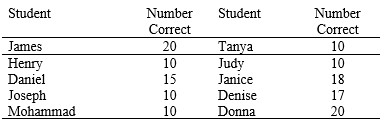 Which of the following is TRUE, if any?
A) Males had a higher mean score than females.
B) Both males and females had the same median score.
C) Females had a higher mode than males.
D) One male student got the same number right as the mean score for the females.
E) All are false.
Which of the following is TRUE, if any?A) Males had a higher mean score than females.
B) Both males and females had the same median score.
C) Females had a higher mode than males.
D) One male student got the same number right as the mean score for the females.
E) All are false.
Question
Refer to the information provided in Table 10.3 below to answer the questions that follow.
Table 10.3:
Annual Family Income and Education*
Statistics for Three Neighborhoods
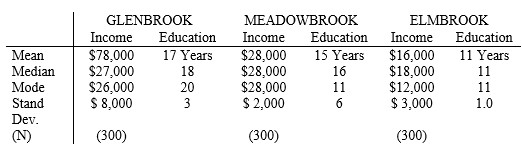
* 4 yrs college = 16 yrs; masters/law degrees = 18 yrs; PhD/MD degrees = 20 yrs.
-Which neighborhood(s) has a skewed income distribution?
A) Glenbrook
B) Meadowbrook
C) Elmbrook
D) A and C
E) B and C
Table 10.3:
Annual Family Income and Education*
Statistics for Three Neighborhoods
* 4 yrs college = 16 yrs; masters/law degrees = 18 yrs; PhD/MD degrees = 20 yrs.
-Which neighborhood(s) has a skewed income distribution?
A) Glenbrook
B) Meadowbrook
C) Elmbrook
D) A and C
E) B and C
Question
Given the following means and standard deviations for monthly crime rates in four cities, which is the safest in which to live?
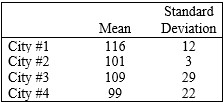
A) City #1
B) City #2
C) City #3
D) City #4
E) all the same
A) City #1
B) City #2
C) City #3
D) City #4
E) all the same
Question
Question
Question
Question
Use the information in this table to answer the following questions.
Campus by College Major for Four Campuses, 2006
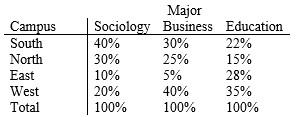
-Identify what you can be certain is a TRUE statement about the information in the table above on campus and major.
A) Among West students, more students major in education than in sociology.
B) Of sociology majors on the four campuses, a higher percent attend South than the other campuses.
C) 30% of all South students are business majors.
D) One in four of all business majors on the four campuses attend West.
E) Twice as many students at East major in sociology than in business.
Campus by College Major for Four Campuses, 2006
-Identify what you can be certain is a TRUE statement about the information in the table above on campus and major.
A) Among West students, more students major in education than in sociology.
B) Of sociology majors on the four campuses, a higher percent attend South than the other campuses.
C) 30% of all South students are business majors.
D) One in four of all business majors on the four campuses attend West.
E) Twice as many students at East major in sociology than in business.
Question
Refer to the following paragraph to answer the questions below.
Researchers debate the degree to which racism is a major source of white anti-immigrant attitudes in the United States, since most recent immigrants are non-white. To examine this relationship, I used a measure of racial prejudice among whites not wanting a black person to marry a close relative and cross-tabulated it with an opinion question about immigration using data from the 2000 General Social Survey. The variables are percentaged both by row and by column. MARRY BLACK: How would you respond to a close relative marrying a black person? Strongly Favor, Favor, Neither Favor or Oppose, Oppose, Strongly Oppose. IMMIGRANTS: Should the number of people coming from other countries to the U.S. as immigrants be Increased, Stay the Same, or Decrease? Data only for Race = White, GSS 2000. Note: Missing data, Don't Know, No Answer removed from Table. Immigrant response collapsed into three categories. Increase At lot and Increase a Little combined into Increase, Same, Decrease a Little and Decrease a Lot are combined into Decrease.
Column Percentage
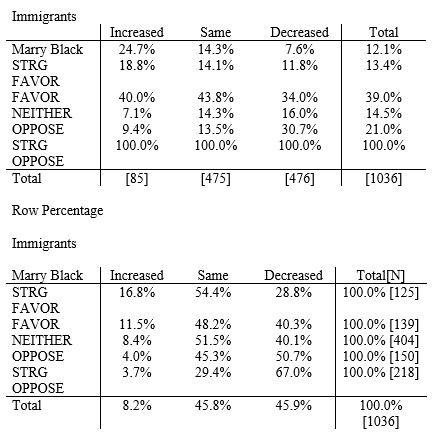
-Looking at the data from the above two tables, what percentage of whites who strongly accept the idea of a close relative marrying a black person also support increased immigration into the United States?
A) 3.7%
B) 9.4%
C) 16.8%
D) 24.7%
E) 28.8%
Researchers debate the degree to which racism is a major source of white anti-immigrant attitudes in the United States, since most recent immigrants are non-white. To examine this relationship, I used a measure of racial prejudice among whites not wanting a black person to marry a close relative and cross-tabulated it with an opinion question about immigration using data from the 2000 General Social Survey. The variables are percentaged both by row and by column. MARRY BLACK: How would you respond to a close relative marrying a black person? Strongly Favor, Favor, Neither Favor or Oppose, Oppose, Strongly Oppose. IMMIGRANTS: Should the number of people coming from other countries to the U.S. as immigrants be Increased, Stay the Same, or Decrease? Data only for Race = White, GSS 2000. Note: Missing data, Don't Know, No Answer removed from Table. Immigrant response collapsed into three categories. Increase At lot and Increase a Little combined into Increase, Same, Decrease a Little and Decrease a Lot are combined into Decrease.
Column Percentage
-Looking at the data from the above two tables, what percentage of whites who strongly accept the idea of a close relative marrying a black person also support increased immigration into the United States?
A) 3.7%
B) 9.4%
C) 16.8%
D) 24.7%
E) 28.8%
Question
Refer to the following paragraph to answer the questions below.
Researchers debate the degree to which racism is a major source of white anti-immigrant attitudes in the United States, since most recent immigrants are non-white. To examine this relationship, I used a measure of racial prejudice among whites not wanting a black person to marry a close relative and cross-tabulated it with an opinion question about immigration using data from the 2000 General Social Survey. The variables are percentaged both by row and by column. MARRY BLACK: How would you respond to a close relative marrying a black person? Strongly Favor, Favor, Neither Favor or Oppose, Oppose, Strongly Oppose. IMMIGRANTS: Should the number of people coming from other countries to the U.S. as immigrants be Increased, Stay the Same, or Decrease? Data only for Race = White, GSS 2000. Note: Missing data, Don't Know, No Answer removed from Table. Immigrant response collapsed into three categories. Increase At lot and Increase a Little combined into Increase, Same, Decrease a Little and Decrease a Lot are combined into Decrease.
Column Percentage
-Looking at data from the above two tables, which of the following is FALSE?
A) Over one in four whites favor or strongly favor having a relative marry a black person.
B) Among whites, a positive relationship exists between opposing immigration and not wanting a black person to marry into one's family.
C) About 35 percent of whites oppose or strongly oppose having a black person marry into their family.
D) More than 40 percent of whites favor keeping immigration rates the same, except for those whites who strongly oppose having a black person marry into their family.
E) Among whites who neither support nor oppose a black person marrying a close relative, 40 percent would like to see immigration increased.
Question
Question
Question
Question
Refer to the following paragraph to answer the question below.
With slight modification, the following tables appeared in Cernlo, Karen. 1993 "Symbols and the World System: National Anthems and Flags," Sociological Forum 8:243-71. The tables represent critical empirical evidence in the study. Dr. Cernlo studied how types of nations in the world system relate to the type of flag they have. She divided nations into two categories according to world system theory (core/non-core) and three categories according to modernization theory (pre-modern, modernizing, postmodern). She divided flag design, her dependent variable, into a basic or embellished graphic syntax.
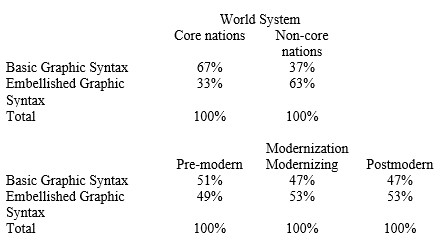
-Which of the following conclusions is correct? (Note that one of these statements is a close paraphrase directly taken from her article, the others are alternative, opposing hypotheses she was testing.)
A) A nation's position in the world economy, according to world system theory, and its level of modernization, according to modernization theory, are equally strong at predicting a nation's flag design.
B) Neither nation's position in the world economy, according to world system theory, nor its level of modernization, according to modernization theory, have any impact on a nation's flag design.
C) A nation's position in the world economy, according to world system theory, is stronger at distinguishing a nation's flag design than its level of modernization, according to modernization theory.
D) A nation's level of modernization, according to modernization theory, is stronger at distinguishing a nation's flag design than its position in the world economy, according to world system theory.
With slight modification, the following tables appeared in Cernlo, Karen. 1993 "Symbols and the World System: National Anthems and Flags," Sociological Forum 8:243-71. The tables represent critical empirical evidence in the study. Dr. Cernlo studied how types of nations in the world system relate to the type of flag they have. She divided nations into two categories according to world system theory (core/non-core) and three categories according to modernization theory (pre-modern, modernizing, postmodern). She divided flag design, her dependent variable, into a basic or embellished graphic syntax.
-Which of the following conclusions is correct? (Note that one of these statements is a close paraphrase directly taken from her article, the others are alternative, opposing hypotheses she was testing.)
A) A nation's position in the world economy, according to world system theory, and its level of modernization, according to modernization theory, are equally strong at predicting a nation's flag design.
B) Neither nation's position in the world economy, according to world system theory, nor its level of modernization, according to modernization theory, have any impact on a nation's flag design.
C) A nation's position in the world economy, according to world system theory, is stronger at distinguishing a nation's flag design than its level of modernization, according to modernization theory.
D) A nation's level of modernization, according to modernization theory, is stronger at distinguishing a nation's flag design than its position in the world economy, according to world system theory.
Question
Question
Question
Question
Question
Question
Question
Question
Question
Question
Question
Question
Question
Question
Question
Question
Question
Question
Question
Question
Question
Question
Question
Question
Question
Question
Question
Question
Question
Question
Question
Question
Question
Question
Question
Question
Question
Question

Unlock Deck
Sign up to unlock the cards in this deck!
Unlock Deck
Unlock Deck
1/60
Play
Full screen (f)
Deck 10: Analysis of Quantitative Data
1
Explain how a researcher uses a codebook in quantitative research and two ways to "clean"
the quantitative data prior to analysis.
the quantitative data prior to analysis.
A researcher uses a codebook in quantitative research to organize and categorize the data collected from surveys, experiments, or other sources. The codebook serves as a guide for the researcher to understand the variables and their corresponding codes, as well as any specific instructions for data entry and analysis. It helps ensure consistency in data coding and analysis, and allows for easy reference and replication of the study.
Two ways to "clean" quantitative data prior to analysis include:
1. Data validation: This involves checking for errors, inconsistencies, and missing values in the dataset. Researchers can use software programs or coding techniques to identify and correct any discrepancies in the data. This may include removing outliers, correcting data entry errors, and imputing missing values.
2. Standardization: Standardizing the data involves transforming variables to a common scale or format. This can include converting units of measurement, normalizing distributions, or creating composite scores. Standardization helps make the data more comparable and easier to analyze, especially when dealing with multiple variables or datasets.
Overall, using a codebook and cleaning the quantitative data are essential steps in ensuring the accuracy and reliability of the research findings. These processes help researchers organize and prepare their data for analysis, ultimately leading to more valid and meaningful results.
2
Describe three ways a researcher can display information on one variable.
1. Histogram: A researcher can display information on one variable using a histogram, which is a graphical representation of the distribution of data. The histogram consists of a series of bars, where the height of each bar represents the frequency or proportion of data points within a specific range. This allows the researcher to visualize the distribution and identify patterns or outliers within the data.
2. Box plot: Another way to display information on one variable is through a box plot, also known as a box-and-whisker plot. This graphical representation provides a visual summary of the distribution of the data, including the median, quartiles, and potential outliers. The box plot allows the researcher to compare the distribution of the variable across different groups or categories, making it a useful tool for data analysis and visualization.
3. Frequency table: A researcher can also display information on one variable using a frequency table, which presents the number of times each value or category occurs within the data set. This tabular format allows the researcher to easily identify the most common values, as well as any patterns or trends within the data. Additionally, a frequency table can be used to calculate proportions or percentages, providing a comprehensive overview of the variable's distribution.
3
What are the differences between the mean , median , and mode ? How are they affected by a normal versus a skewed distribution of data?
The mean, median, and mode are all measures of central tendency in a set of data.
The mean is the average of all the values in the data set. It is calculated by adding up all the values and then dividing by the total number of values. The mean is affected by extreme values, as it can be heavily influenced by outliers.
The median is the middle value in a data set when the values are arranged in ascending order. If there is an even number of values, the median is the average of the two middle values. The median is not affected by extreme values, making it a more robust measure of central tendency compared to the mean.
The mode is the value that appears most frequently in a data set. A data set can have one mode, more than one mode, or no mode at all. The mode is not affected by extreme values, but it may not be a good representation of the central tendency if the data is spread out.
In a normal distribution of data, the mean, median, and mode are all equal. This is because a normal distribution is symmetric around the mean, so the middle value (median) and the most frequent value (mode) are the same as the average (mean).
In a skewed distribution, the mean, median, and mode can be different. In a positively skewed distribution (tail to the right), the mean is greater than the median, which is greater than the mode. In a negatively skewed distribution (tail to the left), the mean is less than the median, which is less than the mode. This is because the extreme values in the tail of the distribution pull the mean in their direction, while the median and mode are less affected by these extreme values.
4
Why is knowing the variability or dispersion of a variable as important as knowing its central tendency?
Unlock Deck
Unlock for access to all 60 flashcards in this deck.
Unlock Deck
k this deck
5
What features of a bivariate relationship can be seen from a scattergram?
Unlock Deck
Unlock for access to all 60 flashcards in this deck.
Unlock Deck
k this deck
6
What must be true before a researcher can generalize from a scattergram to a percentaged table when looking for a relationship among variables?
Unlock Deck
Unlock for access to all 60 flashcards in this deck.
Unlock Deck
k this deck
7
Discuss the concept of control as it is used in trivariate analysis. In what ways it is similar to or different from control in experiments?
Unlock Deck
Unlock for access to all 60 flashcards in this deck.
Unlock Deck
k this deck
8
Someone says, "It is statistically significant at the .10 level."
What does it mean? Is a Type I or a Type II error more likely if a .05 level had been used? Explain.
What does it mean? Is a Type I or a Type II error more likely if a .05 level had been used? Explain.
Unlock Deck
Unlock for access to all 60 flashcards in this deck.
Unlock Deck
k this deck
9
Professor Doner asked you to interpret a correlation of -1.8. You say it indicates a(n)
A) exceedingly strong relationship.
B) moderate relationship.
C) weak relationship.
D) error in calculations.
E) none of the above
A) exceedingly strong relationship.
B) moderate relationship.
C) weak relationship.
D) error in calculations.
E) none of the above
Unlock Deck
Unlock for access to all 60 flashcards in this deck.
Unlock Deck
k this deck
10
Ten college students, five males and five females, took a test on geography knowledge with 20 questions. The number correct is listed below.
Which of the following is TRUE, if any?
A) Males had a higher mean score than females.
B) Both males and females had the same median score.
C) Females had a higher mode than males.
D) One male student got the same number right as the mean score for the females.
E) All are false.
Which of the following is TRUE, if any?A) Males had a higher mean score than females.
B) Both males and females had the same median score.
C) Females had a higher mode than males.
D) One male student got the same number right as the mean score for the females.
E) All are false.
Unlock Deck
Unlock for access to all 60 flashcards in this deck.
Unlock Deck
k this deck
11
Refer to the information provided in Table 10.3 below to answer the questions that follow.
Table 10.3:
Annual Family Income and Education*
Statistics for Three Neighborhoods
* 4 yrs college = 16 yrs; masters/law degrees = 18 yrs; PhD/MD degrees = 20 yrs.
-Which neighborhood(s) has a skewed income distribution?
A) Glenbrook
B) Meadowbrook
C) Elmbrook
D) A and C
E) B and C
Table 10.3:
Annual Family Income and Education*
Statistics for Three Neighborhoods
* 4 yrs college = 16 yrs; masters/law degrees = 18 yrs; PhD/MD degrees = 20 yrs.
-Which neighborhood(s) has a skewed income distribution?
A) Glenbrook
B) Meadowbrook
C) Elmbrook
D) A and C
E) B and C
Unlock Deck
Unlock for access to all 60 flashcards in this deck.
Unlock Deck
k this deck
12
Given the following means and standard deviations for monthly crime rates in four cities, which is the safest in which to live?
A) City #1
B) City #2
C) City #3
D) City #4
E) all the same
A) City #1
B) City #2
C) City #3
D) City #4
E) all the same
Unlock Deck
Unlock for access to all 60 flashcards in this deck.
Unlock Deck
k this deck
13
Given the following 6 men's shoe sizes:
9, 10, 10, 8, 12, 11
-The MEAN is
A) 8
B) 8.5
C) 9
D) 9.5
E) 10
9, 10, 10, 8, 12, 11
-The MEAN is
A) 8
B) 8.5
C) 9
D) 9.5
E) 10
Unlock Deck
Unlock for access to all 60 flashcards in this deck.
Unlock Deck
k this deck
14
Given the following 6 men's shoe sizes:
9, 10, 10, 8, 12, 11
-The MEDIAN is
A) 8
B) 8.5
C) 9
D) 9.5
E) 10
9, 10, 10, 8, 12, 11
-The MEDIAN is
A) 8
B) 8.5
C) 9
D) 9.5
E) 10
Unlock Deck
Unlock for access to all 60 flashcards in this deck.
Unlock Deck
k this deck
15
Given the following 6 men's shoe sizes:
9, 10, 10, 8, 12, 11
-The MODE is
A) 8
B) 8.5
C) 9
D) 9.5
E) 10
9, 10, 10, 8, 12, 11
-The MODE is
A) 8
B) 8.5
C) 9
D) 9.5
E) 10
Unlock Deck
Unlock for access to all 60 flashcards in this deck.
Unlock Deck
k this deck
16
Use the information in this table to answer the following questions.
Campus by College Major for Four Campuses, 2006
-Identify what you can be certain is a TRUE statement about the information in the table above on campus and major.
A) Among West students, more students major in education than in sociology.
B) Of sociology majors on the four campuses, a higher percent attend South than the other campuses.
C) 30% of all South students are business majors.
D) One in four of all business majors on the four campuses attend West.
E) Twice as many students at East major in sociology than in business.
Unlock Deck
Unlock for access to all 60 flashcards in this deck.
Unlock Deck
k this deck
17
Refer to the following paragraph to answer the questions below.
Researchers debate the degree to which racism is a major source of white anti-immigrant attitudes in the United States, since most recent immigrants are non-white. To examine this relationship, I used a measure of racial prejudice among whites not wanting a black person to marry a close relative and cross-tabulated it with an opinion question about immigration using data from the 2000 General Social Survey. The variables are percentaged both by row and by column. MARRY BLACK: How would you respond to a close relative marrying a black person? Strongly Favor, Favor, Neither Favor or Oppose, Oppose, Strongly Oppose. IMMIGRANTS: Should the number of people coming from other countries to the U.S. as immigrants be Increased, Stay the Same, or Decrease? Data only for Race = White, GSS 2000. Note: Missing data, Don't Know, No Answer removed from Table. Immigrant response collapsed into three categories. Increase At lot and Increase a Little combined into Increase, Same, Decrease a Little and Decrease a Lot are combined into Decrease.
Column Percentage
-Looking at the data from the above two tables, what percentage of whites who strongly accept the idea of a close relative marrying a black person also support increased immigration into the United States?
A) 3.7%
B) 9.4%
C) 16.8%
D) 24.7%
E) 28.8%
Unlock Deck
Unlock for access to all 60 flashcards in this deck.
Unlock Deck
k this deck
18
Refer to the following paragraph to answer the questions below.
Researchers debate the degree to which racism is a major source of white anti-immigrant attitudes in the United States, since most recent immigrants are non-white. To examine this relationship, I used a measure of racial prejudice among whites not wanting a black person to marry a close relative and cross-tabulated it with an opinion question about immigration using data from the 2000 General Social Survey. The variables are percentaged both by row and by column. MARRY BLACK: How would you respond to a close relative marrying a black person? Strongly Favor, Favor, Neither Favor or Oppose, Oppose, Strongly Oppose. IMMIGRANTS: Should the number of people coming from other countries to the U.S. as immigrants be Increased, Stay the Same, or Decrease? Data only for Race = White, GSS 2000. Note: Missing data, Don't Know, No Answer removed from Table. Immigrant response collapsed into three categories. Increase At lot and Increase a Little combined into Increase, Same, Decrease a Little and Decrease a Lot are combined into Decrease.
Column Percentage
-Looking at data from the above two tables, which of the following is FALSE?
A) Over one in four whites favor or strongly favor having a relative marry a black person.
B) Among whites, a positive relationship exists between opposing immigration and not wanting a black person to marry into one's family.
C) About 35 percent of whites oppose or strongly oppose having a black person marry into their family.
D) More than 40 percent of whites favor keeping immigration rates the same, except for those whites who strongly oppose having a black person marry into their family.
E) Among whites who neither support nor oppose a black person marrying a close relative, 40 percent would like to see immigration increased.
Unlock Deck
Unlock for access to all 60 flashcards in this deck.
Unlock Deck
k this deck
19
Professor Hogshead found a statistically significant relationship between variable X and variable Y. It is statistically significant at the .05 level. What does this mean?
A) There are 95 chances in 100 that the results are true.
B) There is a 5% chance that the results are true.
C) If 100 samples were drawn, results like these could be obtained by pure random chance 10% of the time.
D) A person could be 95% sure that the results of the study were a reflection of the population if random sampling was used.
E) A and D.
Unlock Deck
Unlock for access to all 60 flashcards in this deck.
Unlock Deck
k this deck
20
Refer to the following paragraph to answer the questions below.
The infant mortality rate (number of infants who die in their first year per 1,000 births) has a mean for the OECD (most advanced industrial countries) of 8 with a standard deviation of 1.
-The infant mortality rate in the U.S. is 9 infant deaths per 1,000 births. The rate for Ireland, Singapore, Hong Kong, Netherlands, France, Canada, Germany, and Switzerland are all the same. Their rate is 2 z-scores below that of the U.S. What is their rate?
A) 6
B) 6.5
C) 7
D) 7.5
E) 8
Unlock Deck
Unlock for access to all 60 flashcards in this deck.
Unlock Deck
k this deck
21
Refer to the following paragraph to answer the questions below.
The infant mortality rate (number of infants who die in their first year per 1,000 births) has a mean for the OECD (most advanced industrial countries) of 8 with a standard deviation of 1.
-Japan has a rate of 5 infant deaths per 1,000 births. What is its z-score among the OECD nations?
A) -.5
B) -1
C) -2
D) -3
E) -4
Unlock Deck
Unlock for access to all 60 flashcards in this deck.
Unlock Deck
k this deck
22
Refer to the following paragraph to answer the question below.
With slight modification, the following tables appeared in Cernlo, Karen. 1993 "Symbols and the World System: National Anthems and Flags," Sociological Forum 8:243-71. The tables represent critical empirical evidence in the study. Dr. Cernlo studied how types of nations in the world system relate to the type of flag they have. She divided nations into two categories according to world system theory (core/non-core) and three categories according to modernization theory (pre-modern, modernizing, postmodern). She divided flag design, her dependent variable, into a basic or embellished graphic syntax.
-Which of the following conclusions is correct? (Note that one of these statements is a close paraphrase directly taken from her article, the others are alternative, opposing hypotheses she was testing.)
A) A nation's position in the world economy, according to world system theory, and its level of modernization, according to modernization theory, are equally strong at predicting a nation's flag design.
B) Neither nation's position in the world economy, according to world system theory, nor its level of modernization, according to modernization theory, have any impact on a nation's flag design.
C) A nation's position in the world economy, according to world system theory, is stronger at distinguishing a nation's flag design than its level of modernization, according to modernization theory.
D) A nation's level of modernization, according to modernization theory, is stronger at distinguishing a nation's flag design than its position in the world economy, according to world system theory.
Unlock Deck
Unlock for access to all 60 flashcards in this deck.
Unlock Deck
k this deck
23
Talk about:
-bar chart
-bar chart
Unlock Deck
Unlock for access to all 60 flashcards in this deck.
Unlock Deck
k this deck
24
Talk about:
-bivariate statistics
-bivariate statistics
Unlock Deck
Unlock for access to all 60 flashcards in this deck.
Unlock Deck
k this deck
25
Talk about:
-code sheets
-code sheets
Unlock Deck
Unlock for access to all 60 flashcards in this deck.
Unlock Deck
k this deck
26
Talk about:
-codebook
-codebook
Unlock Deck
Unlock for access to all 60 flashcards in this deck.
Unlock Deck
k this deck
27
Talk about:
-contingency cleaning
-contingency cleaning
Unlock Deck
Unlock for access to all 60 flashcards in this deck.
Unlock Deck
k this deck
28
Talk about:
-contingency table
-contingency table
Unlock Deck
Unlock for access to all 60 flashcards in this deck.
Unlock Deck
k this deck
29
Talk about:
-control variable
-control variable
Unlock Deck
Unlock for access to all 60 flashcards in this deck.
Unlock Deck
k this deck
30
Talk about:
-covariation
-covariation
Unlock Deck
Unlock for access to all 60 flashcards in this deck.
Unlock Deck
k this deck
31
Talk about:
-cross-tabulation
-cross-tabulation
Unlock Deck
Unlock for access to all 60 flashcards in this deck.
Unlock Deck
k this deck
32
Talk about:
-curvilinear relationship
-curvilinear relationship
Unlock Deck
Unlock for access to all 60 flashcards in this deck.
Unlock Deck
k this deck
33
Talk about:
-descriptive statistics
-descriptive statistics
Unlock Deck
Unlock for access to all 60 flashcards in this deck.
Unlock Deck
k this deck
34
Talk about:
-elaboration paradigm
-elaboration paradigm
Unlock Deck
Unlock for access to all 60 flashcards in this deck.
Unlock Deck
k this deck
35
Talk about:
-explanation pattern
-explanation pattern
Unlock Deck
Unlock for access to all 60 flashcards in this deck.
Unlock Deck
k this deck
36
Talk about:
-frequency distribution
-frequency distribution
Unlock Deck
Unlock for access to all 60 flashcards in this deck.
Unlock Deck
k this deck
37
Talk about:
-frequency polygon
-frequency polygon
Unlock Deck
Unlock for access to all 60 flashcards in this deck.
Unlock Deck
k this deck
38
Talk about:
-independence
-independence
Unlock Deck
Unlock for access to all 60 flashcards in this deck.
Unlock Deck
k this deck
39
Talk about:
-interpretation pattern
-interpretation pattern
Unlock Deck
Unlock for access to all 60 flashcards in this deck.
Unlock Deck
k this deck
40
Talk about:
-linear relationship
-linear relationship
Unlock Deck
Unlock for access to all 60 flashcards in this deck.
Unlock Deck
k this deck
41
Talk about:
-marginals
-marginals
Unlock Deck
Unlock for access to all 60 flashcards in this deck.
Unlock Deck
k this deck
42
Talk about:
-mean
-mean
Unlock Deck
Unlock for access to all 60 flashcards in this deck.
Unlock Deck
k this deck
43
Talk about:
-median
-median
Unlock Deck
Unlock for access to all 60 flashcards in this deck.
Unlock Deck
k this deck
44
Talk about:
-mode
-mode
Unlock Deck
Unlock for access to all 60 flashcards in this deck.
Unlock Deck
k this deck
45
Talk about:
-normal distribution
-normal distribution
Unlock Deck
Unlock for access to all 60 flashcards in this deck.
Unlock Deck
k this deck
46
Talk about:
-partials
-partials
Unlock Deck
Unlock for access to all 60 flashcards in this deck.
Unlock Deck
k this deck
47
Talk about:
-percentile
-percentile
Unlock Deck
Unlock for access to all 60 flashcards in this deck.
Unlock Deck
k this deck
48
Talk about:
-pie chart
-pie chart
Unlock Deck
Unlock for access to all 60 flashcards in this deck.
Unlock Deck
k this deck
49
Talk about:
-range
-range
Unlock Deck
Unlock for access to all 60 flashcards in this deck.
Unlock Deck
k this deck
50
Talk about:
-replication pattern
-replication pattern
Unlock Deck
Unlock for access to all 60 flashcards in this deck.
Unlock Deck
k this deck
51
Talk about:
-scattergram
-scattergram
Unlock Deck
Unlock for access to all 60 flashcards in this deck.
Unlock Deck
k this deck
52
Talk about:
-skewed distribution
-skewed distribution
Unlock Deck
Unlock for access to all 60 flashcards in this deck.
Unlock Deck
k this deck
53
Talk about:
-specification pattern
-specification pattern
Unlock Deck
Unlock for access to all 60 flashcards in this deck.
Unlock Deck
k this deck
54
Talk about:
-standard deviation
-standard deviation
Unlock Deck
Unlock for access to all 60 flashcards in this deck.
Unlock Deck
k this deck
55
Talk about:
-statistical significance
-statistical significance
Unlock Deck
Unlock for access to all 60 flashcards in this deck.
Unlock Deck
k this deck
56
Talk about:
-suppressor variable pattern
-suppressor variable pattern
Unlock Deck
Unlock for access to all 60 flashcards in this deck.
Unlock Deck
k this deck
57
Talk about:
-Type I error
-Type I error
Unlock Deck
Unlock for access to all 60 flashcards in this deck.
Unlock Deck
k this deck
58
Talk about:
-Type II error
-Type II error
Unlock Deck
Unlock for access to all 60 flashcards in this deck.
Unlock Deck
k this deck
59
Talk about:
-univariate statistics
-univariate statistics
Unlock Deck
Unlock for access to all 60 flashcards in this deck.
Unlock Deck
k this deck
60
Talk about:
-z-score
-z-score
Unlock Deck
Unlock for access to all 60 flashcards in this deck.
Unlock Deck
k this deck
Unlock Deck
Unlock for access to all 60 flashcards in this deck.


