Exam 10: Analysis of Quantitative Data
Exam 1: Doing Social Research26 Questions
Exam 2: Theory and Social Research35 Questions
Exam 3: Ethics in Social Research21 Questions
Exam 4: Reviewing the Scholarly Literature and Planning a Study31 Questions
Exam 5: Qualitative and Quantitative Measurement43 Questions
Exam 6: Qualitative and Quantitative Sampling45 Questions
Exam 7: Survey Research32 Questions
Exam 8: Experimental Research53 Questions
Exam 9: Nonreactive Research and Secondary Analysis23 Questions
Exam 10: Analysis of Quantitative Data60 Questions
Exam 11: Field Research and Focus Group Research33 Questions
Exam 12: Historical-Comparative Research23 Questions
Exam 13: Analysis of Qualitative Data14 Questions
Exam 14: Writing the Research Report15 Questions
Select questions type
Talk about:
-percentile
Free
(Essay)
4.7/5  (43)
(43)
Correct Answer: Verified
A measure of dispersion for one variable that indicates the percentage of cases that are at or below a specific point or score.
Talk about:
-frequency distribution
Free
(Essay)
4.9/5 (43)
Correct Answer:Verified
A table that shows the distribution of cases into the categories of one variable (i.e., the number or percentage of cases in each category).
Refer to the following paragraph to answer the questions below.
Researchers debate the degree to which racism is a major source of white anti-immigrant attitudes in the United States, since most recent immigrants are non-white. To examine this relationship, I used a measure of racial prejudice among whites not wanting a black person to marry a close relative and cross-tabulated it with an opinion question about immigration using data from the 2000 General Social Survey. The variables are percentaged both by row and by column. MARRY BLACK: How would you respond to a close relative marrying a black person? Strongly Favor, Favor, Neither Favor or Oppose, Oppose, Strongly Oppose. IMMIGRANTS: Should the number of people coming from other countries to the U.S. as immigrants be Increased, Stay the Same, or Decrease? Data only for Race = White, GSS 2000. Note: Missing data, Don't Know, No Answer removed from Table. Immigrant response collapsed into three categories. Increase At lot and Increase a Little combined into Increase, Same, Decrease a Little and Decrease a Lot are combined into Decrease.
Column Percentage
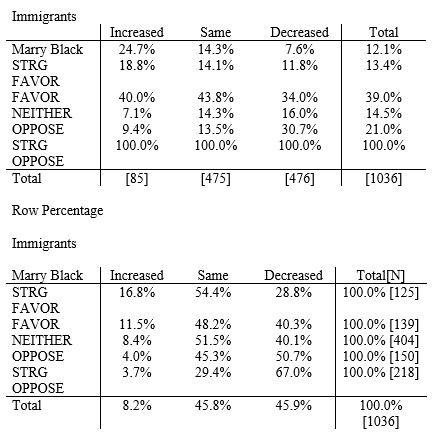 -Looking at data from the above two tables, which of the following is FALSE?
Free
(Multiple Choice)
4.8/5 (44)
Correct Answer:Verified
E
Someone says, "It is statistically significant at the .10 level."
What does it mean? Is a Type I or a Type II error more likely if a .05 level had been used? Explain.
(Essay)
4.8/5 (32)
Discuss the concept of control as it is used in trivariate analysis. In what ways it is similar to or different from control in experiments?
(Essay)
4.9/5 (37)
Refer to the following paragraph to answer the question below.
With slight modification, the following tables appeared in Cernlo, Karen. 1993 "Symbols and the World System: National Anthems and Flags," Sociological Forum 8:243-71. The tables represent critical empirical evidence in the study. Dr. Cernlo studied how types of nations in the world system relate to the type of flag they have. She divided nations into two categories according to world system theory (core/non-core) and three categories according to modernization theory (pre-modern, modernizing, postmodern). She divided flag design, her dependent variable, into a basic or embellished graphic syntax.
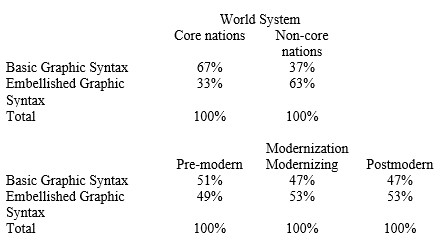 -Which of the following conclusions is correct? (Note that one of these statements is a close paraphrase directly taken from her article, the others are alternative, opposing hypotheses she was testing.)
(Multiple Choice)
4.9/5 (43)
Refer to the following paragraph to answer the questions below.
The infant mortality rate (number of infants who die in their first year per 1,000 births) has a mean for the OECD (most advanced industrial countries) of 8 with a standard deviation of 1.
-The infant mortality rate in the U.S. is 9 infant deaths per 1,000 births. The rate for Ireland, Singapore, Hong Kong, Netherlands, France, Canada, Germany, and Switzerland are all the same. Their rate is 2 z-scores below that of the U.S. What is their rate?
(Multiple Choice)
4.8/5 (40)
Refer to the following paragraph to answer the questions below.
Researchers debate the degree to which racism is a major source of white anti-immigrant attitudes in the United States, since most recent immigrants are non-white. To examine this relationship, I used a measure of racial prejudice among whites not wanting a black person to marry a close relative and cross-tabulated it with an opinion question about immigration using data from the 2000 General Social Survey. The variables are percentaged both by row and by column. MARRY BLACK: How would you respond to a close relative marrying a black person? Strongly Favor, Favor, Neither Favor or Oppose, Oppose, Strongly Oppose. IMMIGRANTS: Should the number of people coming from other countries to the U.S. as immigrants be Increased, Stay the Same, or Decrease? Data only for Race = White, GSS 2000. Note: Missing data, Don't Know, No Answer removed from Table. Immigrant response collapsed into three categories. Increase At lot and Increase a Little combined into Increase, Same, Decrease a Little and Decrease a Lot are combined into Decrease.
Column Percentage
-Looking at the data from the above two tables, what percentage of whites who strongly accept the idea of a close relative marrying a black person also support increased immigration into the United States?
(Multiple Choice)
4.9/5 (38)
Filters
- Essay(0)
- Multiple Choice(0)
- Short Answer(0)
- True False(0)
- Matching(0)