Deck 5: Approximating With a Distribution
Full screen (f)
Question
Question
Question
Question
Question
Question
Question
Question
Question
Question
Question
Question
Question
Question
Question
Question
Question
Question
Question
Question
Question
Question
Question
Question
Question
Question
Question
Question
Question
Question
Question
Use the following to answer the questions below:
Use the provided density function to choose the best estimate for the proportion of the population found in the specified region.
-The percent of the population that is less than 20 is closest to
A) 5%
B) 25%
C) 75%
D) 95%
Use the provided density function to choose the best estimate for the proportion of the population found in the specified region.
-The percent of the population that is less than 20 is closest to
A) 5%
B) 25%
C) 75%
D) 95%
Question
Use the following to answer the questions below:
Use the provided density function to choose the best estimate for the proportion of the population found in the specified region.
-The percent of the population that is less than 40 is closest to
A) 15%
B) 35%
C) 75%
D) 95%
Use the provided density function to choose the best estimate for the proportion of the population found in the specified region.
-The percent of the population that is less than 40 is closest to
A) 15%
B) 35%
C) 75%
D) 95%
Question
Use the following to answer the questions below:
Use the provided density function to choose the best estimate for the proportion of the population found in the specified region.
-The percent of the population that is more than 100 is closest to
A) 75%
B) 20%
C) 10%
D) 2%
Use the provided density function to choose the best estimate for the proportion of the population found in the specified region.
-The percent of the population that is more than 100 is closest to
A) 75%
B) 20%
C) 10%
D) 2%
Question
Use the following to answer the questions below:
Use the provided density function to choose the best estimate for the proportion of the population found in the specified region.
-The percent of the population that is more than 50 is closest to
A) 25%
B) 75%
C) 50%
D) 90%
Use the provided density function to choose the best estimate for the proportion of the population found in the specified region.
-The percent of the population that is more than 50 is closest to
A) 25%
B) 75%
C) 50%
D) 90%
Question
Use the following to answer the questions below:
Use the provided density function to choose the best estimate for the proportion of the population found in the specified region.
-The percent of the population between 20 and 80 is closest to
A) 85%
B) 99%
C) 70%
D) 50%
Use the provided density function to choose the best estimate for the proportion of the population found in the specified region.
-The percent of the population between 20 and 80 is closest to
A) 85%
B) 99%
C) 70%
D) 50%
Question
Question
Question
Question
Question
Question
Question
Question
Question
Question
Question
Question
Question
Question
Question
Question
Question
Question
Question
Question
Question
Question
Question
Question
Use the following to answer the questions below:
A set of hypotheses, some information from one or more samples, and a standard error from a randomization distribution are provided. Find the value of the standardized z-test statistic.
-Test : p = 0.75 versus
  : p > 0.75 when the sample has
 and
and 
A) 0.03
B) 2
C) -2
D) 1.5
A set of hypotheses, some information from one or more samples, and a standard error from a randomization distribution are provided. Find the value of the standardized z-test statistic.
-Test
: p = 0.75 versus : p > 0.75 when the sample has and A) 0.03
B) 2
C) -2
D) 1.5
Question
Use the following to answer the questions below:
A set of hypotheses, some information from one or more samples, and a standard error from a randomization distribution are provided. Find the value of the standardized z-test statistic.
-Test : = 26 versus
  : 26 when the sample has n = 75,
  s = 5.4, and SE = 0.6.
A) -1.5
B) 0.278
C) 2.5
D) -0.833
A set of hypotheses, some information from one or more samples, and a standard error from a randomization distribution are provided. Find the value of the standardized z-test statistic.
-Test
: = 26 versus : 26 when the sample has n = 75, s = 5.4, and SE = 0.6.A) -1.5
B) 0.278
C) 2.5
D) -0.833
Question
Use the following to answer the questions below:
A set of hypotheses, some information from one or more samples, and a standard error from a randomization distribution are provided. Find the value of the standardized z-test statistic.
-Test :
:  =
=  and
and  :
: 
 when the samples have


 and
and  The standard error of
  from the randomization distribution is 3.2.
A) 1.875
B) 6
C) 0.4
D) 0.5
A set of hypotheses, some information from one or more samples, and a standard error from a randomization distribution are provided. Find the value of the standardized z-test statistic.
-Test
: = and : when the samples have and The standard error of from the randomization distribution is 3.2.A) 1.875
B) 6
C) 0.4
D) 0.5
Question
Use the following to answer the questions below:
Find the p-value based on a standard normal distribution for the standardized test statistic and provided alternative hypothesis.
-z = -1.86 for : p < 0.5
A) 0.031
B) 0.969
C) 0.062
D) 0.937
Find the p-value based on a standard normal distribution for the standardized test statistic and provided alternative hypothesis.
-z = -1.86 for
: p < 0.5A) 0.031
B) 0.969
C) 0.062
D) 0.937
Question
Use the following to answer the questions below:
Find the p-value based on a standard normal distribution for the standardized test statistic and provided alternative hypothesis.
-z = 2.36 for : > 86
A) 0.982
B) 0.0182
C) 0.991
D) 0.0091
Find the p-value based on a standard normal distribution for the standardized test statistic and provided alternative hypothesis.
-z = 2.36 for
: > 86A) 0.982
B) 0.0182
C) 0.991
D) 0.0091
Question
Use the following to answer the questions below:
Find the p-value based on a standard normal distribution for the standardized test statistic and provided alternative hypothesis.
-z = 1.75 for :
: 

A) 0.960
B) 0.040
C) 0.080
D) 0.920
Find the p-value based on a standard normal distribution for the standardized test statistic and provided alternative hypothesis.
-z = 1.75 for
: A) 0.960
B) 0.040
C) 0.080
D) 0.920
Question
Use the following to answer the questions below:
A Gallup survey of 1,012 randomly selected U.S. adults (age 18 and over), 53% said that they were dissatisfied with the quality of education students receive in kindergarten through grade 12. The bootstrap distribution (based on 5,000 samples) is provided.
?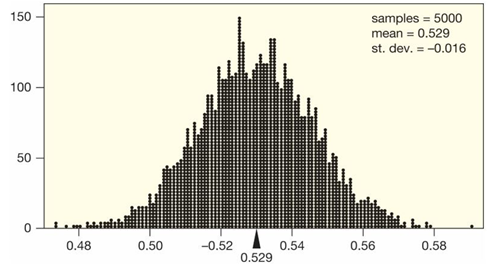
-Would it be appropriate to use the normal distribution to construct the confidence interval in this situation?
Question
Use the following to answer the questions below:
A Gallup survey of 1,012 randomly selected U.S. adults (age 18 and over), 53% said that they were dissatisfied with the quality of education students receive in kindergarten through grade 12. The bootstrap distribution (based on 5,000 samples) is provided.
-The standard error from the bootstrap distribution is SE = 0.016. Use the normal distribution to construct and interpret a 99% confidence interval for the proportion of U.S. adults who are dissatisfied with the education students receive in kindergarten through grade 12. Round to three decimal places.
Question
Use the following to answer the questions below:
A Gallup survey of 1,012 randomly selected U.S. adults (age 18 and over), 53% said that they were dissatisfied with the quality of education students receive in kindergarten through grade 12. The bootstrap distribution (based on 5,000 samples) is provided.
-A Gallup survey of 1,012 randomly selected U.S. adults (age 18 and over), 53% said that they were dissatisfied with the quality of education students receive in kindergarten through grade 12. Use the normal distribution to test if the proportion of U.S. adults who are dissatisfied with the education that students receive in kindergarten through grade 12 differs from 50%. The randomization distribution for this test is approximately normal and the standard error is Include all details of the test and use a 5% significance level.
A Gallup survey of 1,012 randomly selected U.S. adults (age 18 and over), 53% said that they were dissatisfied with the quality of education students receive in kindergarten through grade 12. The bootstrap distribution (based on 5,000 samples) is provided.
-A Gallup survey of 1,012 randomly selected U.S. adults (age 18 and over), 53% said that they were dissatisfied with the quality of education students receive in kindergarten through grade 12. Use the normal distribution to test if the proportion of U.S. adults who are dissatisfied with the education that students receive in kindergarten through grade 12 differs from 50%. The randomization distribution for this test is approximately normal and the standard error is
Include all details of the test and use a 5% significance level. Question
Use the following to answer the questions below:
A Gallup survey of 1,012 randomly selected U.S. adults (age 18 and over), 53% said that they were dissatisfied with the quality of education students receive in kindergarten through grade 12. The bootstrap distribution (based on 5,000 samples) is provided.
?
-A sample of 148 college students reports sleeping an average of 6.85 hours on weeknights. The sample size is large enough to use the normal distribution, and a bootstrap distribution shows that the standard error is
Use a normal distribution to construct and interpret a 95% confidence interval for the mean amount of weeknight sleep students get at this university. Use two decimal places in your answer.
A) 6.51 to 7.19 hours
B) 4.89 to 8.81 hours
C) 6.68 to 7.03 hours
D) 4.81 to 8.89 hours
Question
Use the following to answer the questions below:
A Gallup survey of 1,012 randomly selected U.S. adults (age 18 and over), 53% said that they were dissatisfied with the quality of education students receive in kindergarten through grade 12. The bootstrap distribution (based on 5,000 samples) is provided.
?
-Gallup conducted a survey of 1,015 randomly selected U.S. adults about "Black Friday"shopping. They asked the following question:
"As you know, the Friday after Thanksgiving is one of the biggest shopping days of the year.
Looking ahead, do you personally plan on shopping on the Friday after Thanksgiving, or not?"Of the 515 men who responded, 16% said "Yes."
Of the 500 women who responded, 20% said "Yes."
The standard error of the differences in proportions

is about

Use the normal distribution to test, at the 5% level, if the proportions of men and women who planned to shop on the Friday after Thanksgiving are significantly different. The sample size is large enough to use the normal distribution.
A Gallup survey of 1,012 randomly selected U.S. adults (age 18 and over), 53% said that they were dissatisfied with the quality of education students receive in kindergarten through grade 12. The bootstrap distribution (based on 5,000 samples) is provided.
?
-Gallup conducted a survey of 1,015 randomly selected U.S. adults about "Black Friday"shopping. They asked the following question:
"As you know, the Friday after Thanksgiving is one of the biggest shopping days of the year.
Looking ahead, do you personally plan on shopping on the Friday after Thanksgiving, or not?"Of the 515 men who responded, 16% said "Yes."
Of the 500 women who responded, 20% said "Yes."
The standard error of the differences in proportions
is about
Use the normal distribution to test, at the 5% level, if the proportions of men and women who planned to shop on the Friday after Thanksgiving are significantly different. The sample size is large enough to use the normal distribution.
Question
Use the following to answer the questions below:
The gas prices for a random sample of n = 10 gas stations in the state of Illinois have a mean of $3.975, with a standard deviation of $0.2266.
-The bootstrap distribution, based on 5,000 samples, is provided. Would it be appropriate to use the normal distribution to construct a confidence interval for the mean gas price in Illinois?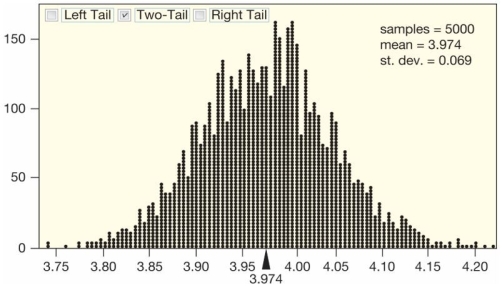
Question
Question
? 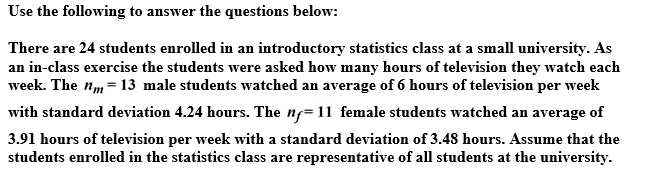
-The randomization distribution for -
-  (where
  and
and  are the sample mean amount of television watched by male and female students, respectively) is provided. Would it be appropriate to use the normal distribution to perform a test comparing the mean amount of television watched per week by male and female students at this university?
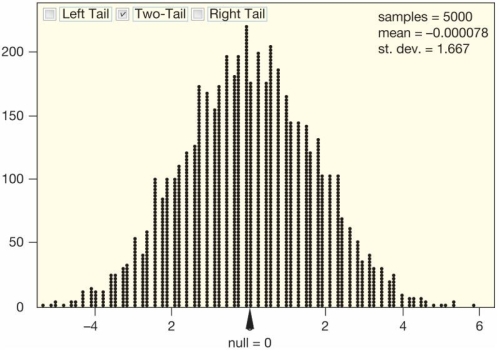
-The randomization distribution for
- (where and are the sample mean amount of television watched by male and female students, respectively) is provided. Would it be appropriate to use the normal distribution to perform a test comparing the mean amount of television watched per week by male and female students at this university? Question
-The standard error of the differences and
and  is about SE = 1.667. Use the normal distribution to test, at the 5% level, if male students at this university watch, on average, more television than female students. Include all details of the test.
-The standard error of the differences
and is about SE = 1.667. Use the normal distribution to test, at the 5% level, if male students at this university watch, on average, more television than female students. Include all details of the test. Question
?
-A biologist interested in estimating the correlation between the body mass (in grams) and body length (in cm) of porcupines has a random sample of 18 porcupines with
The bootstrap distribution she constructed is approximately normal and the standard error is estimated to be 0.165. Use the normal distribution to construct and interpret a 98% confidence interval for the correlation between body mass and body length in porcupines. Round all values to three decimal places.
A) 0.023 to 0.791
B) 0.019 to 0.795
C) 0.010 to 0.840
D) 0.028 to 0.800

Unlock Deck
Sign up to unlock the cards in this deck!
Unlock Deck
Unlock Deck
1/74
Play
Full screen (f)
Deck 5: Approximating With a Distribution
1
Use the following to answer the questions below:
Select the answer closest to the specified areas for a N(0, 1) density. Round to three decimal places.
-The area to the left of z = 0.63.
A) 0.736
B) 0.264
C) 0.525
D) 0.041
Select the answer closest to the specified areas for a N(0, 1) density. Round to three decimal places.
-The area to the left of z = 0.63.
A) 0.736
B) 0.264
C) 0.525
D) 0.041
0.736
2
Use the following to answer the questions below:
Select the answer closest to the specified areas for a N(0, 1) density. Round to three decimal places.
-The area to the right of z = -0.47.
A) 0.341
B) 0.770
C) 0.681
D) 0.319
Select the answer closest to the specified areas for a N(0, 1) density. Round to three decimal places.
-The area to the right of z = -0.47.
A) 0.341
B) 0.770
C) 0.681
D) 0.319
0.681
3
Use the following to answer the questions below:
Select the answer closest to the specified areas for a N(0, 1) density. Round to three decimal places.
-The area between z = 0.51 and z = 2.79.
A) 0.695
B) 0.302
C) 0.692
D) 0.997
Select the answer closest to the specified areas for a N(0, 1) density. Round to three decimal places.
-The area between z = 0.51 and z = 2.79.
A) 0.695
B) 0.302
C) 0.692
D) 0.997
0.302
4
Use the following to answer the questions below:
Select the answer closest to the specified areas for a N(0, 1) density. Round to three decimal places.
-The area outside of the interval z = -2.13 and z = 1.11.
A) 0.133
B) 0.017
C) 0.850
D) 0.150
Select the answer closest to the specified areas for a N(0, 1) density. Round to three decimal places.
-The area outside of the interval z = -2.13 and z = 1.11.
A) 0.133
B) 0.017
C) 0.850
D) 0.150
Unlock Deck
Unlock for access to all 74 flashcards in this deck.
Unlock Deck
k this deck
5
Use the following to answer the questions below:
Find the endpoint(s) on a N(0, 1) density with the given property. Round to three decimal places.
-The area to the left of the endpoint is about 0.20.
A) -2.054
B) 0.842
C) -0.842
D) 2.054
Find the endpoint(s) on a N(0, 1) density with the given property. Round to three decimal places.
-The area to the left of the endpoint is about 0.20.
A) -2.054
B) 0.842
C) -0.842
D) 2.054
Unlock Deck
Unlock for access to all 74 flashcards in this deck.
Unlock Deck
k this deck
6
Use the following to answer the questions below:
Find the endpoint(s) on a N(0, 1) density with the given property. Round to three decimal places.
-The area to the right of the endpoint is about 0.85.
A) -1.036
B) 1.036
C) -0.842
D) 1.375
Find the endpoint(s) on a N(0, 1) density with the given property. Round to three decimal places.
-The area to the right of the endpoint is about 0.85.
A) -1.036
B) 1.036
C) -0.842
D) 1.375
Unlock Deck
Unlock for access to all 74 flashcards in this deck.
Unlock Deck
k this deck
7
Use the following to answer the questions below:
Find the endpoint(s) on a N(0, 1) density with the given property. Round to three decimal places.
-The area between ±z is about 0.88.
A) 1.175
B) 1.645
C) 1.275
D) 1.555
Find the endpoint(s) on a N(0, 1) density with the given property. Round to three decimal places.
-The area between ±z is about 0.88.
A) 1.175
B) 1.645
C) 1.275
D) 1.555
Unlock Deck
Unlock for access to all 74 flashcards in this deck.
Unlock Deck
k this deck
8
Use the following to answer the questions below:
Select the answer closest to the specified areas for a normal density. Round to three decimal places.
-The area to the left of 32 on a N(45, 8) distribution.
A) 0.948
B) 0.052
C) 0.896
D) 0.104
Select the answer closest to the specified areas for a normal density. Round to three decimal places.
-The area to the left of 32 on a N(45, 8) distribution.
A) 0.948
B) 0.052
C) 0.896
D) 0.104
Unlock Deck
Unlock for access to all 74 flashcards in this deck.
Unlock Deck
k this deck
9
Use the following to answer the questions below:
Select the answer closest to the specified areas for a normal density. Round to three decimal places.
-The area to the right of 12 on a N(60, 4) distribution.
A) 0.691
B) 0.383
C) 0.617
D) 0.309
Select the answer closest to the specified areas for a normal density. Round to three decimal places.
-The area to the right of 12 on a N(60, 4) distribution.
A) 0.691
B) 0.383
C) 0.617
D) 0.309
Unlock Deck
Unlock for access to all 74 flashcards in this deck.
Unlock Deck
k this deck
10
Use the following to answer the questions below:
Select the answer closest to the specified areas for a normal density. Round to three decimal places.
-The area between 43 and 100 on a N(14, 3) distribution.
A) 0.985
B) 0.122
C) 0.863
D) 0.878
Select the answer closest to the specified areas for a normal density. Round to three decimal places.
-The area between 43 and 100 on a N(14, 3) distribution.
A) 0.985
B) 0.122
C) 0.863
D) 0.878
Unlock Deck
Unlock for access to all 74 flashcards in this deck.
Unlock Deck
k this deck
11
Use the following to answer the questions below:
Find the endpoint(s) on the normal density curve with the given property. Round to three decimal places.
-The area to the left of the endpoint on a N(54, 2.5) curve is about 0.15.
A) 51.409
B) 56.591
C) 59.425
D) 48.575
Find the endpoint(s) on the normal density curve with the given property. Round to three decimal places.
-The area to the left of the endpoint on a N(54, 2.5) curve is about 0.15.
A) 51.409
B) 56.591
C) 59.425
D) 48.575
Unlock Deck
Unlock for access to all 74 flashcards in this deck.
Unlock Deck
k this deck
12
Use the following to answer the questions below:
Find the endpoint(s) on the normal density curve with the given property. Round to three decimal places.
-The area to the right of the endpoint on a N(26, 4) curve is about 0.4.
A) 18.997
B) 24.987
C) 33.003
D) 27.013
Find the endpoint(s) on the normal density curve with the given property. Round to three decimal places.
-The area to the right of the endpoint on a N(26, 4) curve is about 0.4.
A) 18.997
B) 24.987
C) 33.003
D) 27.013
Unlock Deck
Unlock for access to all 74 flashcards in this deck.
Unlock Deck
k this deck
13
Use the following to answer the questions below:
Find the endpoint(s) on the normal density curve with the given property. Round to three decimal places.
-The symmetric middle area on a N(12, 4) curve is about 0.75.
A) 4.160 and 19.840
B) 7.399 and 16.601
C) 9.302 and 14.698
D) 6.874 and 17.126
Find the endpoint(s) on the normal density curve with the given property. Round to three decimal places.
-The symmetric middle area on a N(12, 4) curve is about 0.75.
A) 4.160 and 19.840
B) 7.399 and 16.601
C) 9.302 and 14.698
D) 6.874 and 17.126
Unlock Deck
Unlock for access to all 74 flashcards in this deck.
Unlock Deck
k this deck
14
Use the following to answer the questions below:
It is generally believed that the heights of adults males in the U.S. are approximately normally distributed with mean 70 inches (5 feet, 10 inches) and standard deviation 3 inches and that the heights of adult females in the U.S. are also approximately normally distributed with mean 64 inches (5 feet, 4 inches) and standard deviation 2.5 inches. A small university is considering custom ordering beds for their dorm rooms. Answer the following questions about the lengths of beds in dorm rooms at this university.
-Draw a sketch of the distribution of women's heights and label at least three points on the horizontal axis.
Unlock Deck
Unlock for access to all 74 flashcards in this deck.
Unlock Deck
k this deck
15
Use the following to answer the questions below:
It is generally believed that the heights of adults males in the U.S. are approximately normally distributed with mean 70 inches (5 feet, 10 inches) and standard deviation 3 inches and that the heights of adult females in the U.S. are also approximately normally distributed with mean 64 inches (5 feet, 4 inches) and standard deviation 2.5 inches. A small university is considering custom ordering beds for their dorm rooms. Answer the following questions about the lengths of beds in dorm rooms at this university.
-The beds that the university currently purchases are 75 inches long. What proportion of males will be able to fit on the bed while lying perfectly straight? Round your answer to three decimal places.
Unlock Deck
Unlock for access to all 74 flashcards in this deck.
Unlock Deck
k this deck
16
Use the following to answer the questions below:
It is generally believed that the heights of adults males in the U.S. are approximately normally distributed with mean 70 inches (5 feet, 10 inches) and standard deviation 3 inches and that the heights of adult females in the U.S. are also approximately normally distributed with mean 64 inches (5 feet, 4 inches) and standard deviation 2.5 inches. A small university is considering custom ordering beds for their dorm rooms. Answer the following questions about the lengths of beds in dorm rooms at this university.
-Should the university be concerned that females will not fit in the 75 inch beds?
Unlock Deck
Unlock for access to all 74 flashcards in this deck.
Unlock Deck
k this deck
17
Use the following to answer the questions below:
It is generally believed that the heights of adults males in the U.S. are approximately normally distributed with mean 70 inches (5 feet, 10 inches) and standard deviation 3 inches and that the heights of adult females in the U.S. are also approximately normally distributed with mean 64 inches (5 feet, 4 inches) and standard deviation 2.5 inches. A small university is considering custom ordering beds for their dorm rooms. Answer the following questions about the lengths of beds in dorm rooms at this university.
-The university plans on ordering custom sized beds such that 99% of male students are expected to fit in them when lying perfectly straight. What length beds should they order? Round your answer to the nearest inch.
A) 77 inches
B) 78 inches
C) 76 inches
D) 75 inches
Unlock Deck
Unlock for access to all 74 flashcards in this deck.
Unlock Deck
k this deck
18
Use the following to answer the questions below:
It is generally believed that the heights of adults males in the U.S. are approximately normally distributed with mean 70 inches (5 feet, 10 inches) and standard deviation 3 inches and that the heights of adult females in the U.S. are also approximately normally distributed with mean 64 inches (5 feet, 4 inches) and standard deviation 2.5 inches. A small university is considering custom ordering beds for their dorm rooms. Answer the following questions about the lengths of beds in dorm rooms at this university.
-The university decides it is too expensive to replace all the beds. Suppose the university has 2,150 beds all of which are 75 inches long. How many beds should they replace? You may assume that only those males taller than 75 inches will receive the longer beds and that females make up half of the population that will need a dorm room bed.
A) 52 beds
B) 44 beds
C) 32 beds
D) 28 beds
Unlock Deck
Unlock for access to all 74 flashcards in this deck.
Unlock Deck
k this deck
19
Use the following to answer the questions below:
In the following, convert an area from one normal distribution to an equivalent area for a different normal distribution. Show details of your calculation. Draw sketches of both normal distributions, find and label the endpoints, and shade the regions on both curves.
-The area to the left of 16 for a N(20, 3) distribution converted to a standard normal distribution
Unlock Deck
Unlock for access to all 74 flashcards in this deck.
Unlock Deck
k this deck
20
Use the following to answer the questions below:
In the following, convert an area from one normal distribution to an equivalent area for a different normal distribution. Show details of your calculation. Draw sketches of both normal distributions, find and label the endpoints, and shade the regions on both curves.
-The "Q1" for a standard normal distribution converted to a N(15, 2.5) distribution.
Unlock Deck
Unlock for access to all 74 flashcards in this deck.
Unlock Deck
k this deck
21
Use the following to answer the questions below:
In the following, convert an area from one normal distribution to an equivalent area for a different normal distribution. Show details of your calculation. Draw sketches of both normal distributions, find and label the endpoints, and shade the regions on both curves.
-The area to the right of 50 in a N(40, 8) distribution converted to a standard normal distribution.
Unlock Deck
Unlock for access to all 74 flashcards in this deck.
Unlock Deck
k this deck
22
Use the following to answer the questions below:
In the following, convert an area from one normal distribution to an equivalent area for a different normal distribution. Show details of your calculation. Draw sketches of both normal distributions, find and label the endpoints, and shade the regions on both curves.
-The middle 90% for a standard normal distribution converted to a N(45, 15) distribution.
Unlock Deck
Unlock for access to all 74 flashcards in this deck.
Unlock Deck
k this deck
23
Use the following to answer the questions below:
Heights of 10-year-old girls (5th graders) follow an approximately normal distribution with mean inches and standard deviation of inches.
-Draw a sketch of this normal distribution and label at least three points on the horizontal axis.
Heights of 10-year-old girls (5th graders) follow an approximately normal distribution with mean inches and standard deviation of inches.
-Draw a sketch of this normal distribution and label at least three points on the horizontal axis.
Unlock Deck
Unlock for access to all 74 flashcards in this deck.
Unlock Deck
k this deck
24
Use the following to answer the questions below:
Heights of 10-year-old girls (5th graders) follow an approximately normal distribution with mean inches and standard deviation of inches.
-What proportion of 10-year-old girls are shorter than 48 inches (4 feet)? Report your answer with four decimal places.
Heights of 10-year-old girls (5th graders) follow an approximately normal distribution with mean inches and standard deviation of inches.
-What proportion of 10-year-old girls are shorter than 48 inches (4 feet)? Report your answer with four decimal places.
Unlock Deck
Unlock for access to all 74 flashcards in this deck.
Unlock Deck
k this deck
25
Use the following to answer the questions below:
Heights of 10-year-old girls (5th graders) follow an approximately normal distribution with mean inches and standard deviation of inches.
-What proportion of 10-year-old girls are taller than 60 inches (5 feet)? Report your answer with three decimal places.
Heights of 10-year-old girls (5th graders) follow an approximately normal distribution with mean inches and standard deviation of inches.
-What proportion of 10-year-old girls are taller than 60 inches (5 feet)? Report your answer with three decimal places.
Unlock Deck
Unlock for access to all 74 flashcards in this deck.
Unlock Deck
k this deck
26
Use the following to answer the questions below:
Heights of 10-year-old girls (5th graders) follow an approximately normal distribution with mean inches and standard deviation of inches.
-What proportion of 10-year-old girls have heights between 50 and 55 inches? Report your answer with three decimal places.
Heights of 10-year-old girls (5th graders) follow an approximately normal distribution with mean inches and standard deviation of inches.
-What proportion of 10-year-old girls have heights between 50 and 55 inches? Report your answer with three decimal places.
Unlock Deck
Unlock for access to all 74 flashcards in this deck.
Unlock Deck
k this deck
27
Use the following to answer the questions below:
Heights of 10-year-old girls (5th graders) follow an approximately normal distribution with mean inches and standard deviation of inches.
-A parent says her 10-year-old daughter is in the 95th percentile in height. How tall is the girl? Report your answer with one decimal place.
A) 58.8 inches
B) 59.8 inches
C) 57.1 inches
D) 60.5 inches
Unlock Deck
Unlock for access to all 74 flashcards in this deck.
Unlock Deck
k this deck
28
Use the following to answer the questions below:
Heights of 10-year-old girls (5th graders) follow an approximately normal distribution with mean inches and standard deviation of inches.
-The tallest 15% of 10-year-old girls are taller than what height? Report your answer with one decimal place.
A) 57.2 inches
B) 57.8 inches
C) 58.8.8 inches
D) 59.8 inches
Unlock Deck
Unlock for access to all 74 flashcards in this deck.
Unlock Deck
k this deck
29
Use the following to answer the questions below:
Heights of 10-year-old girls (5th graders) follow an approximately normal distribution with mean inches and standard deviation of inches.
-What is the first quartile of heights of 10-year-old girls? Report your answer with one decimal place.
A) 52.6 inches
B) 51.7 inches
C) 54.4 inches
D) 53.2 inches
Unlock Deck
Unlock for access to all 74 flashcards in this deck.
Unlock Deck
k this deck
30
Use the following to answer the questions below:
Heights of 10-year-old girls (5th graders) follow an approximately normal distribution with mean inches and standard deviation of inches.
-What is the IQR of heights of 10-year-old girls? Note that you will need to find two endpoints of the distribution for your calculation. Report you answer with one decimal place.
A) 3.6 inches
B) 3.1 inches
C) 4.2 inches
D) 4.7 inches
Unlock Deck
Unlock for access to all 74 flashcards in this deck.
Unlock Deck
k this deck
31
Use the following to answer the questions below:
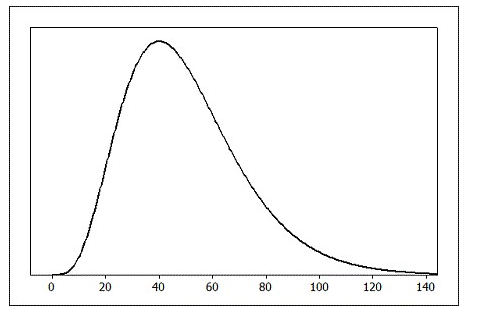
Use the provided density function to choose the best estimate for the proportion of the population found in the specified region.
-The percent of the population that is less than 20 is closest to
A) 5%
B) 25%
C) 75%
D) 95%
Use the provided density function to choose the best estimate for the proportion of the population found in the specified region.
-The percent of the population that is less than 20 is closest to
A) 5%
B) 25%
C) 75%
D) 95%
Unlock Deck
Unlock for access to all 74 flashcards in this deck.
Unlock Deck
k this deck
32
Use the following to answer the questions below:
Use the provided density function to choose the best estimate for the proportion of the population found in the specified region.
-The percent of the population that is less than 40 is closest to
A) 15%
B) 35%
C) 75%
D) 95%
Use the provided density function to choose the best estimate for the proportion of the population found in the specified region.
-The percent of the population that is less than 40 is closest to
A) 15%
B) 35%
C) 75%
D) 95%
Unlock Deck
Unlock for access to all 74 flashcards in this deck.
Unlock Deck
k this deck
33
Use the following to answer the questions below:
Use the provided density function to choose the best estimate for the proportion of the population found in the specified region.
-The percent of the population that is more than 100 is closest to
A) 75%
B) 20%
C) 10%
D) 2%
Use the provided density function to choose the best estimate for the proportion of the population found in the specified region.
-The percent of the population that is more than 100 is closest to
A) 75%
B) 20%
C) 10%
D) 2%
Unlock Deck
Unlock for access to all 74 flashcards in this deck.
Unlock Deck
k this deck
34
Use the following to answer the questions below:
Use the provided density function to choose the best estimate for the proportion of the population found in the specified region.
-The percent of the population that is more than 50 is closest to
A) 25%
B) 75%
C) 50%
D) 90%
Use the provided density function to choose the best estimate for the proportion of the population found in the specified region.
-The percent of the population that is more than 50 is closest to
A) 25%
B) 75%
C) 50%
D) 90%
Unlock Deck
Unlock for access to all 74 flashcards in this deck.
Unlock Deck
k this deck
35
Use the following to answer the questions below:
Use the provided density function to choose the best estimate for the proportion of the population found in the specified region.
-The percent of the population between 20 and 80 is closest to
A) 85%
B) 99%
C) 70%
D) 50%
Use the provided density function to choose the best estimate for the proportion of the population found in the specified region.
-The percent of the population between 20 and 80 is closest to
A) 85%
B) 99%
C) 70%
D) 50%
Unlock Deck
Unlock for access to all 74 flashcards in this deck.
Unlock Deck
k this deck
36
Use the following to answer the questions below:
A student suspects that the length of songs currently on her Spotify playlist are approximately normally distributed with a mean of 257 seconds and standard deviation 62 seconds.
-Draw a sketch of this normal distribution and label at least three points on the horizontal axis.
A student suspects that the length of songs currently on her Spotify playlist are approximately normally distributed with a mean of 257 seconds and standard deviation 62 seconds.
-Draw a sketch of this normal distribution and label at least three points on the horizontal axis.
Unlock Deck
Unlock for access to all 74 flashcards in this deck.
Unlock Deck
k this deck
37
Use the following to answer the questions below:
A student suspects that the length of songs currently on her Spotify playlist are approximately normally distributed with a mean of 257 seconds and standard deviation 62 seconds.
-What proportion of songs are less than 180 seconds (3 minutes)? Report your answer with three decimal places.
A student suspects that the length of songs currently on her Spotify playlist are approximately normally distributed with a mean of 257 seconds and standard deviation 62 seconds.
-What proportion of songs are less than 180 seconds (3 minutes)? Report your answer with three decimal places.
Unlock Deck
Unlock for access to all 74 flashcards in this deck.
Unlock Deck
k this deck
38
Use the following to answer the questions below:
A student suspects that the length of songs currently on her Spotify playlist are approximately normally distributed with a mean of 257 seconds and standard deviation 62 seconds.
-What proportion of songs are longer than 300 seconds (5 minutes)? Report your answer with three decimal places.
A student suspects that the length of songs currently on her Spotify playlist are approximately normally distributed with a mean of 257 seconds and standard deviation 62 seconds.
-What proportion of songs are longer than 300 seconds (5 minutes)? Report your answer with three decimal places.
Unlock Deck
Unlock for access to all 74 flashcards in this deck.
Unlock Deck
k this deck
39
Use the following to answer the questions below:
A student suspects that the length of songs currently on her Spotify playlist are approximately normally distributed with a mean of 257 seconds and standard deviation 62 seconds.
-What proportion of songs are between 240 and 360 seconds (4 minutes and 6 minutes)? Report your answer with three decimal places.
Unlock Deck
Unlock for access to all 74 flashcards in this deck.
Unlock Deck
k this deck
40
Use the following to answer the questions below:
A student suspects that the length of songs currently on her Spotify playlist are approximately normally distributed with a mean of 257 seconds and standard deviation 62 seconds.
-The shortest 10% of songs are shorter than what length? Report your answer with one decimal place.
A) 177.5 seconds
B) 179.4 seconds
C) 181.5 seconds
D) 185.9 seconds
Unlock Deck
Unlock for access to all 74 flashcards in this deck.
Unlock Deck
k this deck
41
Use the following to answer the questions below:
A student suspects that the length of songs currently on her Spotify playlist are approximately normally distributed with a mean of 257 seconds and standard deviation 62 seconds.
-The longest 25% of songs are longer than what length? Report your answer with one decimal place.
A) 298.8 seconds
B) 271.5 seconds
C) 282.9 seconds
D) 291.2 seconds
Unlock Deck
Unlock for access to all 74 flashcards in this deck.
Unlock Deck
k this deck
42
Use the following to answer the questions below:
A student suspects that the length of songs currently on her Spotify playlist are approximately normally distributed with a mean of 257 seconds and standard deviation 62 seconds.
-The symmetric middle 90% of songs have lengths between what two values? Round all values to one decimal place.
A) 155.0 seconds and 359.0 seconds
B) 151.0 seconds and 363.0 seconds
C) 149.0 seconds and 365.0 seconds
D) 153.0 seconds and 361.0 seconds
Unlock Deck
Unlock for access to all 74 flashcards in this deck.
Unlock Deck
k this deck
43
Use the following to answer the questions below:
Robins are common birds in North America. Suppose that the wingspan of robins is approximately normal with mean 14 inches and standard deviation 0.7 inches.
-Draw a sketch of this normal distribution and label at least three points on the horizontal axis.
Robins are common birds in North America. Suppose that the wingspan of robins is approximately normal with mean 14 inches and standard deviation 0.7 inches.
-Draw a sketch of this normal distribution and label at least three points on the horizontal axis.
Unlock Deck
Unlock for access to all 74 flashcards in this deck.
Unlock Deck
k this deck
44
Use the following to answer the questions below:
Robins are common birds in North America. Suppose that the wingspan of robins is approximately normal with mean 14 inches and standard deviation 0.7 inches.
-What proportion of robins have wingspans less than 13 inches? Report your answer with three decimal places.
Robins are common birds in North America. Suppose that the wingspan of robins is approximately normal with mean 14 inches and standard deviation 0.7 inches.
-What proportion of robins have wingspans less than 13 inches? Report your answer with three decimal places.
Unlock Deck
Unlock for access to all 74 flashcards in this deck.
Unlock Deck
k this deck
45
Use the following to answer the questions below:
Robins are common birds in North America. Suppose that the wingspan of robins is approximately normal with mean 14 inches and standard deviation 0.7 inches.
-What proportion of robins have wingspans longer 15.5 inches? Report your answer with three decimal places.
Robins are common birds in North America. Suppose that the wingspan of robins is approximately normal with mean 14 inches and standard deviation 0.7 inches.
-What proportion of robins have wingspans longer 15.5 inches? Report your answer with three decimal places.
Unlock Deck
Unlock for access to all 74 flashcards in this deck.
Unlock Deck
k this deck
46
Use the following to answer the questions below:
Robins are common birds in North America. Suppose that the wingspan of robins is approximately normal with mean 14 inches and standard deviation 0.7 inches.
-What proportion of robins have wingspans between 12.5 and 13.5 inches? Report your answer with three decimal places.
Robins are common birds in North America. Suppose that the wingspan of robins is approximately normal with mean 14 inches and standard deviation 0.7 inches.
-What proportion of robins have wingspans between 12.5 and 13.5 inches? Report your answer with three decimal places.
Unlock Deck
Unlock for access to all 74 flashcards in this deck.
Unlock Deck
k this deck
47
Use the following to answer the questions below:
Robins are common birds in North America. Suppose that the wingspan of robins is approximately normal with mean 14 inches and standard deviation 0.7 inches.
-What is the 30th percentile of robin wingspans? Report your answer with two decimal places.
A) 13.63 inches
B) 13.21 inches
C) 12.74 inches
D) 12.36 inches
Unlock Deck
Unlock for access to all 74 flashcards in this deck.
Unlock Deck
k this deck
48
Use the following to answer the questions below:
Robins are common birds in North America. Suppose that the wingspan of robins is approximately normal with mean 14 inches and standard deviation 0.7 inches.
-The largest 20% of robins have wingspans longer than what value? Report your answer with two decimal places.
A) 14.59 inches
B) 14.87 inches
C) 14.32 inches
D) 13.79 inches
Unlock Deck
Unlock for access to all 74 flashcards in this deck.
Unlock Deck
k this deck
49
Use the following to answer the questions below:
Final grades in Professor Albert's large calculus class are approximately normally distributed with a mean of 76 (%) and standard deviation of 8 (%).
-Draw a sketch of this normal distribution and label at least three points on the horizontal axis.
Final grades in Professor Albert's large calculus class are approximately normally distributed with a mean of 76 (%) and standard deviation of 8 (%).
-Draw a sketch of this normal distribution and label at least three points on the horizontal axis.
Unlock Deck
Unlock for access to all 74 flashcards in this deck.
Unlock Deck
k this deck
50
Use the following to answer the questions below:
Final grades in Professor Albert's large calculus class are approximately normally distributed with a mean of 76 (%) and standard deviation of 8 (%).
-In Professor Albert's course, students who earn less than a 60% in the class are assigned a failing grade (F). What proportion of the students earned F's? Report your answer with three decimal places.
Unlock Deck
Unlock for access to all 74 flashcards in this deck.
Unlock Deck
k this deck
51
Use the following to answer the questions below:
Final grades in Professor Albert's large calculus class are approximately normally distributed with a mean of 76 (%) and standard deviation of 8 (%).
-In Professor Albert's course, students who earn above a 94% are assigned an "A."What proportion of students earned A's? Report your answer with three decimal places.
Unlock Deck
Unlock for access to all 74 flashcards in this deck.
Unlock Deck
k this deck
52
Use the following to answer the questions below:
Final grades in Professor Albert's large calculus class are approximately normally distributed with a mean of 76 (%) and standard deviation of 8 (%).
-What proportion of students earn between an 82% and 88% in this class? Report your answer with three decimal places.
Final grades in Professor Albert's large calculus class are approximately normally distributed with a mean of 76 (%) and standard deviation of 8 (%).
-What proportion of students earn between an 82% and 88% in this class? Report your answer with three decimal places.
Unlock Deck
Unlock for access to all 74 flashcards in this deck.
Unlock Deck
k this deck
53
Use the following to answer the questions below:
Final grades in Professor Albert's large calculus class are approximately normally distributed with a mean of 76 (%) and standard deviation of 8 (%).
-What is the 25th percentile in this course? Report your answer with one decimal place.
A) 70.6%
B) 70.9%
C) 72.3%
D) 71.4%
Final grades in Professor Albert's large calculus class are approximately normally distributed with a mean of 76 (%) and standard deviation of 8 (%).
-What is the 25th percentile in this course? Report your answer with one decimal place.
A) 70.6%
B) 70.9%
C) 72.3%
D) 71.4%
Unlock Deck
Unlock for access to all 74 flashcards in this deck.
Unlock Deck
k this deck
54
Use the following to answer the questions below:
Final grades in Professor Albert's large calculus class are approximately normally distributed with a mean of 76 (%) and standard deviation of 8 (%).
-The top 30% of students earned scores above what value? Report your answer with one decimal place.
A) 80.2%
B) 79.8%
C) 79.3%
D) 78.4%
Final grades in Professor Albert's large calculus class are approximately normally distributed with a mean of 76 (%) and standard deviation of 8 (%).
-The top 30% of students earned scores above what value? Report your answer with one decimal place.
A) 80.2%
B) 79.8%
C) 79.3%
D) 78.4%
Unlock Deck
Unlock for access to all 74 flashcards in this deck.
Unlock Deck
k this deck
55
Use the following to answer the questions below:
Find the z* values based on a standard normal distribution for each of the following. Round to three decimal places.
-An 86% confidence interval for a proportion.
A) 1.080
B) 1.476
C) 0.994
D) 1.960
Find the z* values based on a standard normal distribution for each of the following. Round to three decimal places.
-An 86% confidence interval for a proportion.
A) 1.080
B) 1.476
C) 0.994
D) 1.960
Unlock Deck
Unlock for access to all 74 flashcards in this deck.
Unlock Deck
k this deck
56
Use the following to answer the questions below:
Find the z* values based on a standard normal distribution for each of the following. Round to three decimal places.
-An 88% confidence interval for a correlation.
A) 2.575
B) 1.175
C) 2.326
D) 1.555
Find the z* values based on a standard normal distribution for each of the following. Round to three decimal places.
-An 88% confidence interval for a correlation.
A) 2.575
B) 1.175
C) 2.326
D) 1.555
Unlock Deck
Unlock for access to all 74 flashcards in this deck.
Unlock Deck
k this deck
57
Use the following to answer the questions below:
Find the z* values based on a standard normal distribution for each of the following. Round to three decimal places.
-A 78% confidence interval for a mean.
A) 0.772
B) 1.227
C) 1.514
D) 1.126
Find the z* values based on a standard normal distribution for each of the following. Round to three decimal places.
-A 78% confidence interval for a mean.
A) 0.772
B) 1.227
C) 1.514
D) 1.126
Unlock Deck
Unlock for access to all 74 flashcards in this deck.
Unlock Deck
k this deck
58
Use the following to answer the questions below:
Find the z* values based on a standard normal distribution for each of the following. Round to three decimal places.
-A 66% confidence interval for a slope.
A) 0.954
B) 0.412
C) 0.754
D) 1.016
Find the z* values based on a standard normal distribution for each of the following. Round to three decimal places.
-A 66% confidence interval for a slope.
A) 0.954
B) 0.412
C) 0.754
D) 1.016
Unlock Deck
Unlock for access to all 74 flashcards in this deck.
Unlock Deck
k this deck
59
Use the following to answer the questions below:
A set of hypotheses, some information from one or more samples, and a standard error from a randomization distribution are provided. Find the value of the standardized z-test statistic.
-Test : p = 0.75 versus : p > 0.75 when the sample has and
A) 0.03
B) 2
C) -2
D) 1.5
A set of hypotheses, some information from one or more samples, and a standard error from a randomization distribution are provided. Find the value of the standardized z-test statistic.
-Test
: p = 0.75 versus : p > 0.75 when the sample has and A) 0.03
B) 2
C) -2
D) 1.5
Unlock Deck
Unlock for access to all 74 flashcards in this deck.
Unlock Deck
k this deck
60
Use the following to answer the questions below:
A set of hypotheses, some information from one or more samples, and a standard error from a randomization distribution are provided. Find the value of the standardized z-test statistic.
-Test : = 26 versus : 26 when the sample has n = 75, s = 5.4, and SE = 0.6.
A) -1.5
B) 0.278
C) 2.5
D) -0.833
A set of hypotheses, some information from one or more samples, and a standard error from a randomization distribution are provided. Find the value of the standardized z-test statistic.
-Test
: = 26 versus : 26 when the sample has n = 75, s = 5.4, and SE = 0.6.A) -1.5
B) 0.278
C) 2.5
D) -0.833
Unlock Deck
Unlock for access to all 74 flashcards in this deck.
Unlock Deck
k this deck
61
Use the following to answer the questions below:
A set of hypotheses, some information from one or more samples, and a standard error from a randomization distribution are provided. Find the value of the standardized z-test statistic.
-Test : = and : when the samples have and The standard error of from the randomization distribution is 3.2.
A) 1.875
B) 6
C) 0.4
D) 0.5
A set of hypotheses, some information from one or more samples, and a standard error from a randomization distribution are provided. Find the value of the standardized z-test statistic.
-Test
: = and : when the samples have and The standard error of from the randomization distribution is 3.2.A) 1.875
B) 6
C) 0.4
D) 0.5
Unlock Deck
Unlock for access to all 74 flashcards in this deck.
Unlock Deck
k this deck
62
Use the following to answer the questions below:
Find the p-value based on a standard normal distribution for the standardized test statistic and provided alternative hypothesis.
-z = -1.86 for : p < 0.5
A) 0.031
B) 0.969
C) 0.062
D) 0.937
Find the p-value based on a standard normal distribution for the standardized test statistic and provided alternative hypothesis.
-z = -1.86 for
: p < 0.5A) 0.031
B) 0.969
C) 0.062
D) 0.937
Unlock Deck
Unlock for access to all 74 flashcards in this deck.
Unlock Deck
k this deck
63
Use the following to answer the questions below:
Find the p-value based on a standard normal distribution for the standardized test statistic and provided alternative hypothesis.
-z = 2.36 for : > 86
A) 0.982
B) 0.0182
C) 0.991
D) 0.0091
Find the p-value based on a standard normal distribution for the standardized test statistic and provided alternative hypothesis.
-z = 2.36 for
: > 86A) 0.982
B) 0.0182
C) 0.991
D) 0.0091
Unlock Deck
Unlock for access to all 74 flashcards in this deck.
Unlock Deck
k this deck
64
Use the following to answer the questions below:
Find the p-value based on a standard normal distribution for the standardized test statistic and provided alternative hypothesis.
-z = 1.75 for :
A) 0.960
B) 0.040
C) 0.080
D) 0.920
Find the p-value based on a standard normal distribution for the standardized test statistic and provided alternative hypothesis.
-z = 1.75 for
: A) 0.960
B) 0.040
C) 0.080
D) 0.920
Unlock Deck
Unlock for access to all 74 flashcards in this deck.
Unlock Deck
k this deck
65
Use the following to answer the questions below:
A Gallup survey of 1,012 randomly selected U.S. adults (age 18 and over), 53% said that they were dissatisfied with the quality of education students receive in kindergarten through grade 12. The bootstrap distribution (based on 5,000 samples) is provided.
?
-Would it be appropriate to use the normal distribution to construct the confidence interval in this situation?
Unlock Deck
Unlock for access to all 74 flashcards in this deck.
Unlock Deck
k this deck
66
Use the following to answer the questions below:
A Gallup survey of 1,012 randomly selected U.S. adults (age 18 and over), 53% said that they were dissatisfied with the quality of education students receive in kindergarten through grade 12. The bootstrap distribution (based on 5,000 samples) is provided.
-The standard error from the bootstrap distribution is SE = 0.016. Use the normal distribution to construct and interpret a 99% confidence interval for the proportion of U.S. adults who are dissatisfied with the education students receive in kindergarten through grade 12. Round to three decimal places.
Unlock Deck
Unlock for access to all 74 flashcards in this deck.
Unlock Deck
k this deck
67
Use the following to answer the questions below:
A Gallup survey of 1,012 randomly selected U.S. adults (age 18 and over), 53% said that they were dissatisfied with the quality of education students receive in kindergarten through grade 12. The bootstrap distribution (based on 5,000 samples) is provided.
-A Gallup survey of 1,012 randomly selected U.S. adults (age 18 and over), 53% said that they were dissatisfied with the quality of education students receive in kindergarten through grade 12. Use the normal distribution to test if the proportion of U.S. adults who are dissatisfied with the education that students receive in kindergarten through grade 12 differs from 50%. The randomization distribution for this test is approximately normal and the standard error is Include all details of the test and use a 5% significance level.
A Gallup survey of 1,012 randomly selected U.S. adults (age 18 and over), 53% said that they were dissatisfied with the quality of education students receive in kindergarten through grade 12. The bootstrap distribution (based on 5,000 samples) is provided.
-A Gallup survey of 1,012 randomly selected U.S. adults (age 18 and over), 53% said that they were dissatisfied with the quality of education students receive in kindergarten through grade 12. Use the normal distribution to test if the proportion of U.S. adults who are dissatisfied with the education that students receive in kindergarten through grade 12 differs from 50%. The randomization distribution for this test is approximately normal and the standard error is
Include all details of the test and use a 5% significance level. Unlock Deck
Unlock for access to all 74 flashcards in this deck.
Unlock Deck
k this deck
68
Use the following to answer the questions below:
A Gallup survey of 1,012 randomly selected U.S. adults (age 18 and over), 53% said that they were dissatisfied with the quality of education students receive in kindergarten through grade 12. The bootstrap distribution (based on 5,000 samples) is provided.
?
-A sample of 148 college students reports sleeping an average of 6.85 hours on weeknights. The sample size is large enough to use the normal distribution, and a bootstrap distribution shows that the standard error is
Use a normal distribution to construct and interpret a 95% confidence interval for the mean amount of weeknight sleep students get at this university. Use two decimal places in your answer.
A) 6.51 to 7.19 hours
B) 4.89 to 8.81 hours
C) 6.68 to 7.03 hours
D) 4.81 to 8.89 hours
Unlock Deck
Unlock for access to all 74 flashcards in this deck.
Unlock Deck
k this deck
69
Use the following to answer the questions below:
A Gallup survey of 1,012 randomly selected U.S. adults (age 18 and over), 53% said that they were dissatisfied with the quality of education students receive in kindergarten through grade 12. The bootstrap distribution (based on 5,000 samples) is provided.
?
-Gallup conducted a survey of 1,015 randomly selected U.S. adults about "Black Friday"shopping. They asked the following question:
"As you know, the Friday after Thanksgiving is one of the biggest shopping days of the year.
Looking ahead, do you personally plan on shopping on the Friday after Thanksgiving, or not?"Of the 515 men who responded, 16% said "Yes."
Of the 500 women who responded, 20% said "Yes."
The standard error of the differences in proportions
is about
Use the normal distribution to test, at the 5% level, if the proportions of men and women who planned to shop on the Friday after Thanksgiving are significantly different. The sample size is large enough to use the normal distribution.
Unlock Deck
Unlock for access to all 74 flashcards in this deck.
Unlock Deck
k this deck
70
Use the following to answer the questions below:
The gas prices for a random sample of n = 10 gas stations in the state of Illinois have a mean of $3.975, with a standard deviation of $0.2266.
-The bootstrap distribution, based on 5,000 samples, is provided. Would it be appropriate to use the normal distribution to construct a confidence interval for the mean gas price in Illinois?
Unlock Deck
Unlock for access to all 74 flashcards in this deck.
Unlock Deck
k this deck
71
Use the following to answer the questions below:
The gas prices for a random sample of n = 10 gas stations in the state of Illinois have a mean of $3.975, with a standard deviation of $0.2266.
-The standard error from the bootstrap distribution is SE = 0.069. Use the normal distribution to construct and interpret a 90% confidence interval for the mean gas price in Illinois. Round all values to two decimal places.
A) $3.86 to $4.09
B) $2.33 to $5.62
C) $3.91 to $4.04
D) $3.75 to $4.21
Unlock Deck
Unlock for access to all 74 flashcards in this deck.
Unlock Deck
k this deck
72
?
-The randomization distribution for - (where and are the sample mean amount of television watched by male and female students, respectively) is provided. Would it be appropriate to use the normal distribution to perform a test comparing the mean amount of television watched per week by male and female students at this university?
-The randomization distribution for
- (where and are the sample mean amount of television watched by male and female students, respectively) is provided. Would it be appropriate to use the normal distribution to perform a test comparing the mean amount of television watched per week by male and female students at this university? Unlock Deck
Unlock for access to all 74 flashcards in this deck.
Unlock Deck
k this deck
73
-The standard error of the differences and is about SE = 1.667. Use the normal distribution to test, at the 5% level, if male students at this university watch, on average, more television than female students. Include all details of the test.
-The standard error of the differences
and is about SE = 1.667. Use the normal distribution to test, at the 5% level, if male students at this university watch, on average, more television than female students. Include all details of the test. Unlock Deck
Unlock for access to all 74 flashcards in this deck.
Unlock Deck
k this deck
74
?
-A biologist interested in estimating the correlation between the body mass (in grams) and body length (in cm) of porcupines has a random sample of 18 porcupines with
The bootstrap distribution she constructed is approximately normal and the standard error is estimated to be 0.165. Use the normal distribution to construct and interpret a 98% confidence interval for the correlation between body mass and body length in porcupines. Round all values to three decimal places.
A) 0.023 to 0.791
B) 0.019 to 0.795
C) 0.010 to 0.840
D) 0.028 to 0.800
Unlock Deck
Unlock for access to all 74 flashcards in this deck.
Unlock Deck
k this deck
Unlock Deck
Unlock for access to all 74 flashcards in this deck.


