Exam 5: Approximating With a Distribution
Exam 1: Collecting Data68 Questions
Exam 2: Describing Data127 Questions
Exam 3: Confidence Intervals149 Questions
Exam 4: Hypothesis Tests117 Questions
Exam 5: Approximating With a Distribution74 Questions
Exam 6: Inference for Means and Proportions166 Questions
Exam 7: CHI-Square Tests for Categorical Variables45 Questions
Exam 8: Anova to Compare Means53 Questions
Exam 9: Inference for Regression123 Questions
Exam 10: Multiple Regression72 Questions
Select questions type
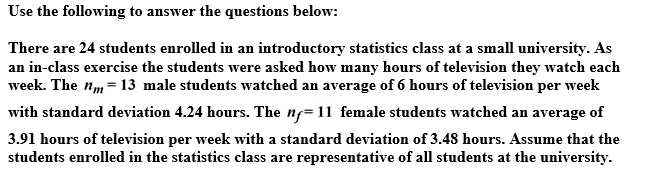
Use the following to answer the questions below:
It is generally believed that the heights of adults males in the U.S. are approximately normally distributed with mean 70 inches (5 feet, 10 inches) and standard deviation 3 inches and that the heights of adult females in the U.S. are also approximately normally distributed with mean 64 inches (5 feet, 4 inches) and standard deviation 2.5 inches. A small university is considering custom ordering beds for their dorm rooms. Answer the following questions about the lengths of beds in dorm rooms at this university.
-The beds that the university currently purchases are 75 inches long. What proportion of males will be able to fit on the bed while lying perfectly straight? Round your answer to three decimal places.
Free
(Short Answer)
5.0/5  (32)
(32)
Correct Answer: Verified
0.952
Use the following to answer the questions below:
A set of hypotheses, some information from one or more samples, and a standard error from a randomization distribution are provided. Find the value of the standardized z-test statistic.
-Test  : = 26 versus
  : 26 when the sample has n = 75,
  s = 5.4, and SE = 0.6.
Free
(Multiple Choice)
4.8/5 (30)
Correct Answer:Verified
D
Use the following to answer the questions below:
Use the provided density function to choose the best estimate for the proportion of the population found in the specified region.
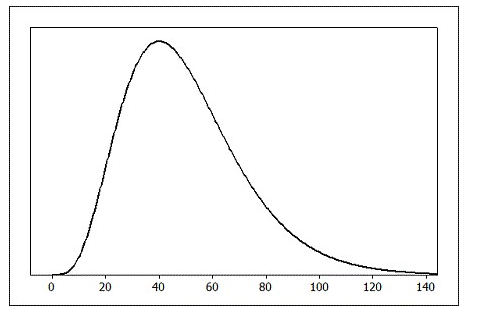 -The percent of the population that is more than 100 is closest to
Free
(Multiple Choice)
4.8/5 (34)
Correct Answer:Verified
D
Use the following to answer the questions below:
A student suspects that the length of songs currently on her Spotify playlist are approximately normally distributed with a mean of 257 seconds and standard deviation 62 seconds.
-Draw a sketch of this normal distribution and label at least three points on the horizontal axis.
(Essay)
4.8/5 (26)
Use the following to answer the questions below:
It is generally believed that the heights of adults males in the U.S. are approximately normally distributed with mean 70 inches (5 feet, 10 inches) and standard deviation 3 inches and that the heights of adult females in the U.S. are also approximately normally distributed with mean 64 inches (5 feet, 4 inches) and standard deviation 2.5 inches. A small university is considering custom ordering beds for their dorm rooms. Answer the following questions about the lengths of beds in dorm rooms at this university.
-Draw a sketch of the distribution of women's heights and label at least three points on the horizontal axis.
(Essay)
4.8/5 (27)
Use the following to answer the questions below:
A student suspects that the length of songs currently on her Spotify playlist are approximately normally distributed with a mean of 257 seconds and standard deviation 62 seconds.
-The symmetric middle 90% of songs have lengths between what two values? Round all values to one decimal place.
(Multiple Choice)
4.9/5 (43)
Use the following to answer the questions below:
Select the answer closest to the specified areas for a N(0, 1) density. Round to three decimal places.
-The area between z = 0.51 and z = 2.79.
(Multiple Choice)
4.8/5 (39)
Use the following to answer the questions below:
A student suspects that the length of songs currently on her Spotify playlist are approximately normally distributed with a mean of 257 seconds and standard deviation 62 seconds.
-What proportion of songs are longer than 300 seconds (5 minutes)? Report your answer with three decimal places.
(Short Answer)
4.8/5 (38)
Use the following to answer the questions below:
Final grades in Professor Albert's large calculus class are approximately normally distributed with a mean of 76 (%) and standard deviation of 8 (%).
-In Professor Albert's course, students who earn above a 94% are assigned an "A."What proportion of students earned A's? Report your answer with three decimal places.
(Short Answer)
4.8/5 (24)
Use the following to answer the questions below:
Final grades in Professor Albert's large calculus class are approximately normally distributed with a mean of 76 (%) and standard deviation of 8 (%).
-The top 30% of students earned scores above what value? Report your answer with one decimal place.
(Multiple Choice)
4.9/5 (37)
Use the following to answer the questions below:
A Gallup survey of 1,012 randomly selected U.S. adults (age 18 and over), 53% said that they were dissatisfied with the quality of education students receive in kindergarten through grade 12. The bootstrap distribution (based on 5,000 samples) is provided.
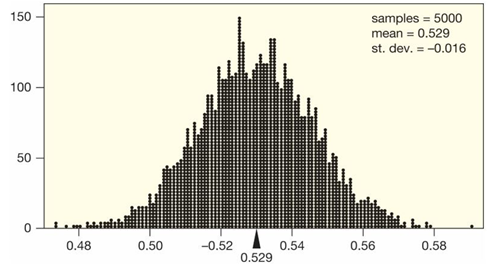 -Would it be appropriate to use the normal distribution to construct the confidence interval in this situation?
(True/False)
4.8/5 (29)
 -The randomization distribution for
  -
-  (where
  and
and  are the sample mean amount of television watched by male and female students, respectively) is provided. Would it be appropriate to use the normal distribution to perform a test comparing the mean amount of television watched per week by male and female students at this university?
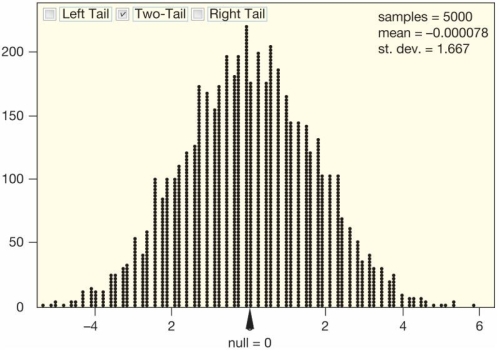
(True/False)
4.9/5 (36)
Use the following to answer the questions below:
Find the p-value based on a standard normal distribution for the standardized test statistic and provided alternative hypothesis.
-z = 1.75 for  :
: 

(Multiple Choice)
4.8/5 (22)
Use the following to answer the questions below:
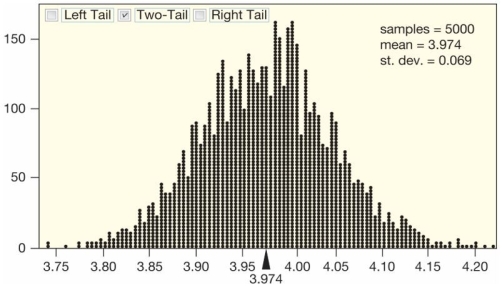
The gas prices for a random sample of n = 10 gas stations in the state of Illinois have a mean of $3.975, with a standard deviation of $0.2266.
-The bootstrap distribution, based on 5,000 samples, is provided. Would it be appropriate to use the normal distribution to construct a confidence interval for the mean gas price in Illinois?
(True/False)
4.8/5 (39)
Use the following to answer the questions below:
Select the answer closest to the specified areas for a normal density. Round to three decimal places.
-The area to the right of 12 on a N(60, 4) distribution.
(Multiple Choice)
4.8/5 (29)
Use the following to answer the questions below:
Final grades in Professor Albert's large calculus class are approximately normally distributed with a mean of 76 (%) and standard deviation of 8 (%).
-What is the 25th percentile in this course? Report your answer with one decimal place.
(Multiple Choice)
4.7/5 (35)
Use the following to answer the questions below:
Find the z* values based on a standard normal distribution for each of the following. Round to three decimal places.
-A 78% confidence interval for a mean.
(Multiple Choice)
4.9/5 (35)
Use the following to answer the questions below:
The gas prices for a random sample of n = 10 gas stations in the state of Illinois have a mean of $3.975, with a standard deviation of $0.2266.
-The standard error from the bootstrap distribution is SE = 0.069. Use the normal distribution to construct and interpret a 90% confidence interval for the mean gas price in Illinois. Round all values to two decimal places.
(Multiple Choice)
4.8/5 (39)
Use the following to answer the questions below:
Find the endpoint(s) on the normal density curve with the given property. Round to three decimal places.
-The symmetric middle area on a N(12, 4) curve is about 0.75.
(Multiple Choice)
4.8/5 (34)
Use the following to answer the questions below:
In the following, convert an area from one normal distribution to an equivalent area for a different normal distribution. Show details of your calculation. Draw sketches of both normal distributions, find and label the endpoints, and shade the regions on both curves.
-The middle 90% for a standard normal distribution converted to a N(45, 15) distribution.
(Essay)
4.8/5 (34)
Filters
- Essay(0)
- Multiple Choice(0)
- Short Answer(0)
- True False(0)
- Matching(0)