Deck 2: Frequency Tables
Full screen (f)
Question
Question
Question
Question
Question
Question
Question
Question
Question
Use the following table to answer questions:
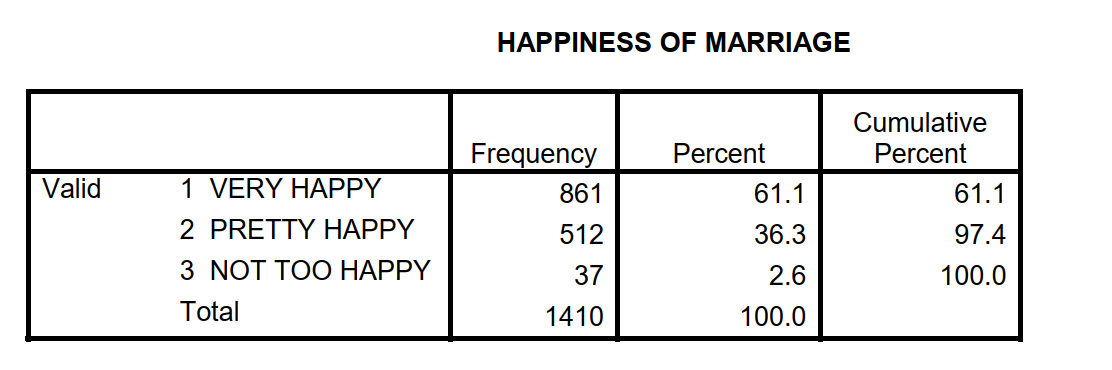
-How many individuals reported being "Not Too Happy" with their marriage?
A) 2.6
B) 37
C) 512
D) 861
-How many individuals reported being "Not Too Happy" with their marriage?
A) 2.6
B) 37
C) 512
D) 861
Question
Use the following table to answer questions:
-Which of the following is a value label?
A) very happy
B) frequency
C) percent
D) valid percent
-Which of the following is a value label?
A) very happy
B) frequency
C) percent
D) valid percent
Question
Use the following table to answer questions:
-What percentage of respondents reported being "Pretty Happy"?
A) 2.6
B) 36.3
C) 61.1
D) 97.4
-What percentage of respondents reported being "Pretty Happy"?
A) 2.6
B) 36.3
C) 61.1
D) 97.4
Question
Use the following table to answer questions:
-What percentage of respondents reported feeling "Pretty Happy" or better?
A) 2.6
B) 36.3
C) 61.1
D) 97.4
-What percentage of respondents reported feeling "Pretty Happy" or better?
A) 2.6
B) 36.3
C) 61.1
D) 97.4
Question
Use the following table to answer questions:
-How many respondents reported feeling "Pretty Happy" or better with their marriage?
A) 61.1
B) 512
C) 861
D) 1373
-How many respondents reported feeling "Pretty Happy" or better with their marriage?
A) 61.1
B) 512
C) 861
D) 1373
Question
Use the following table to answer questions:
-What is the value of N?
A) 861
B) 1373
C) 1410
D) 100%
-What is the value of N?
A) 861
B) 1373
C) 1410
D) 100%
Question
Use the following table to answer questions
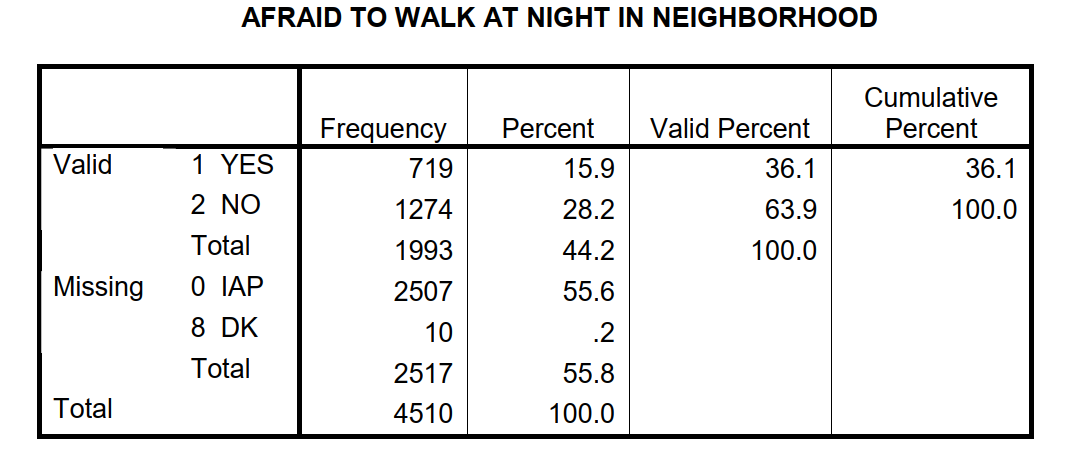
-What is the total number of missing cases?
A) 1993
B) 2507
C) 2517
D) 4510
-What is the total number of missing cases?
A) 1993
B) 2507
C) 2517
D) 4510
Question
Use the following table to answer questions
-What is the total number of valid cases?
A) 719
B) 1993
C) 2517
D) 4510
-What is the total number of valid cases?
A) 719
B) 1993
C) 2517
D) 4510
Question
Use the following table to answer questions
-What proportion of respondents are afraid to walk alone at night?
A) .282
B) .361
C) .639
D) 15.9
-What proportion of respondents are afraid to walk alone at night?
A) .282
B) .361
C) .639
D) 15.9
Question
Use the following table to answer questions
-What percent of respondents are NOT afraid to walk alone at night?
A) .639
B) 36.1
C) 63.9
D) 1274
-What percent of respondents are NOT afraid to walk alone at night?
A) .639
B) 36.1
C) 63.9
D) 1274
Question
Use the following table to answer questions
-What percent of cases are not valid (missing)?
A) 36.1
B) 55.8
C) 63.9
D) 100
-What percent of cases are not valid (missing)?
A) 36.1
B) 55.8
C) 63.9
D) 100
Question
Use the following table to answer questions
-How many respondents are afraid to walk alone at night?
A) 719
B) 1274
C) 1993
D) 2517
-How many respondents are afraid to walk alone at night?
A) 719
B) 1274
C) 1993
D) 2517
Question
Use the following table to answer questions
-How many respondents are NOT afraid to walk alone at night?
A) 719
B) 1274
C) 1993
D) 2517
-How many respondents are NOT afraid to walk alone at night?
A) 719
B) 1274
C) 1993
D) 2517
Question
Question
Question
Question
Question
Question
Question
Question
Question
Question
Use the following frequencies to construct a table including the percent and valid percent.
DOES R OWN OR RENT HOME?
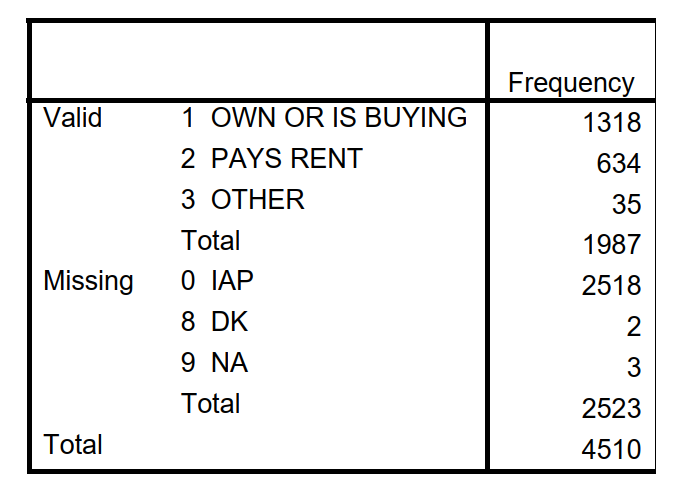
DOES R OWN OR RENT HOME?
Question
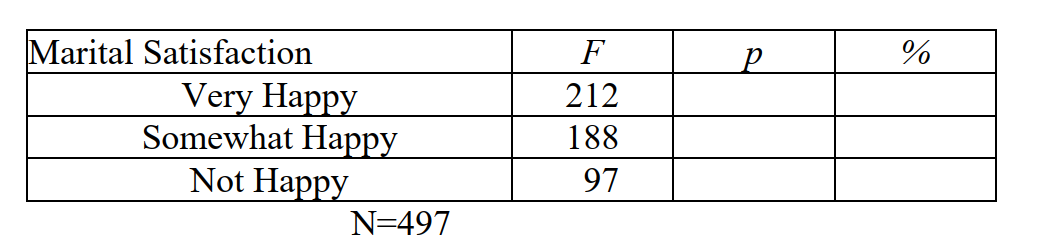
Fill in the empty cells in the following table:

Unlock Deck
Sign up to unlock the cards in this deck!
Unlock Deck
Unlock Deck
1/32
Play
Full screen (f)
Deck 2: Frequency Tables
1
Which of the following is an example of individual data?
A) a sample of high school students
B) the number of families in a city
C) the number of statistics courses at your university
D) a sample of businesses
A) a sample of high school students
B) the number of families in a city
C) the number of statistics courses at your university
D) a sample of businesses
a sample of high school students
2
Which of the following is an example of ecological data?
A) a sample of high school students
B) the number of families in a city
C) a survey of your classmates
D) a sample of construction workers
A) a sample of high school students
B) the number of families in a city
C) a survey of your classmates
D) a sample of construction workers
the number of families in a city
3
Suppose there are 40 Republicans and 35 Democrats in a room. What is the ratio of Republicans to Democrats?
A) 0.88
B) 1.14
C) 1.76
D) 2.28
A) 0.88
B) 1.14
C) 1.76
D) 2.28
1.14
4
Suppose there are 40 Republicans and 35 Democrats in a room. What is the probability of randomly selecting a Democrat from this room?
A) .88
B) 1.14
C) .47
D) .53
A) .88
B) 1.14
C) .47
D) .53
Unlock Deck
Unlock for access to all 32 flashcards in this deck.
Unlock Deck
k this deck
5
Drawing one card at random from a standard deck of 52 cards, what is the probability of drawing an ace (there are 4 aces in a deck)?
A) .08
B) .15
C) 1
D) 13
A) .08
B) .15
C) 1
D) 13
Unlock Deck
Unlock for access to all 32 flashcards in this deck.
Unlock Deck
k this deck
6
Suppose the proportion of males attending your college is .487. What percent of students are male?
A) .487
B) .513
C) 48.7
D) 51.3
A) .487
B) .513
C) 48.7
D) 51.3
Unlock Deck
Unlock for access to all 32 flashcards in this deck.
Unlock Deck
k this deck
7
Suppose the proportion of males attending your college is .487. What percent of students are female?
A) .487
B) .513
C) 48.7
D) 51.3
A) .487
B) .513
C) 48.7
D) 51.3
Unlock Deck
Unlock for access to all 32 flashcards in this deck.
Unlock Deck
k this deck
8
In the 2006 GSS, 2,966 individuals reported their belief in the existence of God. Sixty- six respondents said they did not believe in God. What proportion did not believe?
A) .02
B) .2
C) 2
D) 2966
A) .02
B) .2
C) 2
D) 2966
Unlock Deck
Unlock for access to all 32 flashcards in this deck.
Unlock Deck
k this deck
9
Use the following table to answer questions:
-How many individuals reported being "Not Too Happy" with their marriage?
A) 2.6
B) 37
C) 512
D) 861
-How many individuals reported being "Not Too Happy" with their marriage?
A) 2.6
B) 37
C) 512
D) 861
Unlock Deck
Unlock for access to all 32 flashcards in this deck.
Unlock Deck
k this deck
10
Use the following table to answer questions:
-Which of the following is a value label?
A) very happy
B) frequency
C) percent
D) valid percent
-Which of the following is a value label?
A) very happy
B) frequency
C) percent
D) valid percent
Unlock Deck
Unlock for access to all 32 flashcards in this deck.
Unlock Deck
k this deck
11
Use the following table to answer questions:
-What percentage of respondents reported being "Pretty Happy"?
A) 2.6
B) 36.3
C) 61.1
D) 97.4
-What percentage of respondents reported being "Pretty Happy"?
A) 2.6
B) 36.3
C) 61.1
D) 97.4
Unlock Deck
Unlock for access to all 32 flashcards in this deck.
Unlock Deck
k this deck
12
Use the following table to answer questions:
-What percentage of respondents reported feeling "Pretty Happy" or better?
A) 2.6
B) 36.3
C) 61.1
D) 97.4
-What percentage of respondents reported feeling "Pretty Happy" or better?
A) 2.6
B) 36.3
C) 61.1
D) 97.4
Unlock Deck
Unlock for access to all 32 flashcards in this deck.
Unlock Deck
k this deck
13
Use the following table to answer questions:
-How many respondents reported feeling "Pretty Happy" or better with their marriage?
A) 61.1
B) 512
C) 861
D) 1373
-How many respondents reported feeling "Pretty Happy" or better with their marriage?
A) 61.1
B) 512
C) 861
D) 1373
Unlock Deck
Unlock for access to all 32 flashcards in this deck.
Unlock Deck
k this deck
14
Use the following table to answer questions:
-What is the value of N?
A) 861
B) 1373
C) 1410
D) 100%
-What is the value of N?
A) 861
B) 1373
C) 1410
D) 100%
Unlock Deck
Unlock for access to all 32 flashcards in this deck.
Unlock Deck
k this deck
15
Use the following table to answer questions
-What is the total number of missing cases?
A) 1993
B) 2507
C) 2517
D) 4510
-What is the total number of missing cases?
A) 1993
B) 2507
C) 2517
D) 4510
Unlock Deck
Unlock for access to all 32 flashcards in this deck.
Unlock Deck
k this deck
16
Use the following table to answer questions
-What is the total number of valid cases?
A) 719
B) 1993
C) 2517
D) 4510
-What is the total number of valid cases?
A) 719
B) 1993
C) 2517
D) 4510
Unlock Deck
Unlock for access to all 32 flashcards in this deck.
Unlock Deck
k this deck
17
Use the following table to answer questions
-What proportion of respondents are afraid to walk alone at night?
A) .282
B) .361
C) .639
D) 15.9
-What proportion of respondents are afraid to walk alone at night?
A) .282
B) .361
C) .639
D) 15.9
Unlock Deck
Unlock for access to all 32 flashcards in this deck.
Unlock Deck
k this deck
18
Use the following table to answer questions
-What percent of respondents are NOT afraid to walk alone at night?
A) .639
B) 36.1
C) 63.9
D) 1274
-What percent of respondents are NOT afraid to walk alone at night?
A) .639
B) 36.1
C) 63.9
D) 1274
Unlock Deck
Unlock for access to all 32 flashcards in this deck.
Unlock Deck
k this deck
19
Use the following table to answer questions
-What percent of cases are not valid (missing)?
A) 36.1
B) 55.8
C) 63.9
D) 100
-What percent of cases are not valid (missing)?
A) 36.1
B) 55.8
C) 63.9
D) 100
Unlock Deck
Unlock for access to all 32 flashcards in this deck.
Unlock Deck
k this deck
20
Use the following table to answer questions
-How many respondents are afraid to walk alone at night?
A) 719
B) 1274
C) 1993
D) 2517
-How many respondents are afraid to walk alone at night?
A) 719
B) 1274
C) 1993
D) 2517
Unlock Deck
Unlock for access to all 32 flashcards in this deck.
Unlock Deck
k this deck
21
Use the following table to answer questions
-How many respondents are NOT afraid to walk alone at night?
A) 719
B) 1274
C) 1993
D) 2517
-How many respondents are NOT afraid to walk alone at night?
A) 719
B) 1274
C) 1993
D) 2517
Unlock Deck
Unlock for access to all 32 flashcards in this deck.
Unlock Deck
k this deck
22
If we want to know the ratio of Democrats to Republicans, we put the frequency of Democrats in the denominator.
Unlock Deck
Unlock for access to all 32 flashcards in this deck.
Unlock Deck
k this deck
23
Proportions range from 0 to 100.
Unlock Deck
Unlock for access to all 32 flashcards in this deck.
Unlock Deck
k this deck
24
Percent columns are based on the total number of cases in the data while valid percent columns are based on only the cases that provided data for the variable.
Unlock Deck
Unlock for access to all 32 flashcards in this deck.
Unlock Deck
k this deck
25
It is common practice to include missing cases in analyses.
Unlock Deck
Unlock for access to all 32 flashcards in this deck.
Unlock Deck
k this deck
26
A business has 24 male and 16 female employees. The ratio of females to males is 1.5.
Unlock Deck
Unlock for access to all 32 flashcards in this deck.
Unlock Deck
k this deck
27
If a business has 24 male and 16 female employees, 40% of the employees are female.
Unlock Deck
Unlock for access to all 32 flashcards in this deck.
Unlock Deck
k this deck
28
Explain why proportions and percentages are important.
Unlock Deck
Unlock for access to all 32 flashcards in this deck.
Unlock Deck
k this deck
29
Construct a frequency table using the following ages: 30, 30, 30, 33, 33, 34, 37, 37, 37, 37, 37, 40, 40, 45, 45, 45, 45, 45
Unlock Deck
Unlock for access to all 32 flashcards in this deck.
Unlock Deck
k this deck
30
Explain the difference between percent and valid percent. Why is this difference important?
Unlock Deck
Unlock for access to all 32 flashcards in this deck.
Unlock Deck
k this deck
31
Use the following frequencies to construct a table including the percent and valid percent.
DOES R OWN OR RENT HOME?
DOES R OWN OR RENT HOME?
Unlock Deck
Unlock for access to all 32 flashcards in this deck.
Unlock Deck
k this deck
32
Fill in the empty cells in the following table:
Unlock Deck
Unlock for access to all 32 flashcards in this deck.
Unlock Deck
k this deck
Unlock Deck
Unlock for access to all 32 flashcards in this deck.


