Exam 2: Frequency Tables
Exam 1: Concepts, Variables, and Measurement37 Questions
Exam 2: Frequency Tables32 Questions
Exam 3: Measures of Central Tendency39 Questions
Exam 4: Measures of Dispersion29 Questions
Exam 5: Probability and the Normal Curve29 Questions
Exam 6: Probabilityfrom Samples to Statistics31 Questions
Exam 7: Cross-Tabulation Tables and Chi-Square27 Questions
Exam 8: Measures of Association for Categorical Variables37 Questions
Exam 9: Analysis of Variance27 Questions
Exam 10: Correlation and Regression28 Questions
Select questions type
Suppose the proportion of males attending your college is .487. What percent of students are male?
Free
(Multiple Choice)
4.9/5  (36)
(36)
Correct Answer: Verified
C
Use the following table to answer questions
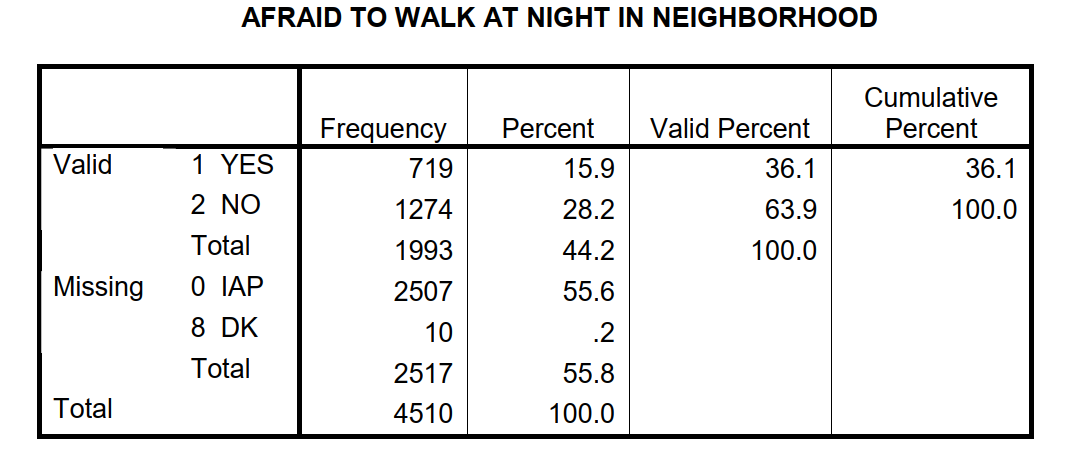 -How many respondents are afraid to walk alone at night?
Free
(Multiple Choice)
4.8/5 (39)
Correct Answer:Verified
A
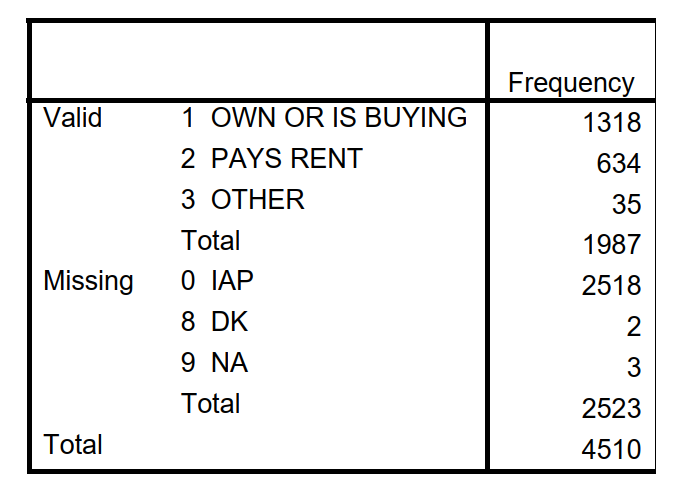
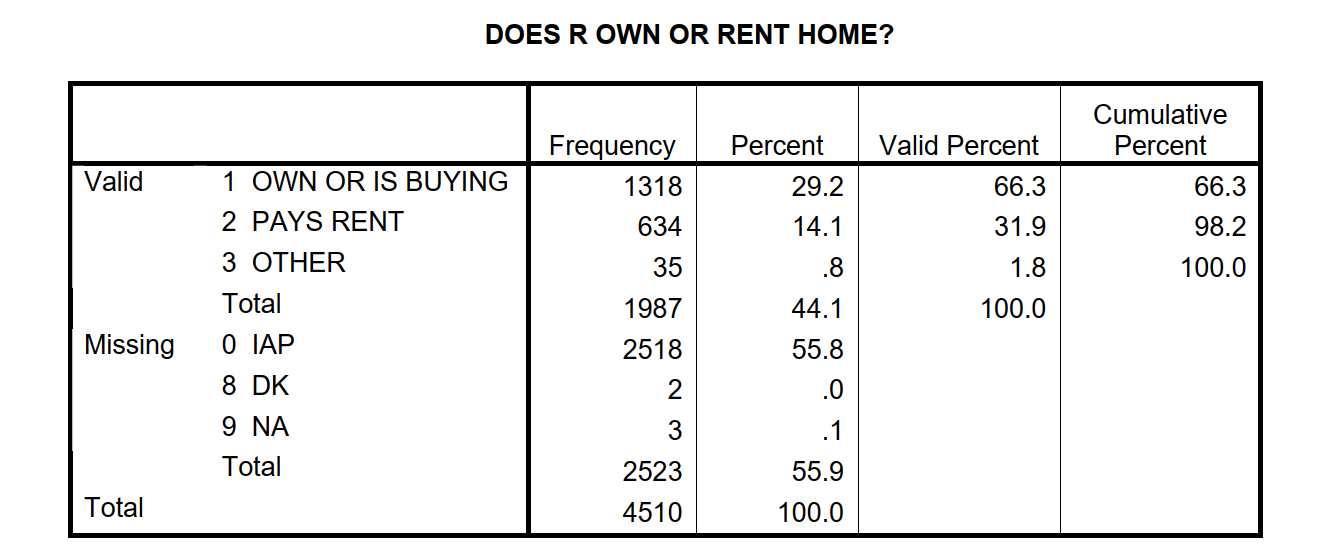
Use the following frequencies to construct a table including the percent and valid percent.
DOES R OWN OR RENT HOME?
Free
(Essay)
4.8/5 (36)
Correct Answer:Verified
Use the following table to answer questions:
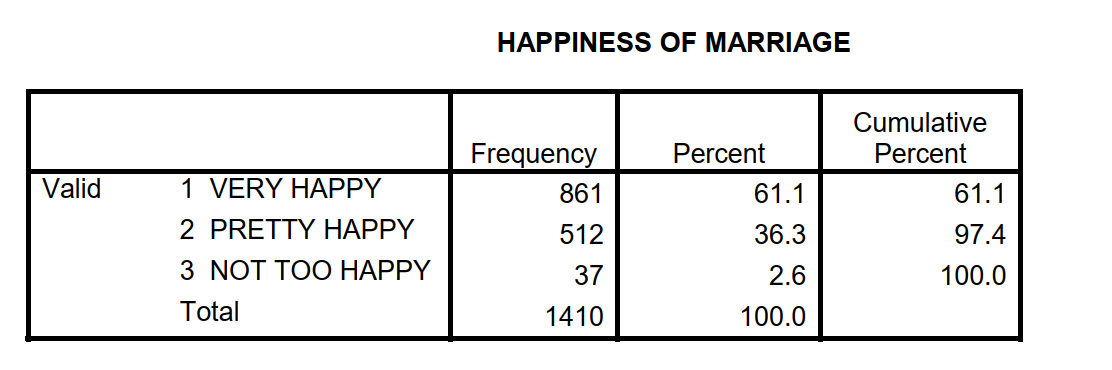 -How many individuals reported being "Not Too Happy" with their marriage?
(Multiple Choice)
4.9/5 (31)
Use the following table to answer questions
-What percent of respondents are NOT afraid to walk alone at night?
(Multiple Choice)
4.7/5 (31)
Use the following table to answer questions:
-How many respondents reported feeling "Pretty Happy" or better with their marriage?
(Multiple Choice)
4.8/5 (38)
Construct a frequency table using the following ages: 30, 30, 30, 33, 33, 34, 37, 37, 37, 37, 37, 40, 40, 45, 45, 45, 45, 45
(Essay)
4.9/5 (32)
Use the following table to answer questions
-What proportion of respondents are afraid to walk alone at night?
(Multiple Choice)
4.8/5 (34)
Explain the difference between percent and valid percent. Why is this difference important?
(Essay)
4.8/5 (33)
Use the following table to answer questions
-What percent of cases are not valid (missing)?
(Multiple Choice)
5.0/5 (38)
Use the following table to answer questions
-What is the total number of missing cases?
(Multiple Choice)
4.8/5 (30)
Suppose there are 40 Republicans and 35 Democrats in a room. What is the probability of randomly selecting a Democrat from this room?
(Multiple Choice)
4.9/5 (29)
In the 2006 GSS, 2,966 individuals reported their belief in the existence of God. Sixty- six respondents said they did not believe in God. What proportion did not believe?
(Multiple Choice)
4.9/5 (43)
If we want to know the ratio of Democrats to Republicans, we put the frequency of Democrats in the denominator.
(True/False)
4.8/5 (36)
Filters
- Essay(0)
- Multiple Choice(0)
- Short Answer(0)
- True False(0)
- Matching(0)