Deck 4: Demand and Behavior in Markets
Full screen (f)
Question
Question
Question
Question
Question
Question
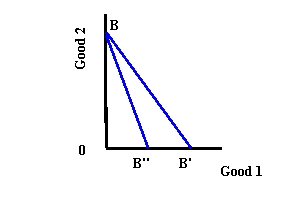
Refer to Exhibit 4-3. The budget line rotates from BB' to BB" because the price of good 1
A) increases
B) decreases
C) remains constant
Question
Question
Question
Question
Question
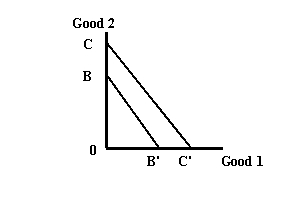
Refer to Exhibit 4-1. A shift from budget line BB' to CC' means that the consumer has
A) equal income
B) more income
C) less income
Question
Question
Question
Question
Question
Question
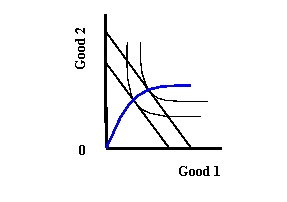
Refer to Exhibit 4-2. This income expansion path depicts a(n)
A) superior good
B) normal good
C) inferior good
Question
Question
Refer to Exhibit 4-3. The budget line rotates from BB" to BB' because the price of good 1
A) increases
B) decreases
C) remains constant
Question
Question
Question
Question
Question
Question
Question
Question
Question
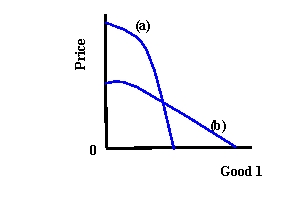
Refer to Exhibit 4-4. Which curve represents the compensated demand function?
A) (a)
B) (b)
C) There is not enough information to give an answer.
Question
Question
Question
Question
Question
Refer to Exhibit 4-4. Which curve represents the uncompensated demand function?
A) (a)
B) (b)
C) There is not enough information to give an answer.
Question
Question
Question
Question
Question
Question
Question

Unlock Deck
Sign up to unlock the cards in this deck!
Unlock Deck
Unlock Deck
1/40
Play
Full screen (f)
Deck 4: Demand and Behavior in Markets
1
The impact of an income-induced change in demand caused by a change in price is called the income effect.
True
2
Homothetic preferences imply that consumers will increase the purchases of goods proportionately as their incomes increase and prices stay constant.
True
3
The ratio that tells how much a consumer in a market would have to forgo of one good in order to receive units of another good is called relative prices.
True
4
An inferior good is a good for which demand decreases as the income of the consumer increases and the relative prices remain constant.
Unlock Deck
Unlock for access to all 40 flashcards in this deck.
Unlock Deck
k this deck
5
Markets in which the identity of the traders and their size in the market do not affect the price at which they trade are called
A) monopolistically competitive markets
B) personalized markets
C) impersonal markets
A) monopolistically competitive markets
B) personalized markets
C) impersonal markets
Unlock Deck
Unlock for access to all 40 flashcards in this deck.
Unlock Deck
k this deck
6
Refer to Exhibit 4-3. The budget line rotates from BB' to BB" because the price of good 1
A) increases
B) decreases
C) remains constant
Unlock Deck
Unlock for access to all 40 flashcards in this deck.
Unlock Deck
k this deck
7
The price-consumption path is the curve
A) representing how consumption will vary when one price changes but all other prices and the consumer's income remain constant
B) connecting optimal consumption bundles that shows how a consumer changes the quantity demanded of specified goods as income changes and prices remain constant
C) that represents the relationship between the quantity of good demanded by a consumer and the price of that good as the price varies
Unlock Deck
Unlock for access to all 40 flashcards in this deck.
Unlock Deck
k this deck
8
The primary difference between compensated and uncompensated demand functions is the presence or absence of the income effect that results from price changes.
Unlock Deck
Unlock for access to all 40 flashcards in this deck.
Unlock Deck
k this deck
9
A price-consumption path is drawn by connecting the
A) various veritcal intercepts of the rotated budget lines
B) various horizontal intercepts of the rotated budget lines
C) points of tangencies between indifference curves and rotated budget lines
A) various veritcal intercepts of the rotated budget lines
B) various horizontal intercepts of the rotated budget lines
C) points of tangencies between indifference curves and rotated budget lines
Unlock Deck
Unlock for access to all 40 flashcards in this deck.
Unlock Deck
k this deck
10
The quantity of a good that people seek to sell at a given price is the quantity demanded.
Unlock Deck
Unlock for access to all 40 flashcards in this deck.
Unlock Deck
k this deck
11
Refer to Exhibit 4-1. A shift from budget line BB' to CC' means that the consumer has
A) equal income
B) more income
C) less income
Unlock Deck
Unlock for access to all 40 flashcards in this deck.
Unlock Deck
k this deck
12
A normal is a good whose demand curve is downward sloping.
Unlock Deck
Unlock for access to all 40 flashcards in this deck.
Unlock Deck
k this deck
13
When the price of a good increases, the substitution effect must lead the agent to consume more.
Unlock Deck
Unlock for access to all 40 flashcards in this deck.
Unlock Deck
k this deck
14
A good for which demand increases as the income of the consumer increases and the relative prices remain constant is called a(n)
A) superior good
B) inferior good
C) normal good
A) superior good
B) inferior good
C) normal good
Unlock Deck
Unlock for access to all 40 flashcards in this deck.
Unlock Deck
k this deck
15
The path connecting optimal consumption bundles that shows how a consumer changes the quantity demanded of specified goods as income changes and prices remain constant is called the
A) price-consumption path
B) nonsatiation-convexity path
C) income expansion path
A) price-consumption path
B) nonsatiation-convexity path
C) income expansion path
Unlock Deck
Unlock for access to all 40 flashcards in this deck.
Unlock Deck
k this deck
16
A demand curve represents graphically the relationship between the quantity of a good demanded by a consumer and the price of that good as the price varies.
Unlock Deck
Unlock for access to all 40 flashcards in this deck.
Unlock Deck
k this deck
17
Refer to Exhibit 4-2. This income expansion path depicts a(n)
A) superior good
B) normal good
C) inferior good
Unlock Deck
Unlock for access to all 40 flashcards in this deck.
Unlock Deck
k this deck
18
When markets are large and competitive, the consumer merely chooses the bundle of goods that provides the most utility given
A) income and tastes only
B) income, tastes, and the prices prevailing in the market
C) the prices prevailing in the market only
A) income and tastes only
B) income, tastes, and the prices prevailing in the market
C) the prices prevailing in the market only
Unlock Deck
Unlock for access to all 40 flashcards in this deck.
Unlock Deck
k this deck
19
Refer to Exhibit 4-3. The budget line rotates from BB" to BB' because the price of good 1
A) increases
B) decreases
C) remains constant
Unlock Deck
Unlock for access to all 40 flashcards in this deck.
Unlock Deck
k this deck
20
A compensated demand function represents the relationship between the price of a good and the quantity demanded, which includes both the substitution and income effects of price changes.
Unlock Deck
Unlock for access to all 40 flashcards in this deck.
Unlock Deck
k this deck
21
A Giffen good is a good whose demand curve
A) is upward sloping
B) is downward sloping
C) jumps from one point on the quantity axis to another, leaving a gap
A) is upward sloping
B) is downward sloping
C) jumps from one point on the quantity axis to another, leaving a gap
Unlock Deck
Unlock for access to all 40 flashcards in this deck.
Unlock Deck
k this deck
22
How is the price-consumption path derived?
Unlock Deck
Unlock for access to all 40 flashcards in this deck.
Unlock Deck
k this deck
23
Describe how prices are set in impersonal markets.
Unlock Deck
Unlock for access to all 40 flashcards in this deck.
Unlock Deck
k this deck
24
Will the income effect always cause an increase in the quantity demanded?
Unlock Deck
Unlock for access to all 40 flashcards in this deck.
Unlock Deck
k this deck
25
The substitution effect is the
A) change in demand that results from an attempt to substitute a good whose price has decreased for another good whose price remained constant after having nullified the implicit change in income
B) good for which demand decreases as the income of the consumer increases and the relative prices remain constant
C) impact of an income-induced change in demand caused by a change in price
Unlock Deck
Unlock for access to all 40 flashcards in this deck.
Unlock Deck
k this deck
26
On the horizontal axis of a demand curve graph, the variable measured is the
A) consumer's income
B) quantity demanded of the good
C) price of the good
A) consumer's income
B) quantity demanded of the good
C) price of the good
Unlock Deck
Unlock for access to all 40 flashcards in this deck.
Unlock Deck
k this deck
27
Demand curves are generated by the
A) utility-maximizing behavior of agents
B) income-maximizing behavior of agents
C) nonconvexity behavior of agents
A) utility-maximizing behavior of agents
B) income-maximizing behavior of agents
C) nonconvexity behavior of agents
Unlock Deck
Unlock for access to all 40 flashcards in this deck.
Unlock Deck
k this deck
28
Refer to Exhibit 4-4. Which curve represents the compensated demand function?
A) (a)
B) (b)
C) There is not enough information to give an answer.
Unlock Deck
Unlock for access to all 40 flashcards in this deck.
Unlock Deck
k this deck
29
What happens to the substitution and income effects to cause a normal good to have a downward-sloping demand curve?
Unlock Deck
Unlock for access to all 40 flashcards in this deck.
Unlock Deck
k this deck
30
A normal good is a good whose demand curve
A) is upward sloping
B) is downward sloping
C) jumps from one point on the quantity axis to another, leaving a gap
A) is upward sloping
B) is downward sloping
C) jumps from one point on the quantity axis to another, leaving a gap
Unlock Deck
Unlock for access to all 40 flashcards in this deck.
Unlock Deck
k this deck
31
Is the typical demand curve used in microeconomics compensated or uncompensated?
Unlock Deck
Unlock for access to all 40 flashcards in this deck.
Unlock Deck
k this deck
32
If a price decrease causes income and substitution effects that work in opposite directions, but the quantity demanded nevertheless increases, the good must be a
A) normal good
B) superior good
C) Giffen good
A) normal good
B) superior good
C) Giffen good
Unlock Deck
Unlock for access to all 40 flashcards in this deck.
Unlock Deck
k this deck
33
Refer to Exhibit 4-4. Which curve represents the uncompensated demand function?
A) (a)
B) (b)
C) There is not enough information to give an answer.
Unlock Deck
Unlock for access to all 40 flashcards in this deck.
Unlock Deck
k this deck
34
If a demand curve has flat segments, the agent most likely has
A) convex preferences
B) nonconvex preferences
C) nonstrictly convex preferences
A) convex preferences
B) nonconvex preferences
C) nonstrictly convex preferences
Unlock Deck
Unlock for access to all 40 flashcards in this deck.
Unlock Deck
k this deck
35
The income effect is the
A) change in demand that results from an attempt to substitute a good whose price has decreased for another good whose price remained constant after having nullified the implicit change in income
B) good for which demand decreases as the income of the consumer increases and the relative prices remain constant
C) impact of an income-induced change in demand caused by a change in price
Unlock Deck
Unlock for access to all 40 flashcards in this deck.
Unlock Deck
k this deck
36
Every point on a demand curve is also a point on a(n)
A) income expansion path
B) indifference map
C) price-consumption path
A) income expansion path
B) indifference map
C) price-consumption path
Unlock Deck
Unlock for access to all 40 flashcards in this deck.
Unlock Deck
k this deck
37
A demand curve represents graphically the relationship between the quantity of a good demanded by a consumer and the
A) income of the consumer
B) utility of the consumer
C) price of the good as the price varies
A) income of the consumer
B) utility of the consumer
C) price of the good as the price varies
Unlock Deck
Unlock for access to all 40 flashcards in this deck.
Unlock Deck
k this deck
38
The substitution effect must always be ___________ in direction to the effect of a price change.
A) identical
B) independent
C) opposite
A) identical
B) independent
C) opposite
Unlock Deck
Unlock for access to all 40 flashcards in this deck.
Unlock Deck
k this deck
39
On the vertical axis of a demand curve graph, the variable measured is the
A) consumer's income
B) quantity demanded of the good
C) price of the good
A) consumer's income
B) quantity demanded of the good
C) price of the good
Unlock Deck
Unlock for access to all 40 flashcards in this deck.
Unlock Deck
k this deck
40
If the optimal consumption bundle occurs at the corner of the feasible set, the agent most likely has
A) convex preferences
B) nonconvex preferences
C) nonstrictly convex preferences
A) convex preferences
B) nonconvex preferences
C) nonstrictly convex preferences
Unlock Deck
Unlock for access to all 40 flashcards in this deck.
Unlock Deck
k this deck
Unlock Deck
Unlock for access to all 40 flashcards in this deck.


