Deck 14: Linear Correlation and Simple Linear Regression Analysis
Full screen (f)
Question
Question
Question
Question
Question
Question
Question
Question
Question
Question
Question
Question
Question
Question
Question
Question
Question
Question
Question
Question
Question
From the following scatter plot, we can say that between Y and X there is ___. 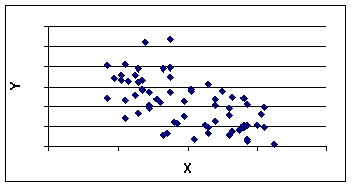
A) perfect positive correlation
B) virtually no correlation
C) positive correlation
D) negative correlation
E) perfect negative correlation
A) perfect positive correlation
B) virtually no correlation
C) positive correlation
D) negative correlation
E) perfect negative correlation
Question
Question
Question
From the following scatter plot, we can say that between Y and X there is ___. 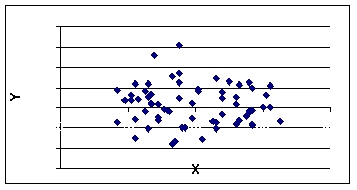
A) perfect positive correlation
B) virtually no correlation
C) positive correlation
D) negative correlation
E) perfect negative correlation
A) perfect positive correlation
B) virtually no correlation
C) positive correlation
D) negative correlation
E) perfect negative correlation
Question
Question
Question
According to the following graphic, X and Y have ___. 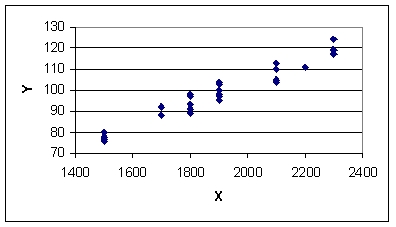
A) strong negative correlation
B) virtually no correlation
C) strong positive correlation
D) moderate negative correlation
E) weak negative correlation
A) strong negative correlation
B) virtually no correlation
C) strong positive correlation
D) moderate negative correlation
E) weak negative correlation
Question
Question
Question
Question
According to the following graphic, X and Y have ___. 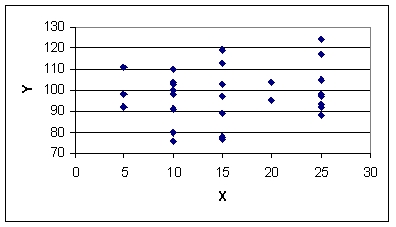
A) strong negative correlation
B) virtually no correlation
C) strong positive correlation
D) moderate negative correlation
E) weak negative correlation
A) strong negative correlation
B) virtually no correlation
C) strong positive correlation
D) moderate negative correlation
E) weak negative correlation
Question
Question
Question
Question
Question
Question
Question
Question
From the following scatter plot, we can say that between Y and X there is ___. 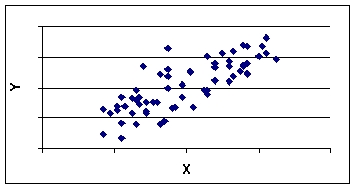
A) perfect positive correlation
B) virtually no correlation
C) positive correlation
D) negative correlation
E) perfect negative correlation
A) perfect positive correlation
B) virtually no correlation
C) positive correlation
D) negative correlation
E) perfect negative correlation
Question
Question
Question
Question
Question
Consider the following scatter plot and regression line. At x = 50, the residual (error term) is ___.
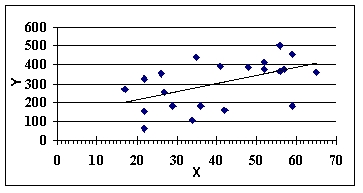
A) positive
B) zero
C) negative
D) imaginary
E) unknown
A) positive
B) zero
C) negative
D) imaginary
E) unknown
Question
Question
Question
The following data is to be used to construct a regression model:  The value of the intercept is ___.
A) 16.49
B) 1.19
C) 1.43
D) 0.75
E) 1.30
The value of the intercept is ___.A) 16.49
B) 1.19
C) 1.43
D) 0.75
E) 1.30
Question
Question
For the following scatter plot and regression line, at x = 35 the residual is ___.
A) positive
B) zero
C) negative
D) imaginary
E) unknown
A) positive
B) zero
C) negative
D) imaginary
E) unknown
Question
Question
Question
The following data is to be used to construct a regression model:  The regression equation is ___.
A) y = 16.49 + 1.43x
B) y = 1.19 + 0.91x
C) y = 1.19 + 0.75x
D) y = 0.75 + 0.18x
E) y = 0.91 + 4.06x
The regression equation is ___.A) y = 16.49 + 1.43x
B) y = 1.19 + 0.91x
C) y = 1.19 + 0.75x
D) y = 0.75 + 0.18x
E) y = 0.91 + 4.06x
Question
Question
Question
Question
Question
Question
Question
The following data is to be used to construct a regression model:  The value of the slope is ___.
A) 16.49
B) 1.19
C) 1.43
D) 0.75
E) 1.30
The value of the slope is ___.A) 16.49
B) 1.19
C) 1.43
D) 0.75
E) 1.30
Question
Question
Question
The following residuals plot indicates ___. 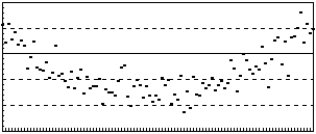
A) a nonlinear relation
B) a nonconstant error variance
C) the simple regression assumptions are met
D) the sample is biased
E) a random sample
A) a nonlinear relation
B) a nonconstant error variance
C) the simple regression assumptions are met
D) the sample is biased
E) a random sample
Question
Question
Question
Question
Question
Question
Question
Question
Question
Question
Question
Question
Question
Question
Question
Question
Question
The following residuals plot indicates ___. 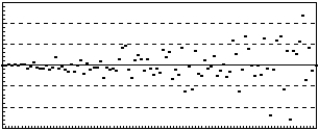
A) a nonlinear relation
B) a nonconstant error variance
C) the simple regression assumptions are met
D) the sample is biased
E) the sample is random
A) a nonlinear relation
B) a nonconstant error variance
C) the simple regression assumptions are met
D) the sample is biased
E) the sample is random
Question

Unlock Deck
Sign up to unlock the cards in this deck!
Unlock Deck
Unlock Deck
1/110
Play
Full screen (f)
Deck 14: Linear Correlation and Simple Linear Regression Analysis
1
In simple regression analysis the error terms are assumed to be independent and normally distributed with zero mean and constant variance.
True
2
One of the major uses of residual analysis is to test some of the assumptions underlying regression.
True
3
For the regression line, y = 21 − 5x, 21 is the y-intercept of the line.
True
4
The process of constructing a mathematical model or function that can be used to predict or determine one variable by another variable is called regression analysis.
Unlock Deck
Unlock for access to all 110 flashcards in this deck.
Unlock Deck
k this deck
5
In regression, the predictor variable is called the dependent variable.
Unlock Deck
Unlock for access to all 110 flashcards in this deck.
Unlock Deck
k this deck
6
The difference between the actual y value and the predicted y value found using a regression equation is called the residual.
Unlock Deck
Unlock for access to all 110 flashcards in this deck.
Unlock Deck
k this deck
7
The coefficient of determination is the proportion of variability of the dependent variable (y) accounted for or explained by the independent variable (x).
Unlock Deck
Unlock for access to all 110 flashcards in this deck.
Unlock Deck
k this deck
8
The proportion of variability of the dependent variable (y) accounted for or explained by the independent variable (x) is called the coefficient of correlation.
Unlock Deck
Unlock for access to all 110 flashcards in this deck.
Unlock Deck
k this deck
9
Correlation is a measure of the degree of linear relationship between two variables.
Unlock Deck
Unlock for access to all 110 flashcards in this deck.
Unlock Deck
k this deck
10
Data points that lie apart from the rest of the points are called deviants.
Unlock Deck
Unlock for access to all 110 flashcards in this deck.
Unlock Deck
k this deck
11
In a simple regression the coefficient of correlation is the square root of the coefficient of determination.
Unlock Deck
Unlock for access to all 110 flashcards in this deck.
Unlock Deck
k this deck
12
The slope of the regression line, y = 21 − 5x, is 5.
Unlock Deck
Unlock for access to all 110 flashcards in this deck.
Unlock Deck
k this deck
13
The strength of a linear relationship in simple linear regression change if the units of the data are converted, say from feet to inches.
Unlock Deck
Unlock for access to all 110 flashcards in this deck.
Unlock Deck
k this deck
14
If the correlation coefficient between two variables is -1, it means that the two variables are related.
Unlock Deck
Unlock for access to all 110 flashcards in this deck.
Unlock Deck
k this deck
15
In regression, the variable that is being predicted is usually referred to as the independent variable.
Unlock Deck
Unlock for access to all 110 flashcards in this deck.
Unlock Deck
k this deck
16
One of the assumptions of simple regression analysis is that the error terms are exponentially distributed
Unlock Deck
Unlock for access to all 110 flashcards in this deck.
Unlock Deck
k this deck
17
The slope of the regression line, y = 21 − 5x, is 21.
Unlock Deck
Unlock for access to all 110 flashcards in this deck.
Unlock Deck
k this deck
18
In the simple regression model, y = 21 − 5x, if the coefficient of determination is 0.81, we can say that the coefficient of correlation between y and x is 0.90.
Unlock Deck
Unlock for access to all 110 flashcards in this deck.
Unlock Deck
k this deck
19
The first step in simple regression analysis usually is to construct a scatter plot.
Unlock Deck
Unlock for access to all 110 flashcards in this deck.
Unlock Deck
k this deck
20
The range of admissible values for the coefficient of determination is −1 to +1.
Unlock Deck
Unlock for access to all 110 flashcards in this deck.
Unlock Deck
k this deck
21
From the following scatter plot, we can say that between Y and X there is ___.
A) perfect positive correlation
B) virtually no correlation
C) positive correlation
D) negative correlation
E) perfect negative correlation
A) perfect positive correlation
B) virtually no correlation
C) positive correlation
D) negative correlation
E) perfect negative correlation
Unlock Deck
Unlock for access to all 110 flashcards in this deck.
Unlock Deck
k this deck
22
The numerical value of the coefficient of determination must be ___.
A) between -1 and +1
B) between -1 and 0
C) between 0 and 1
D) equal to SSE/(n - 2)
E) between -100 and +100
A) between -1 and +1
B) between -1 and 0
C) between 0 and 1
D) equal to SSE/(n - 2)
E) between -100 and +100
Unlock Deck
Unlock for access to all 110 flashcards in this deck.
Unlock Deck
k this deck
23
In regression analysis, R-squared is also called the ___.
A) residual
B) coefficient of determination
C) coefficient of correlation
D) standard error of the estimate
E) sum of squares of regression
A) residual
B) coefficient of determination
C) coefficient of correlation
D) standard error of the estimate
E) sum of squares of regression
Unlock Deck
Unlock for access to all 110 flashcards in this deck.
Unlock Deck
k this deck
24
From the following scatter plot, we can say that between Y and X there is ___.
A) perfect positive correlation
B) virtually no correlation
C) positive correlation
D) negative correlation
E) perfect negative correlation
A) perfect positive correlation
B) virtually no correlation
C) positive correlation
D) negative correlation
E) perfect negative correlation
Unlock Deck
Unlock for access to all 110 flashcards in this deck.
Unlock Deck
k this deck
25
The standard error of the estimate, denoted se, is the square root of the sum of the squares of the vertical distances between the actual y values and the predicted values of y.
Unlock Deck
Unlock for access to all 110 flashcards in this deck.
Unlock Deck
k this deck
26
Regression output from Excel software includes an ANOVA table.
Unlock Deck
Unlock for access to all 110 flashcards in this deck.
Unlock Deck
k this deck
27
According to the following graphic, X and Y have ___.
A) strong negative correlation
B) virtually no correlation
C) strong positive correlation
D) moderate negative correlation
E) weak negative correlation
A) strong negative correlation
B) virtually no correlation
C) strong positive correlation
D) moderate negative correlation
E) weak negative correlation
Unlock Deck
Unlock for access to all 110 flashcards in this deck.
Unlock Deck
k this deck
28
Prediction intervals get narrower as we extrapolate outside the range of the data.
Unlock Deck
Unlock for access to all 110 flashcards in this deck.
Unlock Deck
k this deck
29
The variability in the estimated slope is smaller when the x values are more spread out.
Unlock Deck
Unlock for access to all 110 flashcards in this deck.
Unlock Deck
k this deck
30
If there is positive correlation between two sets of numbers, then ___.
A) r = 0
B) r < 0
C) r > 0
D) SSE =1
E) MSE = 1
A) r = 0
B) r < 0
C) r > 0
D) SSE =1
E) MSE = 1
Unlock Deck
Unlock for access to all 110 flashcards in this deck.
Unlock Deck
k this deck
31
According to the following graphic, X and Y have ___.
A) strong negative correlation
B) virtually no correlation
C) strong positive correlation
D) moderate negative correlation
E) weak negative correlation
A) strong negative correlation
B) virtually no correlation
C) strong positive correlation
D) moderate negative correlation
E) weak negative correlation
Unlock Deck
Unlock for access to all 110 flashcards in this deck.
Unlock Deck
k this deck
32
Given x, a 95% prediction interval for a single value of y is always wider than a 95% confidence interval for the average value of y.
Unlock Deck
Unlock for access to all 110 flashcards in this deck.
Unlock Deck
k this deck
33
The numerical value of the coefficient of correlation must be ___.
A) between -1 and +1
B) between -1 and 0
C) between 0 and 1
D) equal to SSE/(n - 2)
E) between 0 and -1
A) between -1 and +1
B) between -1 and 0
C) between 0 and 1
D) equal to SSE/(n - 2)
E) between 0 and -1
Unlock Deck
Unlock for access to all 110 flashcards in this deck.
Unlock Deck
k this deck
34
Regression output from Excel software directly shows the regression equation.
Unlock Deck
Unlock for access to all 110 flashcards in this deck.
Unlock Deck
k this deck
35
If there is perfect negative correlation between two sets of numbers, then ___.
A) r = 0
B) r = -1
C) r = +1
D) SSE =1
E) MSE = 1
A) r = 0
B) r = -1
C) r = +1
D) SSE =1
E) MSE = 1
Unlock Deck
Unlock for access to all 110 flashcards in this deck.
Unlock Deck
k this deck
36
A t test is used to determine whether the coefficients of the regression model are significantly different from zero.
Unlock Deck
Unlock for access to all 110 flashcards in this deck.
Unlock Deck
k this deck
37
If x and y in a regression model are totally unrelated, ___.
A) the correlation coefficient would be -1
B) the coefficient of determination would be 0
C) the coefficient of determination would be 1
D) the SSE would be 0
E) the MSE would be 0s
A) the correlation coefficient would be -1
B) the coefficient of determination would be 0
C) the coefficient of determination would be 1
D) the SSE would be 0
E) the MSE would be 0s
Unlock Deck
Unlock for access to all 110 flashcards in this deck.
Unlock Deck
k this deck
38
Regression methods can be pursued to estimate trends that are linear in time.
Unlock Deck
Unlock for access to all 110 flashcards in this deck.
Unlock Deck
k this deck
39
From the following scatter plot, we can say that between Y and X there is ___.
A) perfect positive correlation
B) virtually no correlation
C) positive correlation
D) negative correlation
E) perfect negative correlation
A) perfect positive correlation
B) virtually no correlation
C) positive correlation
D) negative correlation
E) perfect negative correlation
Unlock Deck
Unlock for access to all 110 flashcards in this deck.
Unlock Deck
k this deck
40
The proportion of variability of the dependent variable accounted for or explained by the independent variable is called the ___.
A) sum of squares error
B) coefficient of correlation
C) coefficient of determination
D) covariance
E) regression sum of squares
A) sum of squares error
B) coefficient of correlation
C) coefficient of determination
D) covariance
E) regression sum of squares
Unlock Deck
Unlock for access to all 110 flashcards in this deck.
Unlock Deck
k this deck
41
If a scatter plot of variables X and Y shows a trend that can be summarized to a large degree by a straight line with slope 0.8 and y-intercept 0.2 (i.e., Y = 0.2 + 0.8X), then the correlation coefficient between X and Y is ___.
A) 0.8, and there is a causal relation between X and Y (either X causes Y or Y causes X)
B) 0.2, and there is a causal relation between X and Y (either X causes Y or Y causes X)
C) 0.8, but there is no causal relation between X and Y
D) 0.2, but there is no causal relation between X and Y
E) 0.8, and there may be a causal relation between X and Y, but not necessarily
Unlock Deck
Unlock for access to all 110 flashcards in this deck.
Unlock Deck
k this deck
42
A quality manager is developing a regression model to predict the total number of defects as a function of the day of week the item is produced. Production runs are done 10 hours a day, 7 days a week. The dependent variable is ___.
A) day of week
B) production run
C) percentage of defects
D) number of defects
E) number of production runs
A) day of week
B) production run
C) percentage of defects
D) number of defects
E) number of production runs
Unlock Deck
Unlock for access to all 110 flashcards in this deck.
Unlock Deck
k this deck
43
If the correlation coefficient between variables X and Y is roughly zero, then ___.
A) Y is independent of X
B) Y is dependent on X
C) there is a linear correlation between Y and X
D) Y is not necessarily independent of X
E) Y is caused by X.
A) Y is independent of X
B) Y is dependent on X
C) there is a linear correlation between Y and X
D) Y is not necessarily independent of X
E) Y is caused by X.
Unlock Deck
Unlock for access to all 110 flashcards in this deck.
Unlock Deck
k this deck
44
Consider the following scatter plot and regression line. At x = 50, the residual (error term) is ___.
A) positive
B) zero
C) negative
D) imaginary
E) unknown
A) positive
B) zero
C) negative
D) imaginary
E) unknown
Unlock Deck
Unlock for access to all 110 flashcards in this deck.
Unlock Deck
k this deck
45
The coefficient of correlation in a simple regression analysis is = -0.6. The coefficient of determination for this regression would be ___.
A) 0.6
B) -0.6 or +0.6
C) 0.13
D) -0.36
E) 0.36
A) 0.6
B) -0.6 or +0.6
C) 0.13
D) -0.36
E) 0.36
Unlock Deck
Unlock for access to all 110 flashcards in this deck.
Unlock Deck
k this deck
46
A cost accountant is developing a regression model to predict the total cost of producing a batch of printed circuit boards as a linear function of batch size (the number of boards produced in one lot or batch). The intercept of this model is the ___.
A) batch size
B) unit variable cost
C) fixed cost
D) total cost
E) total variable cost
A) batch size
B) unit variable cost
C) fixed cost
D) total cost
E) total variable cost
Unlock Deck
Unlock for access to all 110 flashcards in this deck.
Unlock Deck
k this deck
47
The following data is to be used to construct a regression model: The value of the intercept is ___.
A) 16.49
B) 1.19
C) 1.43
D) 0.75
E) 1.30
The value of the intercept is ___.A) 16.49
B) 1.19
C) 1.43
D) 0.75
E) 1.30
Unlock Deck
Unlock for access to all 110 flashcards in this deck.
Unlock Deck
k this deck
48
Given a set of paired data, {X, Y}, if Y is independent of X, you would expect that the correlation coefficient is ___.
A) negative
B) zero
C) positive
D) any value between −1.0 and 1.0
E) any value between −0.5 and 0.5
A) negative
B) zero
C) positive
D) any value between −1.0 and 1.0
E) any value between −0.5 and 0.5
Unlock Deck
Unlock for access to all 110 flashcards in this deck.
Unlock Deck
k this deck
49
For the following scatter plot and regression line, at x = 35 the residual is ___.
A) positive
B) zero
C) negative
D) imaginary
E) unknown
A) positive
B) zero
C) negative
D) imaginary
E) unknown
Unlock Deck
Unlock for access to all 110 flashcards in this deck.
Unlock Deck
k this deck
50
In the regression equation, y = 54.78 + 1.45x, the x-intercept is ___.
A) 1.45
B) −1.45
C) 54.78
D) −54.78
E) −37.8
A) 1.45
B) −1.45
C) 54.78
D) −54.78
E) −37.8
Unlock Deck
Unlock for access to all 110 flashcards in this deck.
Unlock Deck
k this deck
51
A regression line minimizes the sum of the squared error values. This means that the regression line minimizes the sum of ___ from each point in the scatter point to the regression line.
A) the squares of the distances
B) the squares of the horizontal distances (differences in the x-coordinates)
C) the squares of the vertical distances (differences in the x-coordinates)
D) the squares of the horizontal distances (differences in the y-coordinates)
E) the squares of the vertical distances (differences in the y-coordinates)
Unlock Deck
Unlock for access to all 110 flashcards in this deck.
Unlock Deck
k this deck
52
The following data is to be used to construct a regression model: The regression equation is ___.
A) y = 16.49 + 1.43x
B) y = 1.19 + 0.91x
C) y = 1.19 + 0.75x
D) y = 0.75 + 0.18x
E) y = 0.91 + 4.06x
The regression equation is ___.A) y = 16.49 + 1.43x
B) y = 1.19 + 0.91x
C) y = 1.19 + 0.75x
D) y = 0.75 + 0.18x
E) y = 0.91 + 4.06x
Unlock Deck
Unlock for access to all 110 flashcards in this deck.
Unlock Deck
k this deck
53
A cost accountant is developing a regression model to predict the total cost of producing a batch of printed circuit boards as a linear function of batch size (the number of boards produced in one lot or batch). The slope of the accountant's model is ___.
A) batch size
B) unit variable cost
C) fixed cost
D) total cost
E) total variable cost
A) batch size
B) unit variable cost
C) fixed cost
D) total cost
E) total variable cost
Unlock Deck
Unlock for access to all 110 flashcards in this deck.
Unlock Deck
k this deck
54
In the regression equation, y = 54.78 + 1.45x, the intercept is ___.
A) 1.45
B) -1.45
C) 54.78
D) -54.78
E) 0.00
A) 1.45
B) -1.45
C) 54.78
D) -54.78
E) 0.00
Unlock Deck
Unlock for access to all 110 flashcards in this deck.
Unlock Deck
k this deck
55
In the regression equation, y = 49.56 + 0.97x, the slope is ___.
A) 0.97
B) 49.56
C) 1.00
D) 0.00
E) -0.97
A) 0.97
B) 49.56
C) 1.00
D) 0.00
E) -0.97
Unlock Deck
Unlock for access to all 110 flashcards in this deck.
Unlock Deck
k this deck
56
For a certain data set the regression equation is y = 37 + 13x. The correlation coefficient between y and x in this data set ___.
A) must be 0
B) is negative
C) must be 1
D) is positive
E) must be 3
A) must be 0
B) is negative
C) must be 1
D) is positive
E) must be 3
Unlock Deck
Unlock for access to all 110 flashcards in this deck.
Unlock Deck
k this deck
57
For a certain data set the regression equation is y = 29 - 5x. The correlation coefficient between y and x in this data set ___.
A) must be 0
B) is negative
C) must be 1
D) is positive
E) must be >1
A) must be 0
B) is negative
C) must be 1
D) is positive
E) must be >1
Unlock Deck
Unlock for access to all 110 flashcards in this deck.
Unlock Deck
k this deck
58
Suppose you compute the correlation coefficient between two variables, X and Y, and obtain a value of 0.55. Then you realize that all the values for both variables have been corrupted in a way that their actual sign has been changed (positive values were turned into negative values and vice versa; only the signs have been changed). Then the actual, corrected value of the correlation coefficient ___.
A) is −0.55
B) remains unchanged
C) changes but there is not enough information to determine the correct value
D) is 0
E) is 0.50
A) is −0.55
B) remains unchanged
C) changes but there is not enough information to determine the correct value
D) is 0
E) is 0.50
Unlock Deck
Unlock for access to all 110 flashcards in this deck.
Unlock Deck
k this deck
59
The following data is to be used to construct a regression model: The value of the slope is ___.
A) 16.49
B) 1.19
C) 1.43
D) 0.75
E) 1.30
The value of the slope is ___.A) 16.49
B) 1.19
C) 1.43
D) 0.75
E) 1.30
Unlock Deck
Unlock for access to all 110 flashcards in this deck.
Unlock Deck
k this deck
60
A quality manager is developing a regression model to predict the total number of defects as a function of the day of week the item is produced. Production runs are done 10 hours a day, 7 days a week. The explanatory variable is ___.
A) day of week
B) production run
C) percentage of defects
D) number of defects
E) number of production runs
A) day of week
B) production run
C) percentage of defects
D) number of defects
E) number of production runs
Unlock Deck
Unlock for access to all 110 flashcards in this deck.
Unlock Deck
k this deck
61
Which of the following assertions is true about the regression line?
A) The regression line is also called the least cubes line and is found minimizing the sum of the cubes of the residuals.
B) It is found minimizing the sum of the residuals squared, but-even though it would be unnecessarily complicated-it could also be found minimizing the sum of the residuals cubed.
C) Depending on the data, some regression lines could have only positive residuals.
D) Depending on the data, some regression lines could have all residuals equal to zero.
E) Depending on the data, some regression lines could have only negative residuals.
Unlock Deck
Unlock for access to all 110 flashcards in this deck.
Unlock Deck
k this deck
62
The following residuals plot indicates ___.
A) a nonlinear relation
B) a nonconstant error variance
C) the simple regression assumptions are met
D) the sample is biased
E) a random sample
A) a nonlinear relation
B) a nonconstant error variance
C) the simple regression assumptions are met
D) the sample is biased
E) a random sample
Unlock Deck
Unlock for access to all 110 flashcards in this deck.
Unlock Deck
k this deck
63
A simple regression model resulted in a sum of squares of error of 125 (i.e., SSE = 125), and the standard error is 3.95. This model is for ___ pairs of data.
A) 8
B) 9
C) 10
D) 11
E) 12
A) 8
B) 9
C) 10
D) 11
E) 12
Unlock Deck
Unlock for access to all 110 flashcards in this deck.
Unlock Deck
k this deck
64
Suppose for a given data set the regression equation is: y = 54.78 + 1.45x, and the point (0.00, 24.78) is in the data set. The residual for this point is ___.
A) 24.78
B) −24.78
C) 0.00
D) 30.00
E) −30.00
A) 24.78
B) −24.78
C) 0.00
D) 30.00
E) −30.00
Unlock Deck
Unlock for access to all 110 flashcards in this deck.
Unlock Deck
k this deck
65
A simple regression model developed for 12 pairs of data resulted in a sum of squares of error, SSE = 246. The standard error of the estimate is ___.
A) 24.6
B) 4.96
C) 20.5
D) 4.53
E) 12.3
A) 24.6
B) 4.96
C) 20.5
D) 4.53
E) 12.3
Unlock Deck
Unlock for access to all 110 flashcards in this deck.
Unlock Deck
k this deck
66
A simple regression model developed for ten pairs of data resulted in a sum of squares of error, SSE = 125. The standard error of the estimate is ___.
A) 12.5
B) 3.5
C) 15.6
D) 3.95
E) 25
A) 12.5
B) 3.5
C) 15.6
D) 3.95
E) 25
Unlock Deck
Unlock for access to all 110 flashcards in this deck.
Unlock Deck
k this deck
67
The assumptions underlying simple regression analysis include ___.
A) the error terms are exponentially distributed
B) the error terms have unequal variances
C) the model is nonlinear
D) the error terms are dependent
E) the error terms are independent
A) the error terms are exponentially distributed
B) the error terms have unequal variances
C) the model is nonlinear
D) the error terms are dependent
E) the error terms are independent
Unlock Deck
Unlock for access to all 110 flashcards in this deck.
Unlock Deck
k this deck
68
The assumption of constant error variance in regression analysis is called ___.
A) heteroscedasticity
B) homoscedasticity
C) residuals
D) linearity
E) nonnormality
A) heteroscedasticity
B) homoscedasticity
C) residuals
D) linearity
E) nonnormality
Unlock Deck
Unlock for access to all 110 flashcards in this deck.
Unlock Deck
k this deck
69
In the regression equation, y = 2.164 + 1.3657x, n = 6, the mean of x is 8.667, Sxx= 89.333 and Se= 3.44. A 95% confidence interval for the average of y when x = 8 is ___.
A) (9.13, 17.05)
B) (2.75, 23.43)
C) (10.31, 15.86)
D) (3.56, 22.62)
E) (12.09, 14.09)
A) (9.13, 17.05)
B) (2.75, 23.43)
C) (10.31, 15.86)
D) (3.56, 22.62)
E) (12.09, 14.09)
Unlock Deck
Unlock for access to all 110 flashcards in this deck.
Unlock Deck
k this deck
70
A researcher has developed the regression equation y = 2.164 + 1.3657x, where n = 6, the mean of x is 8.667, Sxx = 89.333, and Se = 3.44. The researcher wants to test if the slope is significantly positive, and he chooses a significance level of 0.05. The observed t value is ___.
A) 3.752
B) 3.852
C) 3.972
D) 3.985
E) 3.995
A) 3.752
B) 3.852
C) 3.972
D) 3.985
E) 3.995
Unlock Deck
Unlock for access to all 110 flashcards in this deck.
Unlock Deck
k this deck
71
A researcher has developed the regression equation y = 2.164 + 1.3657x, where n = 6, the mean of x is 8.667, Sxx = 89.333, and Se = 3.44. The researcher wants to test if the slope is significantly positive, and he chooses a significance level of 0.05. The critical t value is ___.
A) 2.776
B) 2.132
C) 2.015
D) 1.943
E) 1.782
A) 2.776
B) 2.132
C) 2.015
D) 1.943
E) 1.782
Unlock Deck
Unlock for access to all 110 flashcards in this deck.
Unlock Deck
k this deck
72
A standard deviation of the error of the regression model is called the ___.
A) coefficient of determination
B) sum of squares of error
C) standard error of the estimate
D) R-squared
E) coefficient of correlation
A) coefficient of determination
B) sum of squares of error
C) standard error of the estimate
D) R-squared
E) coefficient of correlation
Unlock Deck
Unlock for access to all 110 flashcards in this deck.
Unlock Deck
k this deck
73
One of the assumptions made in simple regression is that ___.
A) the error terms are exponentially distributed
B) the error terms have unequal variances
C) the model is linear
D) the error terms are dependent
E) the model is nonlinear
A) the error terms are exponentially distributed
B) the error terms have unequal variances
C) the model is linear
D) the error terms are dependent
E) the model is nonlinear
Unlock Deck
Unlock for access to all 110 flashcards in this deck.
Unlock Deck
k this deck
74
A simple regression model for 10 pair of data resulted in a standard error of 3.95 (i.e., Se = 3.95), and the sum of squares of error (SSE) is ___.
A) 187.23
B) 171.63
C) 156.03
D) 140.42
E) 124.82
A) 187.23
B) 171.63
C) 156.03
D) 140.42
E) 124.82
Unlock Deck
Unlock for access to all 110 flashcards in this deck.
Unlock Deck
k this deck
75
The total of the squared residuals is called the ___.
A) coefficient of determination
B) sum of squares of error
C) standard error of the estimate
D) R-squared
E) coefficient of correlation
A) coefficient of determination
B) sum of squares of error
C) standard error of the estimate
D) R-squared
E) coefficient of correlation
Unlock Deck
Unlock for access to all 110 flashcards in this deck.
Unlock Deck
k this deck
76
A researcher has developed a regression model from 26 pairs of data points. He wants to test if the slope is significantly different from zero. He uses a two? tailed test and ɑ = 0.01. The degrees of freedom for the critical table t value is ___.
A) 23
B) 24
C) 26
D) 25
E) 27
A) 23
B) 24
C) 26
D) 25
E) 27
Unlock Deck
Unlock for access to all 110 flashcards in this deck.
Unlock Deck
k this deck
77
One of the assumptions made in simple regression is that ___.
A) the error terms are normally distributed
B) the error terms have unequal variances
C) the model is nonlinear
D) the error terms are dependent
E) the error terms are all equal
A) the error terms are normally distributed
B) the error terms have unequal variances
C) the model is nonlinear
D) the error terms are dependent
E) the error terms are all equal
Unlock Deck
Unlock for access to all 110 flashcards in this deck.
Unlock Deck
k this deck
78
A researcher has developed a regression model from fourteen pairs of data points. He wants to test if the slope is significantly different from zero. He uses a two? tailed test and ɑ = 0.01. The critical table t value is ___.
A) 2.650
B) 3.012
C) 3.055
D) 2.718
E) 2.168
A) 2.650
B) 3.012
C) 3.055
D) 2.718
E) 2.168
Unlock Deck
Unlock for access to all 110 flashcards in this deck.
Unlock Deck
k this deck
79
The following residuals plot indicates ___.
A) a nonlinear relation
B) a nonconstant error variance
C) the simple regression assumptions are met
D) the sample is biased
E) the sample is random
A) a nonlinear relation
B) a nonconstant error variance
C) the simple regression assumptions are met
D) the sample is biased
E) the sample is random
Unlock Deck
Unlock for access to all 110 flashcards in this deck.
Unlock Deck
k this deck
80
A researcher has developed a regression model from fifteen pairs of data points. He wants to test if the slope is significantly different from zero. He uses a two?tailed test and ɑ = 0.10. The critical table t value is ___.
A) 1.771
B) 1.350
C) 1.761
D) 2.145
E) 2.068
A) 1.771
B) 1.350
C) 1.761
D) 2.145
E) 2.068
Unlock Deck
Unlock for access to all 110 flashcards in this deck.
Unlock Deck
k this deck
Unlock Deck
Unlock for access to all 110 flashcards in this deck.


