Exam 14: Linear Correlation and Simple Linear Regression Analysis
Exam 1: Introduction to Statistics60 Questions
Exam 2: Organizing and Visualizing Data95 Questions
Exam 3: Descriptive Statistics53 Questions
Exam 4: Gathering Data44 Questions
Exam 5: Probability83 Questions
Exam 6: Decision Analysis and Expected Value42 Questions
Exam 7: Discrete Probability Distributions85 Questions
Exam 8: Continuous Distributions64 Questions
Exam 9: Sampling Distributions65 Questions
Exam 10: Confidence Intervals82 Questions
Exam 11: Hypothesis Testing for Single Populations77 Questions
Exam 12: Hypothesis Testing for Two Populations72 Questions
Exam 13: Analysis of Variance Anova45 Questions
Exam 14: Linear Correlation and Simple Linear Regression Analysis110 Questions
Exam 15: Categorical Versus Categorical: Tests78 Questions
Select questions type
A manager wants to predict the cost (y) of travel for salespeople based on the number of days (x) spent on each sales trip. The following model has been developed: y = $400 + 120x. If a trip took 4 days, the predicted cost of the trip is ___.
Free
(Multiple Choice)
4.9/5  (37)
(37)
Correct Answer: Verified
B
The variability in the estimated slope is smaller when the x values are more spread out.
Free
(True/False)
4.9/5 (37)
Correct Answer:Verified
False
Suppose you compute the correlation coefficient between two variables, X and Y, and obtain a value of 0.55. Then you realize that all the values for both variables have been corrupted in a way that their actual sign has been changed (positive values were turned into negative values and vice versa; only the signs have been changed). Then the actual, corrected value of the correlation coefficient ___.
Free
(Multiple Choice)
4.9/5 (34)
Correct Answer:Verified
D
If the correlation coefficient between two variables is -1, it means that the two variables are related.
(True/False)
4.8/5 (33)
A simple regression model for 10 pair of data resulted in a standard error of 3.95 (i.e., Se = 3.95), and the sum of squares of error (SSE) is ___.
(Multiple Choice)
4.9/5 (39)
The following data represent the demand (Y) of an item at a local shop and their price (X).
 Use the data to determine:
a) the coefficient of correlation between demand for the item and price,
b) the proportion of the variation in demand accounted for by price.
Use the data to determine:
a) the coefficient of correlation between demand for the item and price,
b) the proportion of the variation in demand accounted for by price.
(Short Answer)
4.9/5 (36)
If the correlation coefficient between variables X and Y is roughly zero, then ___.
(Multiple Choice)
4.8/5 (35)
A simple regression model resulted in a sum of squares of error of 125 (i.e., SSE = 125), and the standard error is 3.95. This model is for ___ pairs of data.
(Multiple Choice)
4.8/5 (41)
Louis Katz, a cost accountant at Papalote Plastics, Inc. (PPI), is analyzing the manufacturing costs of a molded plastic telephone handset produced by PPI. Louis's independent variable is production lot size (in 1,000's of units), and his dependent variable is the total cost of the lot (in $100's). Regression analysis of the data yielded the following tables: 
 The correlation coefficient between Louis's variables is ___.
(Multiple Choice)
4.8/5 (36)
Regression methods can be pursued to estimate trends that are linear in time.
(True/False)
4.9/5 (37)
A manager at a local bank analyzed the relationship between weekly sales (in $) and length of service (in months) for 30 employees. The table below summarizes a portion of the regression results: 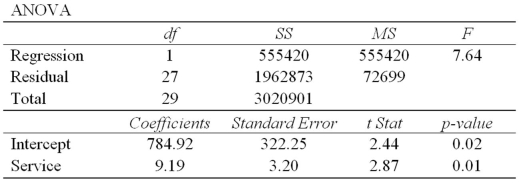 Can the manager conclude that there is a positive linear relationship between sales and service? Carry out the test of hypothesis if
  .
.
(Essay)
4.9/5 (37)
Annie Mikhail, market analyst for a national company specializing in historic city tours, is analyzing the relationship between the sales revenue from historic city tours and the size of the city. She gathers data from six cities in which the tours are offered. Annie's dependent variable is annual sales revenues and her independent variable is the city population. Regression analysis of the data yielded the following tables: 
 The numerical value of the correlation coefficient between the historic city tour sales and the size of city population is ___.
(Multiple Choice)
5.0/5 (45)
A manager wishes to predict the annual cost (y) of an automobile based on the number of miles (x) driven. The following model was developed: y = 2,000 + 0.42x. If a car is driven 15,000 miles, the predicted cost is ___.
(Multiple Choice)
4.9/5 (32)
The equation of the trend line for the data based on sales (in $1000) of a local restaurant over the years 2005-2010 is Sales= -265575+132.571x where x is the year. Using the trend line, the forecast sales for the year 2012 is ___.
(Multiple Choice)
4.8/5 (34)
Given a set of paired data, {X, Y}, if Y is independent of X, you would expect that the correlation coefficient is ___.
(Multiple Choice)
4.8/5 (32)
For a certain data set the regression equation is y = 37 + 13x. The correlation coefficient between y and x in this data set ___.
(Multiple Choice)
4.9/5 (33)
The following data is to be used to construct a regression model:  The value of the intercept is ___.
(Multiple Choice)
4.9/5 (42)
A manager wants to predict the cost (y) of travel for salespeople based on the number of days (x) spent on each sales trip. The following model has been developed: y = $400 + 120x. If a trip took 3 days, the predicted cost of the trip is ___.
(Multiple Choice)
4.9/5 (42)
Filters
- Essay(1)
- Multiple Choice(75)
- Short Answer(6)
- True False(28)
- Matching(0)