Deck 2: Describing Data: Frequency Tables, Frequency Distributions, and Graphic Presentation
Full screen (f)
Question
Question
Question
Question
Question
Question
Question
Question
Question
Question
Question
Question
Question
Question
Question
Question
Question
Question
Question
Question
Question
Question
Refer to the following distribution of commissions: 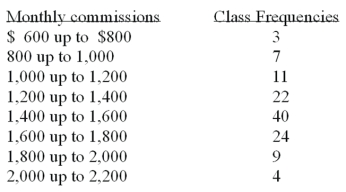 What is the relative frequency for those salespersons that earn from $1,600 up to $1,800?
A) .02
B) .024
C) .20
D) .24
What is the relative frequency for those salespersons that earn from $1,600 up to $1,800?A) .02
B) .024
C) .20
D) .24
Question
Question
The age distribution of a sample of part-time employees at Lloyd's Fast Food Emporium is: 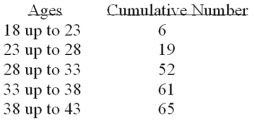 What type of chart should be drawn to present this data?
A) Histogram
B) Simple line chart
C) Cumulative Frequency Distribution
D) Pie chart
E) Frequency polygon
What type of chart should be drawn to present this data?A) Histogram
B) Simple line chart
C) Cumulative Frequency Distribution
D) Pie chart
E) Frequency polygon
Question
A sample distribution of hourly earnings in Paul's Cookie Factory is: 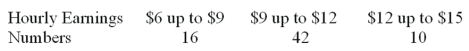 The limits of the class with the smallest frequency are:
A) $6.00 and $9.00
B) $12.00 and up to $14.00
C) $11.75 and $14.25
D) $12.00 and up to $15.00
The limits of the class with the smallest frequency are:A) $6.00 and $9.00
B) $12.00 and up to $14.00
C) $11.75 and $14.25
D) $12.00 and up to $15.00
Question
Question
Question
Question
A student was interested in the cigarette smoking habits of college students and collected data from an unbiased random sample of students. The data is summarized in the following table: 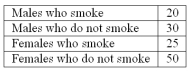 What type of chart best represents relative class frequencies?
A) Bar Chart
B) Pie Chart
C) Scatter plot
D) Frequency Polygon
What type of chart best represents relative class frequencies?A) Bar Chart
B) Pie Chart
C) Scatter plot
D) Frequency Polygon
Question
What is the following table called? 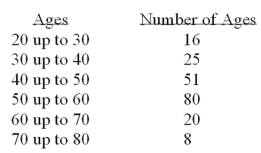
A) Histogram
B) Frequency polygon
C) Cumulative frequency distribution
D) Frequency distribution
A) Histogram
B) Frequency polygon
C) Cumulative frequency distribution
D) Frequency distribution
Question
A student was interested in the cigarette smoking habits of college students and collected data from an unbiased random sample of students. The data is summarized in the following table: 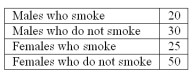 What type of chart best represents the frequency table?
A) Bar Chart
B) Pie Chart
C) Scatter plot
D) Frequency Polygon
What type of chart best represents the frequency table?A) Bar Chart
B) Pie Chart
C) Scatter plot
D) Frequency Polygon
Question
Question
Question
Question
Question
Question
Refer to the following distribution of commissions: 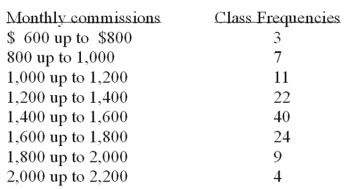 The first coordinate for a cumulative frequency distribution would be:
A) X = 0, Y = 500.
B) X = 500, Y = 3.
C) X = 3, Y = 600.
D) X = 500, Y = 0.
The first coordinate for a cumulative frequency distribution would be:A) X = 0, Y = 500.
B) X = 500, Y = 3.
C) X = 3, Y = 600.
D) X = 500, Y = 0.
Question
For the following distribution of heights, what are the limits for the class with the greatest frequency? 
A) 64 and up to 70
B) 65 and 69
C) 65 and up to 70
D) 69.5 and 74.5
A) 64 and up to 70
B) 65 and 69
C) 65 and up to 70
D) 69.5 and 74.5
Question
Question
A student was interested in the cigarette smoking habits of college students and collected data from an unbiased random sample of students. The data is summarized in the following table: 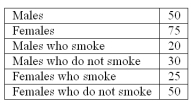 Why is the table NOT a frequency distribution?
A) The number of males does not equal the sum of males that smoke and do not smoke.
B) The classes are not mutually exclusive.
C) There are too many classes.
D) Class limits cannot be computed.
Why is the table NOT a frequency distribution?A) The number of males does not equal the sum of males that smoke and do not smoke.
B) The classes are not mutually exclusive.
C) There are too many classes.
D) Class limits cannot be computed.
Question
Question
Refer to the following frequency distribution on days absent during a calendar year by employees of a manufacturing company: 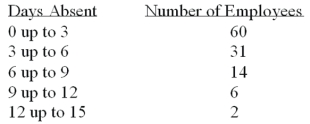 How many employees were absent fewer than six days?
A) 60
B) 31
C) 91
D) 46
How many employees were absent fewer than six days?A) 60
B) 31
C) 91
D) 46
Question
Refer to the following distribution: 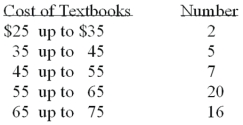 What is the relative class frequency for the $25 up to $35 class?
A) .02
B) .04
C) .05
D) .10
What is the relative class frequency for the $25 up to $35 class?A) .02
B) .04
C) .05
D) .10
Question
Refer to the following distribution of ages: 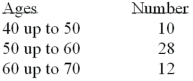 For the distribution of ages above, what is the relative class frequency for the lowest class?
A) .50
B) .18
C) .20
D) .10
For the distribution of ages above, what is the relative class frequency for the lowest class?A) .50
B) .18
C) .20
D) .10
Question
Refer to the following distribution: 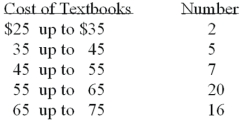 What are the class limits for class with the highest frequency?
A) 55 and 64
B) 54 and 64
C) 55 and up to 65
D) 55 and 64.5
What are the class limits for class with the highest frequency?A) 55 and 64
B) 54 and 64
C) 55 and up to 65
D) 55 and 64.5
Question
Refer to the following distribution of commissions: 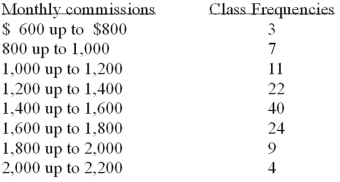 What is the relative frequency of those salespersons that earn $1,600 or more?
A) 25.5%
B) 27.5%
C) 29.5%
D) 30.8%
What is the relative frequency of those salespersons that earn $1,600 or more?A) 25.5%
B) 27.5%
C) 29.5%
D) 30.8%
Question
Refer to the following distribution: 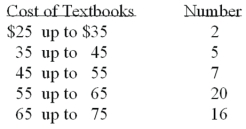 What is the class midpoint for the $45 up to $55 class?
A) 49
B) 49.5
C) 50
D) 50.5
What is the class midpoint for the $45 up to $55 class?A) 49
B) 49.5
C) 50
D) 50.5
Question
Refer to the following distribution of commissions: 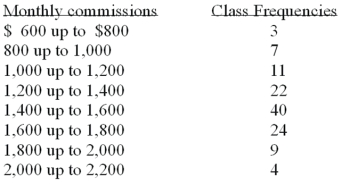 What is the class interval?
A) 200
B) 300
C) 3.500
D) 400
What is the class interval?A) 200
B) 300
C) 3.500
D) 400
Question
Refer to the following frequency distribution on days absent during a calendar year by employees of a manufacturing company: 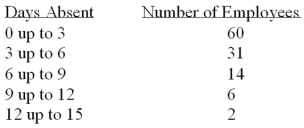 How many employees were absent from 6 up to 12 days?
A) 20
B) 8
C) 12
D) 17
How many employees were absent from 6 up to 12 days?A) 20
B) 8
C) 12
D) 17
Question
Refer to the following distribution of commissions: 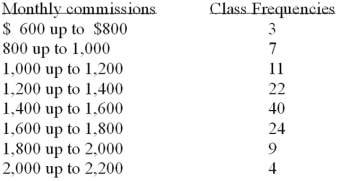 For the distribution above, what is the midpoint of the class with the greatest frequency?
A) 1400
B) 1500
C) 1700
D) The midpoint cannot be determined.
For the distribution above, what is the midpoint of the class with the greatest frequency?A) 1400
B) 1500
C) 1700
D) The midpoint cannot be determined.
Question
Question
Refer to the following distribution of ages: 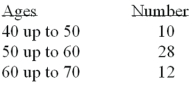 What is the class interval?
A) 9
B) 10
C) 10.5
D) 11
What is the class interval?A) 9
B) 10
C) 10.5
D) 11
Question
Refer to the following frequency distribution on days absent during a calendar year by employees of a manufacturing company: 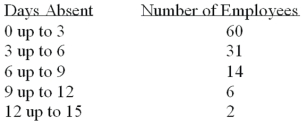 How many employees were absent six days or more?
A) 8
B) 4
C) 22
D) 31
How many employees were absent six days or more?A) 8
B) 4
C) 22
D) 31
Question
Refer to the following wage breakdown for a garment factory. 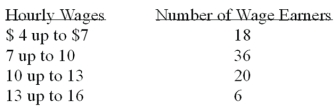 What is the class midpoint for the class with the greatest frequency?
A) $5.50
B) $8.50
C) $11.50
D) $14.50
What is the class midpoint for the class with the greatest frequency?A) $5.50
B) $8.50
C) $11.50
D) $14.50
Question
Refer to the following distribution of ages: 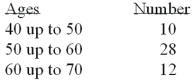 What is the class midpoint of the highest class?
A) 54
B) 55
C) 64
D) 65
What is the class midpoint of the highest class?A) 54
B) 55
C) 64
D) 65
Question
Refer to the following frequency distribution on days absent during a calendar year by employees of a manufacturing company: 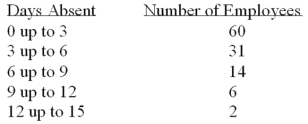 How many employees were absent between 3 up to 6 days?
A) 31
B) 29
C) 14
D) 2
How many employees were absent between 3 up to 6 days?A) 31
B) 29
C) 14
D) 2
Question
Refer to the following wage breakdown for a garment factory. 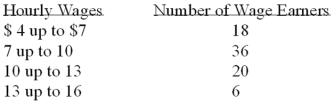 What are the class limits for the class with the smallest frequency?
A) 3.5 and 6.5
B) 4 and up to 7
C) 13 and up to 16
D) 12.5 and 15.5
What are the class limits for the class with the smallest frequency?A) 3.5 and 6.5
B) 4 and up to 7
C) 13 and up to 16
D) 12.5 and 15.5
Question
Question
Refer to the following breakdown of responses to a survey of room service in a hotel. 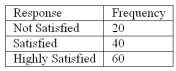 What is the class interval for the frequency table above?
A) 10
B) 20
C) 40
D) None of the above
What is the class interval for the frequency table above?A) 10
B) 20
C) 40
D) None of the above
Question
Refer to the following wage breakdown for a garment factory. 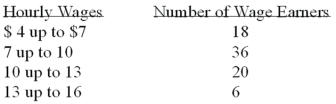 What is the class interval for the table of wages above?
A) $2
B) $3
C) $4
D) $5
What is the class interval for the table of wages above?A) $2
B) $3
C) $4
D) $5
Question
Question
Refer to the following breakdown of responses to a survey of "How confident are you that you saved enough to retire"? 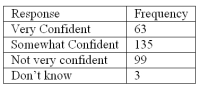 What is the class with the greatest frequency?
A) Very confident.
B) Somewhat confident.
C) Not very confident.
D) Don't know.
What is the class with the greatest frequency?A) Very confident.
B) Somewhat confident.
C) Not very confident.
D) Don't know.
Question
Refer to the following breakdown of responses to a survey of "Are you concerned about being tracked while connected to the Internet"? 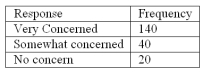 What type of chart should be used to show relative class frequencies?
A) Pie chart
B) Bar chart
C) Histogram
D) Frequency Polygon
What type of chart should be used to show relative class frequencies?A) Pie chart
B) Bar chart
C) Histogram
D) Frequency Polygon
Question
Question
Question
Question
Question
Refer to the following breakdown of responses to a survey of "Are you concerned about being tracked while connected to the Internet"? 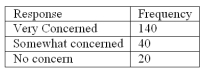 What type of chart should be used to describe the frequency table?
A) Pie chart
B) Bar chart
C) Histogram
D) Frequency Polygon
What type of chart should be used to describe the frequency table?A) Pie chart
B) Bar chart
C) Histogram
D) Frequency Polygon
Question
Refer to the following breakdown of responses to a survey of "How confident are you that you saved enough to retire"? 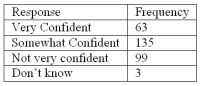 What is the class interval for the frequency table above?
A) 10
B) 20
C) 40
D) None of the above
What is the class interval for the frequency table above?A) 10
B) 20
C) 40
D) None of the above
Question
Refer to the following breakdown of responses to a survey of "Are you concerned about being tracked while connected to the Internet"? 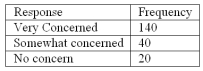 What percent of the responses indicated that users were somewhat concerned?
A) 40%
B) 70%
C) 20%
D) 100%
What percent of the responses indicated that users were somewhat concerned?A) 40%
B) 70%
C) 20%
D) 100%
Question
Refer to the following breakdown of responses to a survey of room service in a hotel. 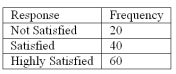 What type of chart should be used to describe the frequency table?
A) Pie chart
B) Bar chart
C) Histogram
D) Frequency Polygon
What type of chart should be used to describe the frequency table?A) Pie chart
B) Bar chart
C) Histogram
D) Frequency Polygon
Question
Refer to the following breakdown of responses to a survey of room service in a hotel. 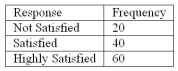 What is the class with the greatest frequency?
A) Not satisfied
B) Satisfied
C) Highly satisfied
D) None of the above
What is the class with the greatest frequency?A) Not satisfied
B) Satisfied
C) Highly satisfied
D) None of the above
Question
Refer to the following breakdown of responses to a survey of room service in a hotel. 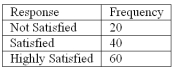 What percent of the responses indicated that customers were satisfied?
A) 40%
B) 33%
C) 50%
D) 100%
What percent of the responses indicated that customers were satisfied?A) 40%
B) 33%
C) 50%
D) 100%
Question
Question
Refer to the following breakdown of responses to a survey of "How confident are you that you saved enough to retire"? 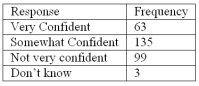 What type of chart should be used to describe the frequency table?
A) Pie chart
B) Bar chart
C) Histogram
D) Frequency Polygon
What type of chart should be used to describe the frequency table?A) Pie chart
B) Bar chart
C) Histogram
D) Frequency Polygon
Question
Refer to the following breakdown of responses to a survey of room service in a hotel. 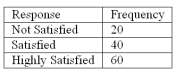 What type of chart should be used to show relative class frequencies?
A) Pie chart
B) Bar chart
C) Histogram
D) Frequency Polygon
What type of chart should be used to show relative class frequencies?A) Pie chart
B) Bar chart
C) Histogram
D) Frequency Polygon
Question
Refer to the following breakdown of responses to a survey of "How confident are you that you saved enough to retire"? 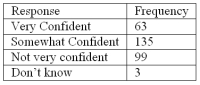 What type of chart should be used to show relative class frequencies?
A) Pie chart
B) Bar chart
C) Histogram
D) Frequency Polygon
What type of chart should be used to show relative class frequencies?A) Pie chart
B) Bar chart
C) Histogram
D) Frequency Polygon
Question
Refer to the following breakdown of responses to a survey of "How confident are you that you saved enough to retire"? 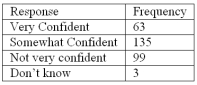 What percent of the responses indicated that users were very confident?
A) 63%
B) 21%
C) 45%
D) 33%
What percent of the responses indicated that users were very confident?A) 63%
B) 21%
C) 45%
D) 33%
Question
Refer to the following breakdown of responses to a survey of "Are you concerned about being tracked while connected to the Internet"? 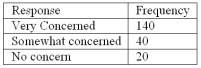 What is the class with the greatest frequency?
A) Very concerned
B) Somewhat concerned
C) No concern
D) None of the above
What is the class with the greatest frequency?A) Very concerned
B) Somewhat concerned
C) No concern
D) None of the above
Question
Refer to the following breakdown of responses to a survey of "Are you concerned about being tracked while connected to the Internet"? 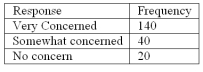 What is the class interval for the frequency table above?
A) 10
B) 20
C) 40
D) None of the above
What is the class interval for the frequency table above?A) 10
B) 20
C) 40
D) None of the above

Unlock Deck
Sign up to unlock the cards in this deck!
Unlock Deck
Unlock Deck
1/129
Play
Full screen (f)
Deck 2: Describing Data: Frequency Tables, Frequency Distributions, and Graphic Presentation
1
A small sample of computer operators shows monthly incomes of $1,950, $1,775, $2,060, $1,840, $1,795, $1,890, $1,925 and $1,810. What are these ungrouped numbers called?
A) Histogram
B) Class limits
C) Class frequencies
D) Raw data
A) Histogram
B) Class limits
C) Class frequencies
D) Raw data
D
2
A frequency distribution for qualitative data has class limits.
False
3
The midpoint of a class, which is also called a class mark, is halfway between the lower and upper limits.
True
4
To construct a pie chart, relative class frequencies are used to graph the "slices" of the pie.
Unlock Deck
Unlock for access to all 129 flashcards in this deck.
Unlock Deck
k this deck
5
Monthly commissions of first-year insurance brokers are $1,270, $1,310, $1,680, $1,380, $1,410, $1,570, $1,180 and $1,420. These figures are referred to as:
A) histogram.
B) raw data.
C) frequency distribution.
D) frequency polygon.
A) histogram.
B) raw data.
C) frequency distribution.
D) frequency polygon.
Unlock Deck
Unlock for access to all 129 flashcards in this deck.
Unlock Deck
k this deck
6
In frequency distributions, classes are mutually exclusive if each individual, object, or measurement is included in only one category.
Unlock Deck
Unlock for access to all 129 flashcards in this deck.
Unlock Deck
k this deck
7
To convert a frequency distribution to a relative frequency distribution, divide each class frequency by the number of classes.
Unlock Deck
Unlock for access to all 129 flashcards in this deck.
Unlock Deck
k this deck
8
To summarize the gender of students attending a college, the number of classes in a frequency distribution depends on the number of students.
Unlock Deck
Unlock for access to all 129 flashcards in this deck.
Unlock Deck
k this deck
9
A cumulative frequency distribution is used when we want to determine how many observations lie above or below certain values.
Unlock Deck
Unlock for access to all 129 flashcards in this deck.
Unlock Deck
k this deck
10
A frequency distribution groups data into classes showing the number of observations in each class.
Unlock Deck
Unlock for access to all 129 flashcards in this deck.
Unlock Deck
k this deck
11
A pie chart is similar to a relative frequency distribution.
Unlock Deck
Unlock for access to all 129 flashcards in this deck.
Unlock Deck
k this deck
12
When data is collected using a qualitative, nominal variable, i.e., male or female, what is true about a frequency distribution that summarizes the data?
A) Upper and lower class limits must be calculated.
B) Class midpoints can be computed.
C) Number of classes corresponds to the number of a variable's values.
D) The "2 to the k rule" can be applied.
A) Upper and lower class limits must be calculated.
B) Class midpoints can be computed.
C) Number of classes corresponds to the number of a variable's values.
D) The "2 to the k rule" can be applied.
Unlock Deck
Unlock for access to all 129 flashcards in this deck.
Unlock Deck
k this deck
13
A pie chart shows the relative frequency in each class.
Unlock Deck
Unlock for access to all 129 flashcards in this deck.
Unlock Deck
k this deck
14
In a bar chart, the heights of the bars represent the frequencies in each class.
Unlock Deck
Unlock for access to all 129 flashcards in this deck.
Unlock Deck
k this deck
15
When data is collected using a quantitative, ratio variable, what is true about a frequency distribution that summarizes the data?
A) Upper and lower class limits must be calculated.
B) A pie chart can be used to summarize the data.
C) Number of classes is equal to the number of variable's values.
D) The "5 to the k rule" can be applied.
A) Upper and lower class limits must be calculated.
B) A pie chart can be used to summarize the data.
C) Number of classes is equal to the number of variable's values.
D) The "5 to the k rule" can be applied.
Unlock Deck
Unlock for access to all 129 flashcards in this deck.
Unlock Deck
k this deck
16
In a bar chart, the x-axis is labeled with the values of a qualitative variable.
Unlock Deck
Unlock for access to all 129 flashcards in this deck.
Unlock Deck
k this deck
17
A frequency polygon is a very useful graphic technique when comparing two or more distributions.
Unlock Deck
Unlock for access to all 129 flashcards in this deck.
Unlock Deck
k this deck
18
A class interval, which is the width of a class, can be determined by subtracting the lower limit of a class from the lower limit of the next higher class.
Unlock Deck
Unlock for access to all 129 flashcards in this deck.
Unlock Deck
k this deck
19
To convert a frequency distribution to a relative frequency distribution, divide each class frequency by the sum of the class frequencies.
Unlock Deck
Unlock for access to all 129 flashcards in this deck.
Unlock Deck
k this deck
20
When data is collected using a qualitative, nominal variable, what is true about a frequency distribution that summarizes the data?
A) Upper and lower class limits must be calculated.
B) A pie chart can be used to summarize the data.
C) Number of classes is equal to the number of variable's values plus 2.
D) The "5 to the k rule" can be applied.
A) Upper and lower class limits must be calculated.
B) A pie chart can be used to summarize the data.
C) Number of classes is equal to the number of variable's values plus 2.
D) The "5 to the k rule" can be applied.
Unlock Deck
Unlock for access to all 129 flashcards in this deck.
Unlock Deck
k this deck
21
The relative frequency for a class is computed as the class
A) width divided by class interval.
B) midpoint divided by the class frequency.
C) frequency divided by the class interval.
D) frequency divided by the total frequency.
A) width divided by class interval.
B) midpoint divided by the class frequency.
C) frequency divided by the class interval.
D) frequency divided by the total frequency.
Unlock Deck
Unlock for access to all 129 flashcards in this deck.
Unlock Deck
k this deck
22
Refer to the following distribution of commissions: What is the relative frequency for those salespersons that earn from $1,600 up to $1,800?
A) .02
B) .024
C) .20
D) .24
What is the relative frequency for those salespersons that earn from $1,600 up to $1,800?A) .02
B) .024
C) .20
D) .24
Unlock Deck
Unlock for access to all 129 flashcards in this deck.
Unlock Deck
k this deck
23
Why are unequal class intervals sometimes used in a frequency distribution?
A) To avoid a large number of empty classes
B) For the sake of variety in presenting the data
C) To make the class frequencies smaller
D) To avoid the need for midpoints
A) To avoid a large number of empty classes
B) For the sake of variety in presenting the data
C) To make the class frequencies smaller
D) To avoid the need for midpoints
Unlock Deck
Unlock for access to all 129 flashcards in this deck.
Unlock Deck
k this deck
24
The age distribution of a sample of part-time employees at Lloyd's Fast Food Emporium is: What type of chart should be drawn to present this data?
A) Histogram
B) Simple line chart
C) Cumulative Frequency Distribution
D) Pie chart
E) Frequency polygon
What type of chart should be drawn to present this data?A) Histogram
B) Simple line chart
C) Cumulative Frequency Distribution
D) Pie chart
E) Frequency polygon
Unlock Deck
Unlock for access to all 129 flashcards in this deck.
Unlock Deck
k this deck
25
A sample distribution of hourly earnings in Paul's Cookie Factory is: The limits of the class with the smallest frequency are:
A) $6.00 and $9.00
B) $12.00 and up to $14.00
C) $11.75 and $14.25
D) $12.00 and up to $15.00
The limits of the class with the smallest frequency are:A) $6.00 and $9.00
B) $12.00 and up to $14.00
C) $11.75 and $14.25
D) $12.00 and up to $15.00
Unlock Deck
Unlock for access to all 129 flashcards in this deck.
Unlock Deck
k this deck
26
A student was studying the political party preferences of a university's student population. The survey instrument asked students to identify themselves as a democrat or a republican. This question is flawed because:
A) Students generally don't know their political preferences.
B) The categories are generally mutually exclusive.
C) The categories are not exhaustive.
D) Political preference is a continuous variable.
A) Students generally don't know their political preferences.
B) The categories are generally mutually exclusive.
C) The categories are not exhaustive.
D) Political preference is a continuous variable.
Unlock Deck
Unlock for access to all 129 flashcards in this deck.
Unlock Deck
k this deck
27
A student was studying the political party preferences of a university's student population. The survey instrument asked students to identify their political preference, for example, democrat, republican, libertarian, or other party. The best way to illustrate the relative frequency distribution is a:
A) Bar chart.
B) Pie chart.
C) Histogram.
D) Frequency polygon.
A) Bar chart.
B) Pie chart.
C) Histogram.
D) Frequency polygon.
Unlock Deck
Unlock for access to all 129 flashcards in this deck.
Unlock Deck
k this deck
28
When a class interval is expressed as: 100 up to 200,
A) Observations with values of 100 are excluded from the class.
B) Observations with values of 200 are included in the class.
C) Observations with values of 200 are excluded from the class.
D) The class interval is 99.
A) Observations with values of 100 are excluded from the class.
B) Observations with values of 200 are included in the class.
C) Observations with values of 200 are excluded from the class.
D) The class interval is 99.
Unlock Deck
Unlock for access to all 129 flashcards in this deck.
Unlock Deck
k this deck
29
A student was interested in the cigarette smoking habits of college students and collected data from an unbiased random sample of students. The data is summarized in the following table: What type of chart best represents relative class frequencies?
A) Bar Chart
B) Pie Chart
C) Scatter plot
D) Frequency Polygon
What type of chart best represents relative class frequencies?A) Bar Chart
B) Pie Chart
C) Scatter plot
D) Frequency Polygon
Unlock Deck
Unlock for access to all 129 flashcards in this deck.
Unlock Deck
k this deck
30
What is the following table called?
A) Histogram
B) Frequency polygon
C) Cumulative frequency distribution
D) Frequency distribution
A) Histogram
B) Frequency polygon
C) Cumulative frequency distribution
D) Frequency distribution
Unlock Deck
Unlock for access to all 129 flashcards in this deck.
Unlock Deck
k this deck
31
A student was interested in the cigarette smoking habits of college students and collected data from an unbiased random sample of students. The data is summarized in the following table: What type of chart best represents the frequency table?
A) Bar Chart
B) Pie Chart
C) Scatter plot
D) Frequency Polygon
What type of chart best represents the frequency table?A) Bar Chart
B) Pie Chart
C) Scatter plot
D) Frequency Polygon
Unlock Deck
Unlock for access to all 129 flashcards in this deck.
Unlock Deck
k this deck
32
The monthly salaries of a sample of 100 employees were rounded to the nearest ten dollars. They ranged from a low of $1,040 to a high of $1,720. If we want to condense the data into seven classes, what is the most convenient class interval?
A) $50
B) $100
C) $150
D) $200
A) $50
B) $100
C) $150
D) $200
Unlock Deck
Unlock for access to all 129 flashcards in this deck.
Unlock Deck
k this deck
33
A student was studying the political party preferences of a university's student population. The survey instrument asked students to identify their political preference, for example, democrat, republican, libertarian, or other party. The best way to illustrate the frequencies for each political preference is a:
A) Bar chart.
B) Pie chart.
C) Histogram.
D) Frequency polygon.
A) Bar chart.
B) Pie chart.
C) Histogram.
D) Frequency polygon.
Unlock Deck
Unlock for access to all 129 flashcards in this deck.
Unlock Deck
k this deck
34
A group of 100 students were surveyed about their interest in a new Economics major. Interest was measured in terms of high, medium, or low. 30 students responded high interest; 50 students responded medium interest; 20 students responded low interest. What is the best way to illustrate the relative frequency of student interest?
A. Cumulative frequency polygon
B. Bar chart
C. Pie chart
D. Frequency table
A. Cumulative frequency polygon
B. Bar chart
C. Pie chart
D. Frequency table
Unlock Deck
Unlock for access to all 129 flashcards in this deck.
Unlock Deck
k this deck
35
In a frequency distribution, the number of observations in a class is called class
A) midpoint
B) interval
C) array
D) frequency
A) midpoint
B) interval
C) array
D) frequency
Unlock Deck
Unlock for access to all 129 flashcards in this deck.
Unlock Deck
k this deck
36
A group of 100 students was surveyed about their interest in a new International Studies program. Interest was measured in terms of high, medium, or low. 30 students responded high interest; 40 students responded medium interest; 30 students responded low interest. What is the relative frequency of students with high interest?
A) .30
B) .50
C) .40
D) Cannot be determined.
A) .30
B) .50
C) .40
D) Cannot be determined.
Unlock Deck
Unlock for access to all 129 flashcards in this deck.
Unlock Deck
k this deck
37
Refer to the following distribution of commissions: The first coordinate for a cumulative frequency distribution would be:
A) X = 0, Y = 500.
B) X = 500, Y = 3.
C) X = 3, Y = 600.
D) X = 500, Y = 0.
The first coordinate for a cumulative frequency distribution would be:A) X = 0, Y = 500.
B) X = 500, Y = 3.
C) X = 3, Y = 600.
D) X = 500, Y = 0.
Unlock Deck
Unlock for access to all 129 flashcards in this deck.
Unlock Deck
k this deck
38
For the following distribution of heights, what are the limits for the class with the greatest frequency?
A) 64 and up to 70
B) 65 and 69
C) 65 and up to 70
D) 69.5 and 74.5
A) 64 and up to 70
B) 65 and 69
C) 65 and up to 70
D) 69.5 and 74.5
Unlock Deck
Unlock for access to all 129 flashcards in this deck.
Unlock Deck
k this deck
39
The relative frequency for a class represents the
A) class width.
B) class midpoint.
C) class interval.
D) percent of observations in the class.
A) class width.
B) class midpoint.
C) class interval.
D) percent of observations in the class.
Unlock Deck
Unlock for access to all 129 flashcards in this deck.
Unlock Deck
k this deck
40
A student was interested in the cigarette smoking habits of college students and collected data from an unbiased random sample of students. The data is summarized in the following table: Why is the table NOT a frequency distribution?
A) The number of males does not equal the sum of males that smoke and do not smoke.
B) The classes are not mutually exclusive.
C) There are too many classes.
D) Class limits cannot be computed.
Why is the table NOT a frequency distribution?A) The number of males does not equal the sum of males that smoke and do not smoke.
B) The classes are not mutually exclusive.
C) There are too many classes.
D) Class limits cannot be computed.
Unlock Deck
Unlock for access to all 129 flashcards in this deck.
Unlock Deck
k this deck
41
Refer to the following information from a frequency distribution for "heights of college women" recorded to the nearest inch: The first two class midpoints are 62.5" and 65.5".
What are the class limits for the third class?
A) 64 and up to 67
B) 67 and 69
C) 67 and up to 70
D) 66 and 68
What are the class limits for the third class?
A) 64 and up to 67
B) 67 and 69
C) 67 and up to 70
D) 66 and 68
Unlock Deck
Unlock for access to all 129 flashcards in this deck.
Unlock Deck
k this deck
42
Refer to the following frequency distribution on days absent during a calendar year by employees of a manufacturing company: How many employees were absent fewer than six days?
A) 60
B) 31
C) 91
D) 46
How many employees were absent fewer than six days?A) 60
B) 31
C) 91
D) 46
Unlock Deck
Unlock for access to all 129 flashcards in this deck.
Unlock Deck
k this deck
43
Refer to the following distribution: What is the relative class frequency for the $25 up to $35 class?
A) .02
B) .04
C) .05
D) .10
What is the relative class frequency for the $25 up to $35 class?A) .02
B) .04
C) .05
D) .10
Unlock Deck
Unlock for access to all 129 flashcards in this deck.
Unlock Deck
k this deck
44
Refer to the following distribution of ages: For the distribution of ages above, what is the relative class frequency for the lowest class?
A) .50
B) .18
C) .20
D) .10
For the distribution of ages above, what is the relative class frequency for the lowest class?A) .50
B) .18
C) .20
D) .10
Unlock Deck
Unlock for access to all 129 flashcards in this deck.
Unlock Deck
k this deck
45
Refer to the following distribution: What are the class limits for class with the highest frequency?
A) 55 and 64
B) 54 and 64
C) 55 and up to 65
D) 55 and 64.5
What are the class limits for class with the highest frequency?A) 55 and 64
B) 54 and 64
C) 55 and up to 65
D) 55 and 64.5
Unlock Deck
Unlock for access to all 129 flashcards in this deck.
Unlock Deck
k this deck
46
Refer to the following distribution of commissions: What is the relative frequency of those salespersons that earn $1,600 or more?
A) 25.5%
B) 27.5%
C) 29.5%
D) 30.8%
What is the relative frequency of those salespersons that earn $1,600 or more?A) 25.5%
B) 27.5%
C) 29.5%
D) 30.8%
Unlock Deck
Unlock for access to all 129 flashcards in this deck.
Unlock Deck
k this deck
47
Refer to the following distribution: What is the class midpoint for the $45 up to $55 class?
A) 49
B) 49.5
C) 50
D) 50.5
What is the class midpoint for the $45 up to $55 class?A) 49
B) 49.5
C) 50
D) 50.5
Unlock Deck
Unlock for access to all 129 flashcards in this deck.
Unlock Deck
k this deck
48
Refer to the following distribution of commissions: What is the class interval?
A) 200
B) 300
C) 3.500
D) 400
What is the class interval?A) 200
B) 300
C) 3.500
D) 400
Unlock Deck
Unlock for access to all 129 flashcards in this deck.
Unlock Deck
k this deck
49
Refer to the following frequency distribution on days absent during a calendar year by employees of a manufacturing company: How many employees were absent from 6 up to 12 days?
A) 20
B) 8
C) 12
D) 17
How many employees were absent from 6 up to 12 days?A) 20
B) 8
C) 12
D) 17
Unlock Deck
Unlock for access to all 129 flashcards in this deck.
Unlock Deck
k this deck
50
Refer to the following distribution of commissions: For the distribution above, what is the midpoint of the class with the greatest frequency?
A) 1400
B) 1500
C) 1700
D) The midpoint cannot be determined.
For the distribution above, what is the midpoint of the class with the greatest frequency?A) 1400
B) 1500
C) 1700
D) The midpoint cannot be determined.
Unlock Deck
Unlock for access to all 129 flashcards in this deck.
Unlock Deck
k this deck
51
Refer to the following information from a frequency distribution for "heights of college women" recorded to the nearest inch: The first two class midpoints are 62.5" and 65.5".
What is the class interval?
A) 1"
B) 2"
C) 2.5"
D) 3"
What is the class interval?
A) 1"
B) 2"
C) 2.5"
D) 3"
Unlock Deck
Unlock for access to all 129 flashcards in this deck.
Unlock Deck
k this deck
52
Refer to the following distribution of ages: What is the class interval?
A) 9
B) 10
C) 10.5
D) 11
What is the class interval?A) 9
B) 10
C) 10.5
D) 11
Unlock Deck
Unlock for access to all 129 flashcards in this deck.
Unlock Deck
k this deck
53
Refer to the following frequency distribution on days absent during a calendar year by employees of a manufacturing company: How many employees were absent six days or more?
A) 8
B) 4
C) 22
D) 31
How many employees were absent six days or more?A) 8
B) 4
C) 22
D) 31
Unlock Deck
Unlock for access to all 129 flashcards in this deck.
Unlock Deck
k this deck
54
Refer to the following wage breakdown for a garment factory. What is the class midpoint for the class with the greatest frequency?
A) $5.50
B) $8.50
C) $11.50
D) $14.50
What is the class midpoint for the class with the greatest frequency?A) $5.50
B) $8.50
C) $11.50
D) $14.50
Unlock Deck
Unlock for access to all 129 flashcards in this deck.
Unlock Deck
k this deck
55
Refer to the following distribution of ages: What is the class midpoint of the highest class?
A) 54
B) 55
C) 64
D) 65
What is the class midpoint of the highest class?A) 54
B) 55
C) 64
D) 65
Unlock Deck
Unlock for access to all 129 flashcards in this deck.
Unlock Deck
k this deck
56
Refer to the following frequency distribution on days absent during a calendar year by employees of a manufacturing company: How many employees were absent between 3 up to 6 days?
A) 31
B) 29
C) 14
D) 2
How many employees were absent between 3 up to 6 days?A) 31
B) 29
C) 14
D) 2
Unlock Deck
Unlock for access to all 129 flashcards in this deck.
Unlock Deck
k this deck
57
Refer to the following wage breakdown for a garment factory. What are the class limits for the class with the smallest frequency?
A) 3.5 and 6.5
B) 4 and up to 7
C) 13 and up to 16
D) 12.5 and 15.5
What are the class limits for the class with the smallest frequency?A) 3.5 and 6.5
B) 4 and up to 7
C) 13 and up to 16
D) 12.5 and 15.5
Unlock Deck
Unlock for access to all 129 flashcards in this deck.
Unlock Deck
k this deck
58
Refer to the following information from a frequency distribution for "heights of college women" recorded to the nearest inch: The first two class midpoints are 62.5" and 65.5".
What are the class limits for the lowest class?
A) 61 and up to 64
B) 62 and up to 64
C) 62 and 65
D) 62 and 63
What are the class limits for the lowest class?
A) 61 and up to 64
B) 62 and up to 64
C) 62 and 65
D) 62 and 63
Unlock Deck
Unlock for access to all 129 flashcards in this deck.
Unlock Deck
k this deck
59
Refer to the following breakdown of responses to a survey of room service in a hotel. What is the class interval for the frequency table above?
A) 10
B) 20
C) 40
D) None of the above
What is the class interval for the frequency table above?A) 10
B) 20
C) 40
D) None of the above
Unlock Deck
Unlock for access to all 129 flashcards in this deck.
Unlock Deck
k this deck
60
Refer to the following wage breakdown for a garment factory. What is the class interval for the table of wages above?
A) $2
B) $3
C) $4
D) $5
What is the class interval for the table of wages above?A) $2
B) $3
C) $4
D) $5
Unlock Deck
Unlock for access to all 129 flashcards in this deck.
Unlock Deck
k this deck
61
For a frequency distribution of qualitative data, if the observations can be assigned to only one class, the classes are ___________________________.
Unlock Deck
Unlock for access to all 129 flashcards in this deck.
Unlock Deck
k this deck
62
Refer to the following breakdown of responses to a survey of "How confident are you that you saved enough to retire"? What is the class with the greatest frequency?
A) Very confident.
B) Somewhat confident.
C) Not very confident.
D) Don't know.
What is the class with the greatest frequency?A) Very confident.
B) Somewhat confident.
C) Not very confident.
D) Don't know.
Unlock Deck
Unlock for access to all 129 flashcards in this deck.
Unlock Deck
k this deck
63
Refer to the following breakdown of responses to a survey of "Are you concerned about being tracked while connected to the Internet"? What type of chart should be used to show relative class frequencies?
A) Pie chart
B) Bar chart
C) Histogram
D) Frequency Polygon
What type of chart should be used to show relative class frequencies?A) Pie chart
B) Bar chart
C) Histogram
D) Frequency Polygon
Unlock Deck
Unlock for access to all 129 flashcards in this deck.
Unlock Deck
k this deck
64
A pie chart shows the
A) relative frequencies of a qualitative variable.
B) relative frequencies of a quantitative variable.
C) frequencies of a nominal variable.
D) frequencies of a ratio variable.
A) relative frequencies of a qualitative variable.
B) relative frequencies of a quantitative variable.
C) frequencies of a nominal variable.
D) frequencies of a ratio variable.
Unlock Deck
Unlock for access to all 129 flashcards in this deck.
Unlock Deck
k this deck
65
In constructing a frequency polygon, class frequencies are scaled on which axis? ______
Unlock Deck
Unlock for access to all 129 flashcards in this deck.
Unlock Deck
k this deck
66
What is the number of observations in each class of a frequency distribution called? _________________________
Unlock Deck
Unlock for access to all 129 flashcards in this deck.
Unlock Deck
k this deck
67
A frequency distribution for nominal data requires that the categories be ___________________ and ______________________.
Unlock Deck
Unlock for access to all 129 flashcards in this deck.
Unlock Deck
k this deck
68
Refer to the following breakdown of responses to a survey of "Are you concerned about being tracked while connected to the Internet"? What type of chart should be used to describe the frequency table?
A) Pie chart
B) Bar chart
C) Histogram
D) Frequency Polygon
What type of chart should be used to describe the frequency table?A) Pie chart
B) Bar chart
C) Histogram
D) Frequency Polygon
Unlock Deck
Unlock for access to all 129 flashcards in this deck.
Unlock Deck
k this deck
69
Refer to the following breakdown of responses to a survey of "How confident are you that you saved enough to retire"? What is the class interval for the frequency table above?
A) 10
B) 20
C) 40
D) None of the above
What is the class interval for the frequency table above?A) 10
B) 20
C) 40
D) None of the above
Unlock Deck
Unlock for access to all 129 flashcards in this deck.
Unlock Deck
k this deck
70
Refer to the following breakdown of responses to a survey of "Are you concerned about being tracked while connected to the Internet"? What percent of the responses indicated that users were somewhat concerned?
A) 40%
B) 70%
C) 20%
D) 100%
What percent of the responses indicated that users were somewhat concerned?A) 40%
B) 70%
C) 20%
D) 100%
Unlock Deck
Unlock for access to all 129 flashcards in this deck.
Unlock Deck
k this deck
71
Refer to the following breakdown of responses to a survey of room service in a hotel. What type of chart should be used to describe the frequency table?
A) Pie chart
B) Bar chart
C) Histogram
D) Frequency Polygon
What type of chart should be used to describe the frequency table?A) Pie chart
B) Bar chart
C) Histogram
D) Frequency Polygon
Unlock Deck
Unlock for access to all 129 flashcards in this deck.
Unlock Deck
k this deck
72
Refer to the following breakdown of responses to a survey of room service in a hotel. What is the class with the greatest frequency?
A) Not satisfied
B) Satisfied
C) Highly satisfied
D) None of the above
What is the class with the greatest frequency?A) Not satisfied
B) Satisfied
C) Highly satisfied
D) None of the above
Unlock Deck
Unlock for access to all 129 flashcards in this deck.
Unlock Deck
k this deck
73
Refer to the following breakdown of responses to a survey of room service in a hotel. What percent of the responses indicated that customers were satisfied?
A) 40%
B) 33%
C) 50%
D) 100%
What percent of the responses indicated that customers were satisfied?A) 40%
B) 33%
C) 50%
D) 100%
Unlock Deck
Unlock for access to all 129 flashcards in this deck.
Unlock Deck
k this deck
74
For a frequency distribution of quantitative data, if every individual, object or measurement can be assigned to a class, the frequency distribution is ___________.
Unlock Deck
Unlock for access to all 129 flashcards in this deck.
Unlock Deck
k this deck
75
Refer to the following breakdown of responses to a survey of "How confident are you that you saved enough to retire"? What type of chart should be used to describe the frequency table?
A) Pie chart
B) Bar chart
C) Histogram
D) Frequency Polygon
What type of chart should be used to describe the frequency table?A) Pie chart
B) Bar chart
C) Histogram
D) Frequency Polygon
Unlock Deck
Unlock for access to all 129 flashcards in this deck.
Unlock Deck
k this deck
76
Refer to the following breakdown of responses to a survey of room service in a hotel. What type of chart should be used to show relative class frequencies?
A) Pie chart
B) Bar chart
C) Histogram
D) Frequency Polygon
What type of chart should be used to show relative class frequencies?A) Pie chart
B) Bar chart
C) Histogram
D) Frequency Polygon
Unlock Deck
Unlock for access to all 129 flashcards in this deck.
Unlock Deck
k this deck
77
Refer to the following breakdown of responses to a survey of "How confident are you that you saved enough to retire"? What type of chart should be used to show relative class frequencies?
A) Pie chart
B) Bar chart
C) Histogram
D) Frequency Polygon
What type of chart should be used to show relative class frequencies?A) Pie chart
B) Bar chart
C) Histogram
D) Frequency Polygon
Unlock Deck
Unlock for access to all 129 flashcards in this deck.
Unlock Deck
k this deck
78
Refer to the following breakdown of responses to a survey of "How confident are you that you saved enough to retire"? What percent of the responses indicated that users were very confident?
A) 63%
B) 21%
C) 45%
D) 33%
What percent of the responses indicated that users were very confident?A) 63%
B) 21%
C) 45%
D) 33%
Unlock Deck
Unlock for access to all 129 flashcards in this deck.
Unlock Deck
k this deck
79
Refer to the following breakdown of responses to a survey of "Are you concerned about being tracked while connected to the Internet"? What is the class with the greatest frequency?
A) Very concerned
B) Somewhat concerned
C) No concern
D) None of the above
What is the class with the greatest frequency?A) Very concerned
B) Somewhat concerned
C) No concern
D) None of the above
Unlock Deck
Unlock for access to all 129 flashcards in this deck.
Unlock Deck
k this deck
80
Refer to the following breakdown of responses to a survey of "Are you concerned about being tracked while connected to the Internet"? What is the class interval for the frequency table above?
A) 10
B) 20
C) 40
D) None of the above
What is the class interval for the frequency table above?A) 10
B) 20
C) 40
D) None of the above
Unlock Deck
Unlock for access to all 129 flashcards in this deck.
Unlock Deck
k this deck
Unlock Deck
Unlock for access to all 129 flashcards in this deck.


